


Serviços Personalizados
Journal
Artigo
 texto em
  Inglês (pdf)
 Artigo em XML
 Referências do artigo
 Enviar este artigo por email
Indicadores
-
 Citado por SciELO
 -
 Acessos
Links relacionados
-
 Similares em
SciELO
Similares em
SciELO
Compartilhar

 Permalink
Revista mexicana de ciencias forestales
versão impressa ISSN 2007-1132
Rev. mex. de cienc. forestales vol.9 no.50 México Nov./Dez. 2018
https://doi.org/10.29298/rmcf.v9i50.254
Articles
Reconstruction of some droughts through growth rings for northern Mexico
1Facultad de Ciencias Forestales, Universidad Autónoma de Nuevo León. México.
2Centro Nacional de Investigación Disciplinaria en Relación Agua, Suelo, Planta, Atmósfera (Cenid-RASPA). Instituto Nacional de Investigaciones Forestales y Agrícolas y Pecuarias. México.
The historical impact of droughts on the social and economic stability of settlements in northern Mexico demands a better understanding of high-end low-frequency climate variability, which impacts water availability and produces grain scarcity for human consumption. Dendroclimatic reconstructions can define historical extreme drought frequencies, intensity, duration, and trends. Douglas-fir ring width chronologies were involved in this study to reconstruct seasonal precipitation variability in three northern Mexico states. The developed tree-ring series extended 75 to 99 years long all of them with high interseries correlation (0.56 to 0.72). Winter-Spring rainfall reconstruction showed high short-and long-term variability. Severe droughts were detected for the periods 1919 to 1924, 1948 to 1963, 1969 to 1979, 1988 to 2001, and 2008 to 2014. Seasonal winter-spring precipitation was significantly influenced by warm ENSO events with correlations ranging from 0.40 to 0.41. The effect of this circulatory pattern impacted an extended area in northern Mexico given the distance between studies’ sites greater than 500 km straight line. This study demonstrated the influence of the ENSO tele-connections in northern Mexico.
Key words: Correlation; ENSO; historical impacts of drought; proxy; dendroclimatic reconstruction; hydroclimatic variability
El impacto histórico de las sequías en la estabilidad social y económica de la población en el norte de México demanda de un mejor conocimiento de la variabilidad interanual y multianual del clima, que afecta particularmente la disponibilidad hídrica y, por ende, la producción de alimentos, así como para el propio consumo humano. De esta forma, los análisis dendroclimáticos pueden definir la frecuencia de estas sequías extremas, su comportamiento pasado y sus tendencias; por ello, se emplearon como proxy los anillos de crecimiento de Pseudotsuga menziesii, con el objetivo de analizar la variabilidad hidroclimática en tres estados del norte de México. Se desarrollaron tres series de tiempo dendrocronológicas de anillo total con una extensión de 75 a 99 años, que mostraron una intercorrelación entre series en un intervalo de 0.56 a 0.72. La reconstrucción de precipitación invierno-primavera indicó gran variabilidad interanual y decenal de los patrones de precipitación para las áreas de estudio. Sequías severas se reconstruyeron para los periodos (1919 a 1924, 1948 a 1963, 1969 a 1979, 1988 a 2001 y del 2008 al 2014). Al analizar la variabilidad de fenómenos de circulación general como El Niño Oscilación del Sur en las áreas de estudio se obtuvieron correlaciones positivas que variaron de 0.40 a 0.41, lo cual supone que, a pesar de la distancia entre sitios (mayor de 500 km en línea recta), fue posible identificar periodos de sequía comunes, los cuales demostraron los efectos que tiene la tele-conexión de El Niño en la variabilidad hidroclimática para el norte de México.
Palabras clave: Correlación; ENSO; impacto histórico de sequías; proxy; reconstrucción dendroclimática; variabilidad hidroclimática
Introduction
Knowing the climatological dynamics of the past is important to determine its variability in time, trends and possible future behavior (Villanueva-Díaz et al., 2007). The climate parameters and extreme climatic events that occurred in the past are difficult to determine through climatic station records, since these records, generally do not exceed 70 years long and show serious problems of quality and lack of information even for several consecutive years (IMTA, 2009). One way to extend climate information over time is through the use of proxy sources or indirect sources, one of them and high resolution, are the rings of trees, which dated to the exact year of their formation can generate paleoclimatic reconstructions with live and dead trees that can surpass the last 10 000 years (Bradley, 1999).
The dendroclimatic reconstructions developed for the north of Mexico extend for about a thousand years and indicate a significant influence on the inter-annual and multi-year variability of the winter precipitation of the El Niño Southern Oscillation (ENSO) tele-connection, with dominance of dry periods during the cold phase of ENSO and humid conditions when the warm phase dominates (Cleaveland et al., 2003; Méndez and Magaña, 2010; Villanueva et al., 2014).
The impact of the influence of ENSO, however, is not uniform throughout the region, due to the physiographic effect of mountainous systems such as the Sierra Madre Occidental and Sierra Madre Oriental, conditions that modify and modulate the influence of this and other circulatory phenomena, but in some areas of Durango and Chihuahua they can explain more than 30 % of the variability in the winter-spring precipitation (Cleaveland et al., 2003; Villanueva et al., 2014; Díaz-Ramírez et al., 2016).
The historical repercussion of the droughts in the social and economic stability of civilizations in Mexico, demands a better knowledge of the interannual and multiannual variability of the climate, which affects particularly the availability of water for human consumption, as well as for the production of food (Endfield and Fernández, 2006). In this way, dendroclimatic analyzes can define the frequency of these extreme droughts, their past behavior and their tendencies; such information contributes to the development of mitigation strategies for extreme and long-term hydroclimatic events that are likely to occur in years to come.
The present investigation was conducted in three states located in northern Mexico, where water is a limited resource for human activities. In this context, it is essential to make an adequate planning of water resources to mitigate problems of future availability, particularly considering the influence of climate change in this region, which predicts conditions of greater aridity (Seager et al., 2009; IPCC, 2014).
In this way, specific hydroclimatic reconstructions in sites that can provide information for nearby areas, especially for water-producing basins, -as is the case of this study- enrich the knowledge of climate variability in the central-southern region of Nuevo León, part of Coahuila and western Durango, three semi-arid zones in northern Mexico, which provide water for the development of agricultural activities, irrigation agriculture and human consumption.
Therefore, the objectives of this investigation were: 1) to analyze the influence of climatic variables on the radial increase of Pseudotsuga menziesii (Mirb.) Franco; 2) generate dendroclimatic reconstructions in the study sites and, 3) analyze the impact of atmospheric phenomena of general circulation on the interannual and multiannual variability of climate in this region and the frequency of extreme hydroclimatic events.
Materials and Methods
Study area
The study areas (Figure 1) are the following:

Sitios de muestreo = Sampling sites; Estaciones = Stations.
Figure 1 Geographic location of the sampling sites of Pseudotsuga menziesii (Mirb.) Franco in northern Mexico.
1) Cerro El Potosí (CPOT), located at 3 670 masl to 15 km from Galeana municipality, south of the state of Nuevo León (24°50'35''-24°53'16'' north; -100°13'12'', -100°15'12"west). The site belongs to the Sierra Madre Oriental, to the sub-province of the Gran Sierra Plegada (Great Folded Sierra), where the average annual rainfall is 400 to 600 mm and the average annual temperature of 12 °C to 18 °C (García and González, 1991).
2) Paraje Puentecillas (PNT), which is located in the area of Santa Bárbara, Pueblo Nuevo municipality, in the south of the state of Durango. The site is located in the limits of El Brillante ejido, coordinates 23º39' north and -105º 25' west. This area has the highest rainfall in the state, around 1 000 to 1 200 mm per year. The average annual temperature is 12 °C, the coldest average of 8 °C and the most extreme of 22 °C (Gordon, 1968; INEGI, 2005).
3) Sierra de Zapalinamé (SZAP), at the geographic coordinates of 25°15'00"-25°25'58.35" north and -100°47'14.5", -101°05'3.8" west, a system that forms part of the Saltillo and Arteaga municipalities; it is close to the city of Saltillo. The average annual temperature of the area is 18 °C, and the average annual rainfall is 498 mm (Meganck et al., 1981).
Field work
Sampling was carried out selectively with trees ≥ 20 cm DBH in an altitudinal range of 2 500 to 3 100 m. Some criteria for the selection consisted of the specimens having a cylindrical shaft, preferably to avoid problems of release and compression, rooted in shallow soils with long-lived appearance, which is presumed to have more potential to generate dendrochronological series as extensive as possible and with high climatic sensitivity (Constant, 2015). From each selected tree, three radial increments or growth cores (shavings) were taken with a 5 mm-thick Haglöf Sweden Pressler drill.
Laboratory work
The samples were processed through conventional dendrochronological techniques (Stokes and Smiley, 1968) at the Dendrochronology Laboratory of the Centro Nacional de Investigación Disciplinaria Relación Agua, Suelo, Planta, Atmósfera, Instituto Nacional de Investigaciones Forestales Agrícolas y Pecuarias (CENID-RASPA, INIFAP) and in the Laboratory of Carbon Sequestration of the Facultad de Ciencias Forestales de la Universidad Autónoma de Nuevo León (FCF-UANL).
The samples or shavings were mounted with glue in wooden moldings, holding them with adhesive tape to avoid that they twisted during drying and distorted the limits of annual growth due to the effects of moisture loss. Later they were sanding with different grades of sandpaper (300 to 600) and finally they were polished manually to facilitate the observation of growth rings through a high resolution Leica EZ4D stereomicroscope.
Counting of growth rings was made by graphs and tentative dates were assigned to each one (preferable). The measurement of the rings was made with the VELMEX system (0.001 mm), with the software MeasureJ2X for Windows (Voortech, 2014). The measurement data of the growth rings were analyzed with the COFECHA program (Holmes, 1983; Grissino, 2001), to verify the quality of the date by correlating periods of 50 years with overlap between periods of 25 years (Holmes, 1983).
For the elimination of the noise produced by biological (age) and geometric effects (a growing stems), the series were normalized by means of the ARSTAN program, with a double standardization, which included, in first instance, a negative exponential curve and straight lines of positive or negative regression (Cook, 1985). The values resulting from dividing the measurement value between the resulting value of the curve are known as dendrochronological indices and show an average close to unity and homogeneous variance (Fritts, 1976).
With the ARSTAN program, three versions of the chronology, standard, residual and Arstan were generated; each of them was calculated in a specific way. These series can be used for climate reconstruction purposes, particularly the residual chronology, in which autocorrelation between series has been eliminated (Cook, 1985).
Once the chronologies were obtained for the three study sites, a correlation analysis was performed with precipitation records from climatic stations near to each study site, in order to identify a possible significant relationship between both variables for the purpose of climate reconstruction; thus, the presence of events or periods of drought that will impact the north and other regions of Mexico is determined and it would be possible to argue about the possible causes of such behavior.
To define the period of rainfall that influences the growth of the species, records of climatic stations near the collection sites were used. The stations were chosen from the database of the National Meteorological System, compiled in the program Quick Extractor of Climatological Information (ERIC III) of the Mexican Institute of Water Technology (IMTA, 2007). Stations near the study areas were selected in order to integrate a database of average monthly rainfall at a regional level. The selected climatological stations for the state of Coahuila were: San Antonio de las Alazanas (SMN), San Antonio de las Alazanas (DGE), El Tunal, Jame and Saltillo, for the state of Durango, they were: La Peña, La Ciudad, El Salto 10093, El Salto 10025, Santa Bárbara 2 and Llano Grande and, finally, for the state of Nuevo León, three stations near the study area were identified: 18 de marzo, Mimbres and Galeana.
Data from the selected stations presented information on the monthly rainfall for the period 1954-1999 (46 years) for Coahuila, 1975-2004 (30 years) for Nuevo León and for Durango for the 1963-1985 period (23 years) (Table 1). During these years, a correlation analysis was carried out to detect the months or seasonal period in which there were significant relationships between the dendrochronological time series and the instrumental climate data.
Table 1 Climatological stations for this study.
| Climatological Stations | ||||||
|---|---|---|---|---|---|---|
| Area | Name | Latitude N (degrees) | Longitude W (degrees) | Altitude (masl) | Period (years) | % data |
| Nuevo León | Pablillo, Galeana | 24.917 | -100.400 | 512 | 1975-2004 | 97.5 |
| Coahuila | San A. de Alazanas (DGE) | 25.267 | -100.617 | 2170 | 1954-1999 | 86 |
| Durango | La Peña, Pueblo Nuevo | 23.550 | -105.400 | 2670 | 1963-1985 | 96.4 |
For the generation of the total reconstruction of the period for each study site, a linear regression analysis was made between the standard total ring chronology and the total length of the available climatic data. Due to the short extension of the precipitation data, only the calibration process was performed to generate the reconstruction equation. The verification process had to be carried out on the reconstructed data with information on available dendroclimatic reconstructions previously made for each of the study sites; as well as with records of historical documents of food production, problems of epidemics in humans and social conflicts (Endfield and Fernández, 2006); as well as with reconstructed drought indices for Mexico (Stahle et al., 2016).
To the precipitation reconstructions, a flexible curve (spline) with a rigidity of 67 % was adjusted, which conserves 50 % of the variance, this curve was smoothed at decade level to highlight multi-year events of water scarcity, related to droughts present in the reconstruction.
Similarly, the data of the general chronology was correlated with the Southern Oscillation Index (SOI, for its acronym in English) (NOAA, 2016), since this phenomenon has a high impact on climate variability in northern Mexico (Díaz et al., 2002; Cleaveland et al., 2003) and with a reconstruction of 1 100 years of standard annual indexes of ENSO (Li et al., 2011; KNMI, 2017).
Results and Discussion
A total of 114 growth series extracted from live trees of Pseudotsuga menziesii were dated (29 for CPOT, 45 for SOP and 40 for SZAP). The results of COFECHA indicated an intercorrelation between series of 0.72 for CPOT. This result is satisfactory, particularly when compared with the dendrochronological series of the species generated in other mountains of northern and northeastern Mexico, which indicate intercorrelation values between series of 0.75 (Canizales, 2011; Villanueva et al., 2010). For the SZAP area, an intercorrelation between series of 0.70 was obtained, a result similar to that obtained by Villanueva et al. (2009), which registered values of 0.71 and 0.72.
For PNT, an intercorrelation between series of 0.56 was obtained, a result lower than that recorded by Cerano et al. (2012), which is 0.70, despite having observed fluctuations in this parameter due to variations in growth. In any case, the intercorrelation value between series was higher than that indicated by Holmes (1986), which is 0.32 (p <0.01) to consider the dendrochronological series perfectly dated.
For PNT, an intercorrelation between series of 0.56 was obtained, a result lower than that recorded by Cerano et al. (2012), which is 0.70, despite having observed fluctuations in this parameter due to variations in growth. In any case, the intercorrelation value between series was higher than that indicated by Holmes (1986), which is 0.32 (p <0.01) to consider the dendrochronological series perfectly dated.
Regarding the periods in which there is a statistically good sample size for reconstruction purposes, better known as Expressed Population Signal (EPS), the reliable period for the PNT site is from 1919 to 2014 (sample depth 9 cores); for SZAP from 1916 to 2015 (> 6 cores) and from 1940 to 2015 (> 5 cores) for CPOT (Figure 2).
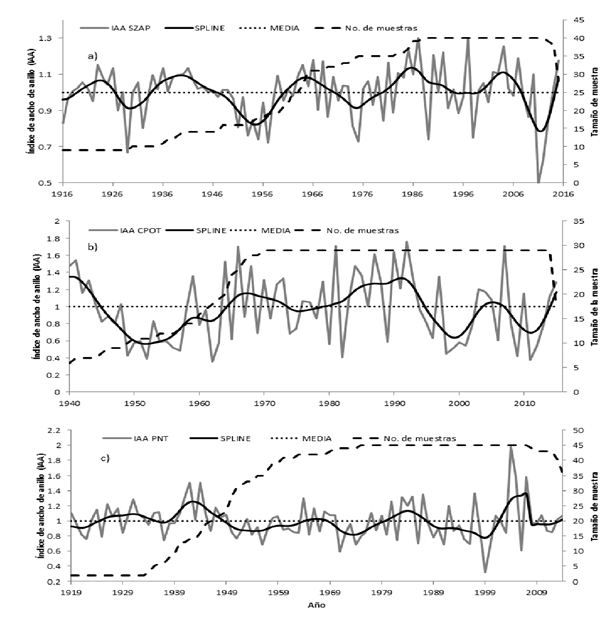
Índice de ancho de anillo = Ring width index; Media = Mean; No. de muestras = Number of samples; Tamaño de muestra = Sample size.
The dotted horizontal line is the average of the chronologies (value around 1.0); the continuous line in dark gray represents the value of the annual index of chronologies; the flexible line in dark color is the spline or decadal flexible line and the continuous broken line is the sample size involved in obtaining each annual index.
Figure 2 Standard total ring chronologies for the SZAP (a), CPOT (b) and SOP (c) sites.
Response function
Based on the association between the total ring growth rates and for the previous accumulated monthly precipitation data and during the growing season for each of the sites under study, it was determined that the rainfall period significantly influences (p <0.05) in the growth of the species corresponds to the winter-spring, which involves accumulated rain January-May for PNT and SZAP; for CPOT, the highest correlation was obtained for the January-July seasonal period; that is, its growth is more influenced by the rain that occurs in the cold season of the year while the influence of the summer rain seems to be minimal.
In this study, the relationship between wood and summer precipitation that could have a greater effect on the formation of this growth band was not analyzed. The rain that occurs in the winter-spring period is characterized by being of low intensity and long duration; this allows it not to exceed the infiltration rate and to be retained in the soil matrix to be available at the beginning and during the early stages of growth and early wood formation. In the study areas, the precipitation of the winter-spring interval constitutes around 50 % of the annual total (Figure 3).
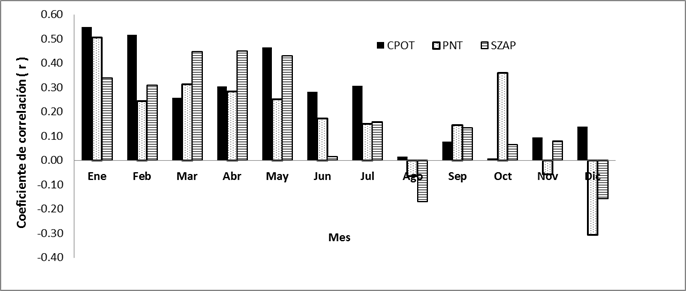
Coeficiente de correlación = Correlation coefficient; Mes = Month; Ene = January; Feb = February; Mar = March; Abr = April; May = May; Jun = June; Jul = July; Ago = August; Sep = September; Oct = October; Nov = November; Dic = December.
Figure 3 Correlation coefficient between the ring width index of Pseudotsuga menziesii (Mirb.) Franco in the study areas with the monthly precipitation obtained from climatic stations near the study sites.
A response of conifers to winter-spring precipitation has been described previously for the Sierra de Arteaga and Cerro El Potosí (Villanueva et al., 2010), and for El Presidio River Basin (Díaz-Ramírez et al., 2016), where positive correlations with early wood growth are described for different seasonal periods of precipitation; that is, January-April, January-May and January-August; although for this study only the total width of the ring was measured, similar results were achieved. On the other hand, the results of PNT and SZAP differ from those reported by Constante et al. (2009); Cerano et al. (2012) who made a reconstruction of the precipitation for the upper part of the Nazas river basin in Durango, and of the southeast of Coahuila, found a positive association between the ring width index and the accumulated monthly precipitation of December of the previous year and January of the current year of growth. In this study, when correlating the total ring width index and the accumulated precipitation, negative coefficients were obtained for the month of December, although PNT showed negative coefficients for November, not for SZAP.
Reconstruction of precipitation
The correlation between observed winter-spring precipitation data and the dendrochronological indexes of the standard version indicated a value of 0.79 for CPOT (n = 27, p <0.001), 0.89 for SZAP (n = 44, p <0.001) and 0.85 for SOP (n = 23, p <0.001); these results are indicative of the high association that both variables have and statistically indicate a good potential to generate a regression model for the purpose of reconstructing precipitation over the length of the chronology with an EPS> 0.85 (Figure 4).
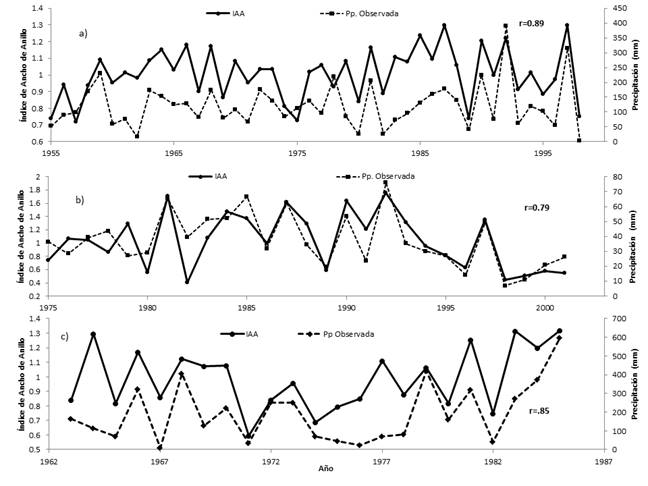
Índice de ancho de anillo = Ring width index; Año = Year; Precipitación = Precipitation.
The upper graph (a) corresponds to the SZAP site (1954-1999 period), the middle one (b) corresponds to CPOT (1975-2004 period) and the lower one (c) to PNT (1963-1985 period).
Figure 4 Behavior of the reconstructed data vs. total ring indexes in its standard version for each of the study sites.
The models used for the reconstruction included the precipitation records for the periods of 1975-2004 for CPOT, from 1963-1985 for PNT and from 1954-1999 for SZAP. For CPOT, the results indicated r = 0.79 (r2 = 0.62, p <0.0001) between the precipitation records and the ring indices. PNT presented r = 0.85 (r2 = 0.72, p <0.0001) and finally SZAP, r = 0.89 (r2 = 0.79, p <0.0001). The three series explain at least 60 % of the variation in the amount of rainfall that occurs in the winter-spring seasonal period. The regression models for the aforementioned lapses were considered valid in statistical terms for reconstruction purposes (Table 2).
Table 2 Statistics of the regression.
| CPOT | PNT | SZAP | |
|---|---|---|---|
| Pearson’s correlation | 0.79 | 0.85 | 0.89 |
| R2 | 0.62 | 0.72 | 0.79 |
| R2 adjusted | 0.61 | 0.68 | 0.77 |
| Typical error | 55.29 | 134.15 | 66.48 |
| Observations | 27 | 23 | 44 |
The linear regression models used were the following:
Where:
Yi = Reconstructed precipitation value (mm) for a specific year
Xi = Standardized index for ring width
Detection of dry periods
When applying the linear models, the reconstructed data were generated in the extension of the chronologies with EPS> 0.85. In this way, these data for the CPOT site cover the period 1940-2015 (75 years) (Figure 5), when significant periods of drought were detected, such as those of 1945-1964, 1973-1978, 1995-2003 and 2007- 2014. These results are similar to those of Arreola-Ortiz et al. (2010) and Canizales (2011). This study also detected periods of drought from 1993 to 1998 and from 2008 to 2014, corresponding to the effect of El Niño. In the period from 1945 to 1964, one of the most severe droughts occurred in northern and central Mexico (Díaz-Ramírez et al., 2016), and as a consequence, caused serious unemployment in a large part of the territory, which explains the beginning of the massive migration or bracerism to the United States of America (Florescano et al., 1995).
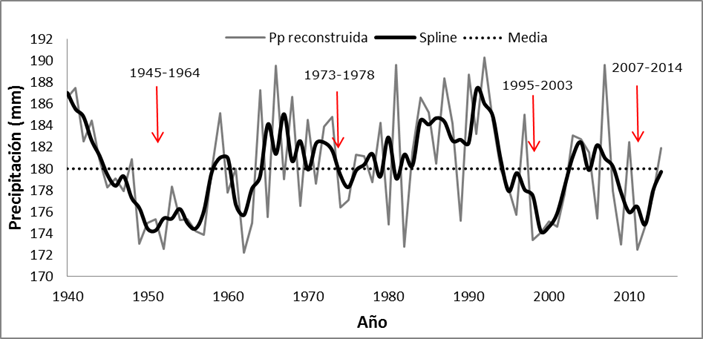
Precipitación = Precipitation; Año = Year.
The dotted line refers to the average precipitation in the area, the gray color indicates the reconstructed precipitation for the total period of the chronology and, finally, in black, highlights the drought periods at the decade level detected in the reconstruction.
Figure 5 Identification of dry events for CPOT.
Regarding the PNT site (Figure 6), the reconstructed 1919-2014 period (95 years) indicates important droughts such as those from 1919 to 1924, from 1948 to 1963, from 1969 to 1979, from 1988 to 2001 and from 2008 to 2014. These intervals coincide with those considered by Díaz-Ramírez et al. (2016) for the Presidio-San Pedro hydrological region, where the authors indicate the presence of intense droughts in the 1920s, 1950s and 1990s. During the period from 1982 to 1983, an intense ENSO event took place, causing droughts for almost the whole country (Magaña et al., 1999), an effect also detected in this reconstruction. Similar periods have been reported by Cerano et al. (2012) for northern Mexico.
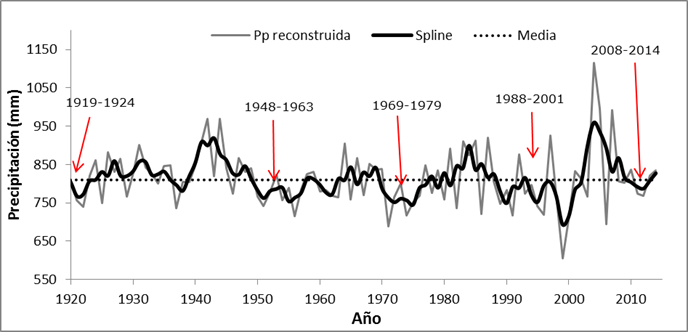
Precipitación = Precipitation; Año = Year.
The dotted line refers to the average precipitation in the area, the gray color indicates the reconstructed precipitation for the total period of the chronology and finally, the soft smoothed line in black highlights the decade-level drought periods detected in the reconstruction.
Figure 6 Identification of periods of drought for the PNT site.
Finally, for SZAP (Figure 7) the reconstruction extends from 1916 to 2015 (99 years), and it coincides with the dry periods detected in the previous reconstructions, that is, 1916-1919, 1926-1933, 1948-1960, 1970-1980, 1994-2000 and 2008 to 2014. These same periods have been addressed by Villanueva et al. (2011), which confirms that one of the most important droughts recorded in northern Mexico occurred during 1950-1965; it is considered the most intense of the 20th century (Stahle et al., 2011), because it caused severe socioeconomic damages, not only to the population of Durango, but also to neighboring states such as Chihuahua and Coahuila (Magaña et al., 1999), as a result of an intense ENSO event.
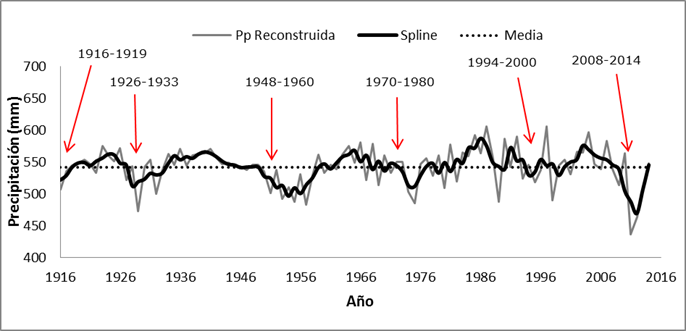
Precipitación = Precipitation; Año = Year.
The dotted line refers to the average precipitation in the area, the gray color indicates the reconstructed precipitation for the total period of the chronology and finally, the soft smoothed line in black highlights the decade-level drought periods detected in the reconstruction.
Figure 7 Drought events for the SZAP site.
Correlation with ENSO
ENSO is one of the circulatory phenomena with the greatest influence on the behavior of climatic variability in northern Mexico (Méndez and Magaña, 2010, Stahle et al., 2016). In this study, a positive relationship was determined between the ENSO indexes (KNMI, 2017) and tree growth, where the correlations observed were between 0.41 and 0.44 (Figure 8).
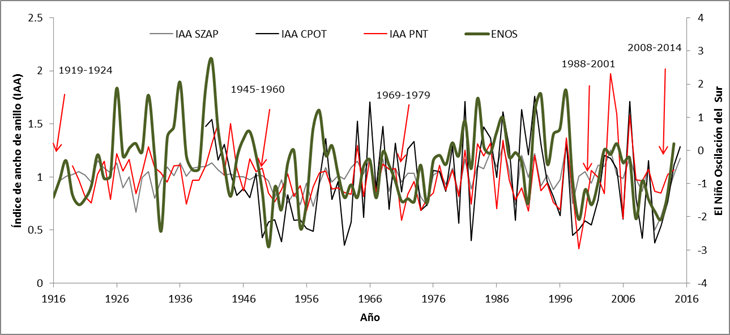
The gray line corresponds to the chronology generated for the SZAP site, while the black line corresponds to the chronology of CPOT, and in red that of PNT. The intensity of the ENSO indices is indicated by a smoothed military green line.
Figure 8 Periods of drought influenced by ENSO in northern Mexico.
According to the Intergovernmental Panel on Climate Change (IPCC, 2014), since 1960 atmospheric phenomena worldwide have been more related to the growth of forest masses at a local level. Likewise, the periods of drought found in the present investigation are related to the ENSO tele-connection, which is significant in northern and central Mexico; For example, the most notorious droughts occurred in the periods 1945-1960, 1969-1979, 1998 and 2011, are related to the influence of this phenomenon.
Conclusions
Although in this study the total ring chronologies extended in a range of 75 to 99 years, its length was not limiting to reconstruct some of the most intense dry episodes occurred during the 20th century and the first decade of the 21st century. These reconstructions corroborate droughts with reconstructed and instrumental data that indicate their regional character and that, due to their amplitude and intensity, severely affected the social and economic conditions of the human settlements in northern Mexico, which suffered widespread famines, and started massive migration to urban centers and to the United States of America. These droughts, due to their regional character, are caused by wide-ranging climatic phenomena, one of which is ENSO, which, through its tele-connections, significantly affects the studied places.
The area of impact where circulatory phenomena occur has serious repercussions on the social and economic stability of the populations that inhabit these regions. In this way, knowing the historical frequency of these phenomena and their intensity and duration, favors preventive mitigation measures against similar climatic events in those found in the reconstructions and that are not present in the instrumental records, which is crucial for decision making.
Acknowledgements
The authors thank Conacyt for the financing granted to the first author to study in the Master's Program in Forest Sciences at the FCF-UANL; the staff of INIFAP CENID-RASPA, for the support granted to analyze and process the data; the staff of the Sierra de Zapalinamé State Natural Reserve and the Technological Institute of El Salto, Durango, for the facilities provided to carry out the field work.
REFERENCES
Arreola-Ortiz, Ma. R., M. González-Elizondo y J. J. Návar-Cháidez. 2010. Dendrocronología de Pseudotsuga menziesii (Mirb.) Franco de la Sierra Madre Oriental en Nuevo León, México. Madera y Bosques 16(1): 71-84. [ Links ]
Bradley, R. S. 1999. Paleoclimatology: reconstructing climates of the quaternary. Academic Press Ltd. London, UK. 614 p. [ Links ]
Canizales V., P. A. 2011. Análisis dendroclimático y estimación del contenido de carbono como indicadores de cambio climático en Pseudotsuga menziesii (Mirb.) Franco, Cerro el Potosí, México. Tesis de Maestría. Facultad de Ciencias Forestales. Universidad Autónoma de Nuevo León. Linares, NL., México. 59 p. http://eprints.uanl.mx/view/creators/Canizales_Vel=E1zquez=3APamela_Anabel=3A=3A.html (17 de octubre de 2015). [ Links ]
Cerano P., J., J. Villanueva D., R. Valdez C., V. Constante G., J. González B. y J. Estrada Á. 2012. Precipitación reconstruida para la parte alta de la cuenca del río Nazas. Revista Mexicana de Ciencias Forestales 3(10): 1-17. http://www.scielo.org.mx/pdf/remcf/v3n10/v3n10a2.pdf (4 de abril de 2016). [ Links ]
Cleaveland, M. K., D. W. Stahle, M. D. Therrell, J. Villanueva D. and B. T Burns. 2003. Tree-ring reconstructed precipitation and tropical teleconnections in Durango, Mexico. Climate Change 59:369-388. [ Links ]
Constante G., V. 2015. Aplicación de técnicas dendrocronológicas en Pinus pseudostrobus Lindl. y Quercus canbyi Trel. para analizar la influencia climática y el cambio de uso de suelo. Tesis de Maestría. Facultad de Ciencias Forestales. Universidad Autónoma de Nuevo León. Linares, NL., México. 123 p. [ Links ]
Constante G., V., J. Villanueva D., J. Cerano P., E. Cornejo O. y S. Valencia M. 2009. Dendrocronología de Pinus cembroides Zucc. y reconstrucción de precipitación estacional para el sureste de Coahuila. Revista Ciencia Forestal en México 34(106): 17-39. [ Links ]
Cook, E. 1985. A time series analysis approach to tree ring standardization. Lamont-Doherty Geological Observatory. University of Arizona. https://repository.arizona.edu/handle/10150/188110 (2 de diciembre de 2015). [ Links ]
Díaz, S. C., M. D. Therrell, D. W. Stahle and M. K. Cleaveland. 2002. Chihuahua winter-spring precipitation reconstructed from tree-rings, 1647-1992. Climate Research 22:237-244. [ Links ]
Díaz-Ramírez, B., J. Villanueva-Díaz y J. Cerano-Paredes. 2016. Reconstrucción de la precipitación estacional con anillos de crecimiento para la región hidrológica Presidio-San Pedro. Madera y Bosques 22(1): 111-123. [ Links ]
Endfield, G. H. and I. Fernández T. 2006. Decades of drought, years of hunger: archival investigations of multiple year droughts in late colonial Chihuahua. Climate Change 75:391-419. https://link.springer.com/article/10.1007/s10584-006-3492-7 (26 de octubre de 2015). [ Links ]
Florescano, E., S. Swan, M. Menegus y E. Galindo. 1995. Breve historia de la sequía en México. Universidad Veracruzana. Biblioteca Universidad Veracruzana. México, D. F., México. 246 p. [ Links ]
Fritts, H. C. 1976. Tree rings and climate. London Academic Press. New York, NY, USA. 565 p. [ Links ]
García, A. y S. González. 1991. Flora y vegetación de la cima del Cerro El Potosí, Nuevo León, México. Acta Botánica Mexicana 13: 53-74. [ Links ]
Gordon, A. G. 1968. Ecology of Picea chihuahuana Martínez. Ecology 49: 880-896. [ Links ]
Grissino M., H. D. 2001. Evaluating crossdating accuracy: A manual and tutorial for the computer program COFECHA. Tree-Ring Research 57: 205-221. http://hdl.handle.net/10150/251654 (3 de enero de 2016). [ Links ]
Holmes, R. L. 1983. Computer-assisted quality control in tree-ring dating and measurement. Tree-Ring Bulletin 43:69-78. [ Links ]
Holmes, R. L. 1986. Guide for computer program ARSTAN. Laboratory ofTree-Ring Research . University of Arizona. Tucson, AZ USA. 50 p. https://www.ltrr.arizona.edu/pub/dpl-mac/68k/dpl.txt (10 de diciembre de 2015). [ Links ]
Instituto Mexicano de Tecnología del Agua (IMTA). 2007. Extractor Rápido de Información Climatológica, versión 3 (ERIC III). CD. s/p. [ Links ]
Instituto Mexicano de Tecnología del Agua (IMTA). 2009. Extractor Rápido de Información Climatológica III (ERIC), Software. Jiutepec, Mor., México. s/p. [ Links ]
Instituto Nacional de Estadística Geografía e Informática (INEGI). 2005. Anuario estadístico Durango. Aguascalientes, Ags. México. http://www.inegi.org.mx/geo/contenidos/recnat/usosuelo/ (16 de octubre de 2015). [ Links ]
Intergovernmental Panel on Climate Change (IPCC). 2014. Cambio climático 2014: Impactos, adaptación y vulnerabilidad-Resumen para responsables de políticas. Contribución del Grupo de trabajo II al V Informe de Evaluación del Grupo Intergubernamental de Expertos sobre el Cambio Climático. Organización Meteorológica Mundial. Ginebra, Suiza, 34 p. [ Links ]
Koninklijk Nederlands Meteorologisch Instituut. (KNMI). 2017. El Niño South Oscillation ENSO. https://climexp.knmi.nl/data/ienso_li.dat (23 de mayo de 2017). [ Links ]
Li, J. Xie, S. P, Cook E. R, Huang, G., D´Arrigo R., Liu, F., Ma, J., Zheng, X. 2011. Interdecadal Modulation of El Niño Amplitude During the Past Millennium. Climate Change. pp. 1-12. http://doi:10.1038/nclimate1086 (23 de mayo de 2017). [ Links ]
Magaña, V., J. L. Pérez, J. L. Vázquez, E. Carrizosa y J. Pérez. 1999. Los impactos del Niño en México. Secretaría de Educación Pública, Consejo Nacional de Ciencia y Tecnología. México, D. F. México. 229p. [ Links ]
Meganck, R. A., J. L. Carrera, F. C. Rodríguez y V. C. Serrato. 1981. Plan de manejo para el uso múltiple del cañón de San Lorenzo. Universidad Autónoma Agraria Antonio Narro. Organización de los Estados Americanos (OEA). Saltillo, Coah., México. 129p. [ Links ]
Méndez, M. y V. Magaña. 2010. Regional aspects of prolonged meteorological droughts over México and Central America. In: Special US Claver Drought Collection, American Meteorological Society, 23, pp.1175-1188. [ Links ]
National Oceanic and Atmospheric Administration (NOAA). 2016. Southern Oscillation Index SOI. https://www.esrl.noaa.gov/psd/gcos_wgsp/Timeseries/SOI/ (26 de enero de 2016). [ Links ]
Seager, R., M. Ting, M. Davis, M. Cane, N. Nike, J. Nakumara and D. K. Stahle. 2009. Mexican drought: an observational modeling and tree ring study of variability and climate change. Atmósfera 22(1):1-31. [ Links ]
Stahle, D. W., J. Villanueva D., D. J. Burnette, J. Cerano P., R. R. Heim Jr., F. K. Fye, R. Acuna S., M. D. Therrell, M. K. Cleaveland and D. K. Stahle. 2011. Major Mesoamerican droughts of the past millennium. Geophysical Research Letters. 38, L05703. https://doi.org/10.1029/2010GL046472 (17 de junio de 2017). [ Links ]
Stahle, D. W., E. R. Cook, D. J. Burnette, J. Villanueva, J. Cerano, J. N. Burns, D. Griffin, B. I. Cook, R. Acuña, M. C. A. Torbenson, P. Szejner and I. M. Howard. 2016. The Mexican Drought Atlas: Tree-ring reconstructions of the soil moisture balance during the late pre-Hispanic, colonial, and modern eras. Quaternary Science Reviews 149:34-60. https://doi.org/10.1016/j.quascirev.2016.06.018 (6 de junio de 2017). [ Links ]
Stokes, M. A. and T. L. Smiley. 1968. An introduction to tree-ring dating. The University of Chicago Press. Chicago, IL, USA. 73. [ Links ]
Villanueva D., J., J. Cerano P., V. Constante G., P. Z. Fulé y E. Cornejo O. 2009. Variabilidad hidroclimática histórica de la Sierra de Zapalinamé y disponibilidad de recursos hídricos para Saltillo, Coahuila. Madera y Bosques 15(3): 45-64. [ Links ]
Villanueva D., J., J. Cerano P., D. W. Stahle, V. Constante G., L. Vázquez S., J. Estrada Á. y J. D. Benavides S. 2010. Árboles longevos de México. Revista Mexicana de Ciencias Forestales 1(2): 7-29. [ Links ]
Villanueva D., J., J. Cerano P., V. Constante G., D. W. Stahle, J. Estrada Á. y M. M. Tostado P. 2011. hidroclimática histórica del Norte de México inferida con anillos de crecimiento de douglas-fir. Revista Mexicana de Ciencias Agrícolas Publicación especial 2: 221-334. [ Links ]
Villanueva D., J., J. Cerano-Paredes, J. Estrada Á., V. Constante G. and D. W. Stahle. 2014. Reconstruction of historical runoff in the upper Nazas river watershed, Durango. Revista Chapingo Serie Zonas Áridas 13(1) 21-25. http://dx.doi.org/10.5154/r.rchsza.2012.06.036 (19 de marzo de 2016). [ Links ]
Villanueva-Díaz, J., D. W. Stahle, B. H. Luckman, J. Cerano-Paredes, M. D. Therrell, M. K. Cleaveland and E. Cornejo-Oviedo. 2007. Winter-spring precipitation reconstructions from tree rings for northeast Mexico. Climatic Change 83: 117-131. http://doi.org/10.1007/s10584-006-9144-0. [ Links ]
Voortech.com. 2014. MeasureJ2X measurement software. http://www.voortech.com/projectj2x/docs/userGuide.htm (3 de diciembre de 2015). [ Links ]
Received: March 20, 2018; Accepted: September 28, 2018
 Este es un artículo publicado en acceso abierto bajo una licencia Creative Commons
