


Serviços Personalizados
Journal
Artigo
 texto em
  Inglês (pdf)
 Artigo em XML
 Referências do artigo
 Enviar este artigo por email
Indicadores
-
 Citado por SciELO
 -
 Acessos
Links relacionados
-
 Similares em
SciELO
Similares em
SciELO
Compartilhar

 Permalink
Revista mexicana de ciencias forestales
versão impressa ISSN 2007-1132
Rev. mex. de cienc. forestales vol.9 no.50 México Nov./Dez. 2018
https://doi.org/10.29298/rmcf.v9i50.249
Articles
Deposition and decomposition of litterfall of Pinus cooperi C.E.Blanco in El Salto, Durango, México
1Facultad de Ciencias Forestales, Universidad Autónoma de Nuevo León. México.
2Instituto de Silvicultura e Industria de la Madera, Universidad Juárez del Estado de Durango. México.
3División de Estudios de Posgrado e Investigación, Instituto Tecnológico El Salto. México.
4Facultad de Economía, Universidad Autónoma de Nuevo León. México.
The objective of the present work was to determine the deposition and decomposition rate of Pinus cooperi litterfall in plots subjected to different thinning intensities (treatments) (Control; T1:light thinning; T2: moderate; T3: intense; T4: very intense; T5: final crop tree thinning) at ejido La Ciudad in Pueblo Nuevo, Durango. After one year of observation, the maximum accumulation of litter was registered in the control treatment (4.90Mg·ha-1·year-1), followed by T2 (3.76Mg·ha-1·year-1), T1 (3.65Mg·ha-1·year-1), T4 (3.25Mg·ha-1·year-1), and T3 (3.04Mg·ha-1·year-1), while T5 had the lowest annual litterfall (2.58Mg·ha-1·año-1). The litterfall decomposition rate (k) was determined according to the Olson exponential model. Decomposition rates were higher during the first 150 days of incubation than during the subsequent 210 days. In both periods, there were significant differences between treatments. After 360 days of incubation, the greatest litterfall decomposition occurred in T3 (42.3 %) regardless of the forest conditions. In the rest of treatments, the decomposition varied from 30.2 (T1) to 37.1 % (T5). Although T3 was significantly faster than the other treatments under the microclimate conditions offered by the studied types of thinnings, no differences were detected between the decomposition rates with the five treatments evaluated in this study.
Key words: Litter bags; pine-oak forest; thinning intensity; deposition of leaf litter; decomposition rates; litter traps
El objetivo del presente trabajo fue determinar el depósito y la tasa de descomposición de hojarasca de Pinus cooperi en parcelas bajo diferentes intensidades de aclareos (tratamientos) (testigo; T1: Aclareo ligero; T2: Moderado; T3: Fuerte; T4: Severo; T5: Porvenir) en el ejido La Ciudad de Pueblo Nuevo, Durango. Después de un año de observación, la máxima acumulación de hojarasca se registró en el tratamiento Testigo (4.90 Mg ha-1 año-1), seguido por T2 (3.76 Mg·ha-1·año-1), T1 (3.65 Mg·ha-1·año-1), T4 (3.25 Mg·ha-1·año-1) y T3 (3.04 Mg·ha-1·año-1). El menor aporte anual de hojarasca se registró en el T5 (2.58 Mg ha-1 año-1). La tasa de descomposición (k) de la hojarasca se determinó a partir del modelo exponencial de Olson. Las tasas diarias de descomposición fueron mayores durante los primeros 150 días de incubación que en los 210 días subsiguientes. En ambos periodos hubo diferencias significativas entre los tratamientos. Después de 360 días de incubación, la mayor descomposición de hojarasca ocurrió en T3 (42.3 %), independientemente de la densidad residual de las parcelas; en el resto de los tratamientos, la descomposición varió de 30.2 (T1) a 37.1 %(T5). Aun cuando en T3 fue significativamente más rápida que en los demás tratamientos, bajo las condiciones de microclima que ofrecen estos tipos de aclareos, no se detectaron diferencias entre las tasas de descomposición para las cinco condiciones evaluadas en este estudio.
Palabras clave: Bolsas de descomposición; bosque de pino-encino; intensidad de aclareo; producción de hojarasca; tasas de descomposición; trampas de hojarasca
Introduction
In Mexico, the Pinus genus is one of the most important components of temperate climate vegetation; it occupies a primordial place from the ecological, economic, and social point of view, in both the timber and the non-timber production. It is often the dominant component of the vegetation, influencing the functional processes of the ecosystem, such as the biogeochemical and hydrological cycles and the wildfire regimes. Furthermore, it is a habitat and a source of food for wildlife. It also possesses a high economic value, as a source of sawn timber, veneer, plywood, firewood, pulp for paper, resins, tar, turpentine, alcohol, edible seeds, and other products. In addition, it offers important environmental services (water, oxygen, recreation, and carbon sequestration) and has an impact on the regional climate (Rzedowski, 1978; García and González, 1998; Ramírez-Herrera et al., 2005).
Although temperate forests admittedly have a great diversity and a high ecological value, their limited and increasingly fragmented distribution continues to be one of the greatest threats for their maintenance and conservation (Golicher et al., 2008). This reduction is due to poorly planned forest management, modification in the fire regime, the advancing agricultural frontier, grazing, atmospheric pollution, and forest pests and diseases (López-López et al., 1998; Saavedra-Romero et al., 2003). Many of their species are regarded as successionally intermediate or late, and therefore they require the preexistence of a tree cover in order to ensure a good establishment (Ramírez-Marcial et al., 2006).
Thus, the production and degradation of litterfall is a key ecosystemic process through which the organic remains of plants and animals are decomposed by physical (leaching and fragmentation) and biological agents (activity of soil microorganisms) into their elemental chemical constituents. As a result of this decomposition, they transfer nutrients to the soil in forms that can be utilized for microbial and vegetal production (Aber and Melillo, 1991; Aerts, 1997; Chapin et al., 2002); therefore, it determines the quality of the habitat.
Despite the great importance of the Pinaceae in the country, studies on the production and degradation of pine litterfall are scarce, and even inexistent for certain taxa. For this reason, it is crucial to carry out studies of these processes for the unstudied tree species, which are very important due to their wide distribution across Mexico. The present study evaluated the accumulation and degradation of litterfall in a thinning trial in masses of Pinus cooperi C. E. Blanco, based on the study of the effect of five thinning intensities.
Materials and Methods
Study area
The study was carried out in experimental plots treated with five different thinning intensities and a control, in a community of the Sierra Madre Occidental, particularly at the site named La Guajolota, at ejido La Ciudad, in Pueblo Nuevo, Durango, located at the coordinates 23°41'52.4" N and 105°36'59.5" W and an altitude of 2 800 m. The climate is temperate or semicold-semihumid, and temperate or semidry in the eastern side of the mountain chain. The mean annual temperature ranges is 20 to 22 °C; the mean annual precipitation ranges between 800 and 1 200 mm.
The area has a characteristic relief at its highest point, as well as plateaus aligned from the southwest to the northeast, hills, and undulated areas; in its middle part, where the altitude is lower, moderate to pronounced slopes culminate in canyons, which have a great variation in altitude and a generally steep topography.
Because of its geographical location, it includes various vegetation conditions, from pure oak and pine masses to mixed pine-oak forests. According to the information contained in the edaphological charts (INEGI, 1988), it comprises different types of soils, among which cambisols, lithosols and regosols are prevalent.
Types of treatments utilized in the experimental plot
The research was carried out in a permanent thinning trial, with the application of six different thinning intensities, described below (Huizar-Amezcua et al., 2016): Control: no thinning was performed; T1: Light thinning: removal of 10 % of the basal area per hectare; T2: Moderate thinning: removal of 20 % of the basal area per hectare; T3: Intense thinning: removal of 40 % of the basal area per hectare; T4: Severe thinning: removal of 60 % of the basal area per hectare, and T5: Thinning of Porvenir trees: removal of the trees that competed with the best 300 to 350 individuals per hectare.
The methodology followed in the establishment of the plots based on that developed by the Forestry Commission (Hummel et al., 1959). Their shape was square, covering a surface area of 625 m2 (25 m × 25 m), considered sufficient for the eventual permanence of 30 to 40 trees in those sites where the maximum intensity was applied. Furthermore, each plot is surrounded by a 5 to 10 m wide perimeter fringe, with the same treatment as within, in order to avoid the edge effect on the trees located at the boundaries of the plots.
Vegetation of the study area
The main vegetation types located at the study site are pine and pine-oak associations, which are mixes of the genera Pinus and Quercus in different proportions; the dominant species is Pinus cooperi C. E.Blanco.
This community of conifers is characterized by its high density and by the low diversity of its floristic components. From the structural point of view, the dominant elements of its tree stratum have a height that ranges between 15 and 35 m, although some individuals are 40 m tall. It is distributed from the south of the state of Chihuahua to central Durango, at an altitude interval of 2 000 to 2 800 m. It usually forms pure masses; however, it is sometimes associated with Quercus sideroxyla Bonpl., Juniperus deppeana Steud. and Pinus leiophylla Schiede ex Schltdl. ex Cham. Table 1 shows certain characteristics of the dominant vegetation in each treatment; the diameter at normal height (cm), the height (m) and the crown cover (m2) of all the individuals was determined with two measurements using the cardinal directions (north-south and east-west) as reference.
Table 1 Characteristics of Pinus cooperi C. E.Blanco with each treatment.
| Treatment | n | Cover (m2) | Diameter (cm) | Height (m) | ||||||
|---|---|---|---|---|---|---|---|---|---|---|
| Min. | Max. | Mean | Mn. | Max. | Mean | Min. | Max. | Mean | ||
| Control | 125 | 1.7 | 34.7 | 13.6 | 6.4 | 27.3 | 14.0 | 5.3 | 19.0 | 13.7 |
| Light | 80 | 3.9 | 47.1 | 17.6 | 9.5 | 27.0 | 16.1 | 8.4 | 18.0 | 12.9 |
| Moderate | 78 | 2.4 | 40.7 | 16.8 | 6.0 | 26.6 | 15.1 | 8.4 | 17.6 | 13.4 |
| Strong | 73 | 4.5 | 32.6 | 15.7 | 8.0 | 28.3 | 15.2 | 7.1 | 18.7 | 12.5 |
| Severe | 52 | 4.7 | 47.7 | 19.5 | 13.5 | 27.1 | 16.0 | 8.1 | 16.1 | 13.4 |
| Porvenir | 50 | 10.1 | 37.9 | 20.8 | 11.9 | 24.8 | 16.4 | 6.1 | 17.9 | 13.9 |
| Total | 458 | |||||||||
Literfall collection
Three 1.0 m2 litter traps ―built with a beveled wood frame and a fine (1 mm) plastic mesh bottom to prevent the accumulation of water during rainy periods― were established with the purpose of estimating the litterfall deposition in each treatment. The baskets or traps were placed at 0.50 m above the ground level in order to intercept the litterfall. Their content was deposited in paper bags labeled with the data for each treatment, date and trap number. This procedure was carried out every 15 days, from April, 2016, to March, 2017. Every month, the two biweekly collections were mixed together and dried at 65 °C during 72 hours in a 16EG GCA Corporation convection oven.
The litterfall content was manually classified into four categories: leaves, reproductive structures (RS: flowers, fruits, and seeds), branches (diameter <2.0 cm), and other components (unidentified tissues, fine structures, bark, insect bodies, insect feces, etc.). The sum of the samplings per month, per repeat, and per treatment determined the annual litterfall production (Mg·ha-1·year-1).
Litterfall decomposition
The litterfall decomposition rate in the various treatments was assessed using the litterbag approach (Bärlocher, 2005). The litter was collected a month before the beginning of the experiment (March); it was dried in the open air during one week, and 10 g samples were put into black 10 cm × 10 cm polypropylene bags, with a 1 mm2 mesh, allowing access to the interior of the bags by detritivorous invertebrates, but minimizing losses due to fragmentation (Douce and Crossley, 1982).
A mixture reflecting the relative proportion of the structural components of the original matter (leaves, branches, reproductive structure, and other litterfall components) was deposited in each bag.
A total of 300 bags were used during the study period (50 bags per treatment). These were placed on the ground to delimit the boundaries of each plot based on the cardinal directions; 12 bags were placed to the north (0°) and at the center of the plot, 13 were placed to the southeast (135°) and to the southwest (225°). Subsequently, every 30 days for 360 days, five bags per treatment were removed at random and dried at 70 °C in a 16EG GCA Corporation convection oven during 48 hours. The percentage of biomass loss equivalent to the decomposition was estimated based on the differences in relation to the initial weight, for this a C1 Sartorius digital scale was used.
The values for the remaining mass were adjusted to the simple exponential regression model (Olson, 1963) according to the formula:
Where:
X t = Litterfall mass through time (g)
X 0 = Initial litterfall mass (g)
β 0 = Value of the ratio in time zero
e = Napier’s constant
k = Decomposition constant
t = Time (days)
The theoretical time required for 50 %, 95 % and 99 % decomposition of the litter was also estimated, based on the formula:
Environmental variables
Room temperature (°C) and relative humidity (%) were calculated (on an hourly basis) at the study site, with HOBO automated sensors (HOBO U23 Pro v2, Onset, Bourne, MA); the rainfall (mm) was recorded on a daily basis using a similar equipment (Table 2).
Table 2 Temperature (°C), relative moisture (%) and rainfall (mm) during the study period.
| Month | Rainfall (mm) | Temperature (ºC) | Relative moisture | ||
|---|---|---|---|---|---|
| Max. | Min. | Mean | (%) | ||
| April 2016 | 0 | 20.1 | 2.3 | 11.2 | 40.6 |
| May | 8.9 | 23.4 | 5.8 | 14.7 | 53.4 |
| June | 82.3 | 22.3 | 7.7 | 14.3 | 73.8 |
| July | 193.1 | 21.0 | 8.7 | 13.7 | 85.7 |
| August | 240.4 | 19.2 | 9.6 | 13.4 | 90.6 |
| September | 137.6 | 20.0 | 8.7 | 13.4 | 86.9 |
| October | 53.6 | 20.2 | 5.2 | 12.0 | 76.0 |
| November | 24.3 | 16.5 | 2.8 | 8.8 | 78.7 |
| December | 83.5 | 16.3 | 0.6 | 7.5 | 69.2 |
| January 2017 | 7.3 | 15.3 | 0.3 | 7.2 | 55.9 |
| February | 16.7 | 16.7 | -0.3 | 7.8 | 51.4 |
| March | 7.7 | 19.3 | 1.0 | 10.1 | 50.5 |
| Total | 855.4 | ||||
Statistical analyses
The data were subjected to a statistical analysis of an experimental design with a classification criterion (Ott, 1993). The mean comparison test was applied according to Tukey’s procedure, with a significance level of 0.05 (Ott, 1993). The loss of litter weight through time was calculated and charted in order to evaluate the decomposition rate. The weight loss curve was then adjusted, using exponential non-linear regressions (tRatio= β 0 e-kt) and the decomposition coefficient k was calculated for each treatment based on the model with the best adjustment. Furthermore, a Pearson’s correlation analysis was performed in order to determine the degree of association between litter degradation with the various treatments and certain environmental variables. All the analyses were performed using SPSS® (Statistical Package for Social Sciences), standard version 20.0 for Windows (SPSS, 2012).
Results and Discussion
Literfall production
Figure 1 illustrates the monthly production of litterfall: (a), leaves (b), reproductive structures (RS: c), branches (d) and other components (e). The highest total production occurred in December, with T2 (130.9 g m-2), and the lowest, with T5 (1.6 g m-2), in March. In all six sites, the lowest productions were recorded in March, and the highest, in December.
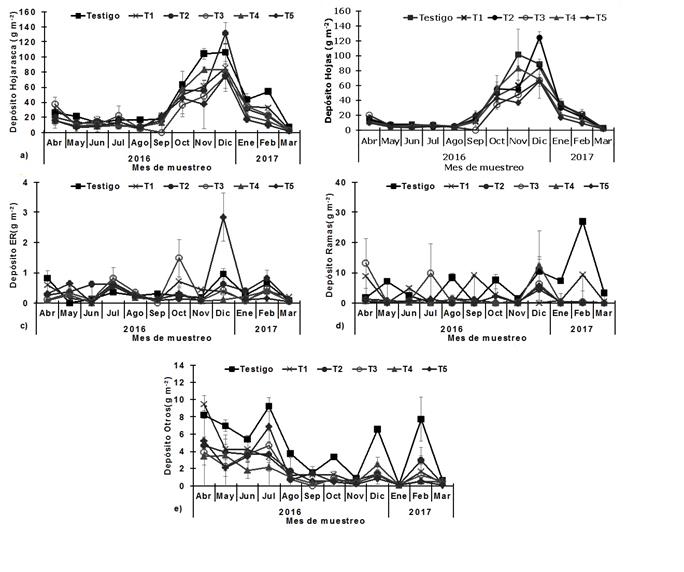
Testigo = Control; Mes de muestreo = Sampling month; Depósito de hojarasca = Deposit of litterfall; Depósito de hojas = Deposit of leaves; Depósito ER = Deposit of RS; Depósito de ramas = Deposit of branches.
Figure 1 Monthly production (mean ± standard error, n=3) of the litter components for the various study treatments.
The production of leaves was higher than that of the control, with an interval of 3.1 (March) to 101.7 g m-2 (December); the minimum leaf productions occurred with T5, with 1.5 (March) to 65.8 g m-2 (December). The collection of reproductive structures was most limited in March (0.03), and much more abundant (2.84 g m-2) in December, with T5. The maximum branch production occurred in February (27.01), and the minimum, in July (0.10 g m-2), in the control. As for the “Others” component, the minimum production (0.07) was obtained in March with T4, and the maximum production (9.22 g m-2), in October, in the control.
According to the results shown in Table 3, litter production was most abundant in the control (4.90 Mg·ha-1·year-1), while T5 exhibited the smallest amount (2.58 Mg·ha-1·year-1). The leaves were the main source of litter, with 72.5 % (Control) to 89.7 % (T2) of the annual production, followed by the branches, with values ranging between 2.7 % (T2) and 15.6 % (Control), and “Others”, with 5 % (T4) to 11 % (Control), while reproductive structures contributed the least organic matter to the litter, with values under 1 % (T4) to 2.1 % (T5) of the total (Figure 2). There were no significant differences (P>0.05) between treatments in the leaves, reproductive structures, and total components. However, the branches and “Others” components did exhibit such differences (P<0.05).
Table 3 Annual deposition (Mg·ha-1·year-1) of the litter components and statistics (F and P values) according to the variance analysis of the experimental design with a classification criterion.
| Components | Treatments | Statistic | ||||||
|---|---|---|---|---|---|---|---|---|
| Control | T1 | T2 | T3 | T4 | T5 | F | P | |
| Leaves | 3.55 | 2.96 | 3.37 | 2.50 | 2.91 | 2.21 | 1.60 | 0.289 |
| Branches | 0.76 | 0.36 | 0.10 | 0.29 | 0.14 | 0.10 | 8.13 | 0.012 |
| Others* | 0.54 | 0.28 | 0.24 | 0.19 | 0.16 | 0.21 | 7.41 | 0.018 |
| Reproductive Structure | 0.04 | 0.04 | 0.04 | 0.04 | 0.02 | 0.05 | 0.41 | 0.823 |
| Total | 4.90 | 3.65 | 3.76 | 3.04 | 3.25 | 2.58 | 2.57 | 0.141 |
Others* = Unidentified material, insect parts and feces; Thinning treatments: T1= Light; T2= Moderate; T3= Intense; T4= Severe, and T5= Porvenir.
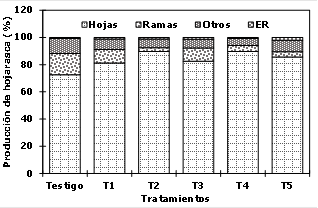
Tratamientos = Treatments; Producción de hojarasca = Production of litter.
Figure 2 Composition of the litter in percentages for the six treatments.
Regardless of the components of the total or individual litterfall for each treatment, the values correspond to the productions previously observed in studies of Pinus patula Schiede ex Schltdl. & Cham., Quercus humboldtii Bonpl., Quercus potosina Trel. and Pinus cembroides Zucc. (Zapata et al., 2007; Pérez-Suárez et al., 2009; Reyes-Carrera et al., 2012), which recorded productions of 2.43 to 8.30 Mg·ha-1·year-1.
The largest contribution to litter was obtained from the leaves from all the plots, with more than 70 % of the total; this result agrees with the findings of Yang et al. (2001); Nájera and Hernández (2009) and López-Hernández et al. (2013).
Litterfall degradation
There were two phases of litterfall decomposition in terms of its results: one at the beginning of the process, when the degradation was fastest at 30 to 150 days, and then diminished until it became stable at 180 to 360 days; during this stage, there was a marked drop at 300 days, and, subsequently, the tendency to degradation occurred again in all the treatments. This agrees with the findings cited in the literature (Xuluc-Tolosa et al., 2003; Goma-Tchimbakala and Bernhard-Reversat, 2006; Villavicencio-Enríquez, 2012).
The initial exponential loss is due to the leaching of the most soluble substances (Bocock et al., 1960), as well as to the fragmentation by microbial populations, which begin by consuming those substances that are most easily decomposed (Aerts and Chapin, 2000).
The decomposition rates of the second phase are influenced by the content of hard-to-degrade materials, such as hemicelluloses and lignin (Bernhard-Reversat, 1993). The use of newly fallen leaves in this study made it possible to significantly increase the initial loss percentage, as fresh or tender leaves are generally more leachable than ripe or dry leaves (Bernhard-Reversat, 1972; Chara et al., 2007).
The average weight of litterfall decomposition (Figure 3a) after 360 days was 3.0 g (T1) to 4.2 g (T3), with percentages ranging between 30.2 % (T1) and 42.3 % (T3), while the remaining weight of litter decomposition (Figure 3b) after 360 days was 7.0 g (T1). The results show that slightly more weight was lost with the intense thinning (T3) than with any of the other treatments, while the remaining weight at the end of the experiment was highest with the light thinning (T1).
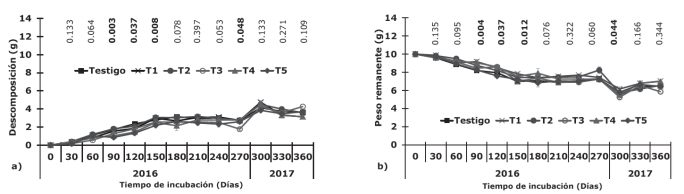
The p values of the variance analysis for detecting significant differences between treatments for each incubation time appear in bold characters. Control (■), T1 (×), T2 (•), T3 (○), T4 (▲) and T5 (♦).
Figure 3 Decomposition (a) and remaining weight (b) of the litterfall by incubation period for the six treatments.
As for the decomposition rates (Table 4), the values of k (g g-1 t) ranged between 0.00129 (Control) and 0.00141 (T3). Apparently, the litter decomposition rate was similar in the six treatments; no significant differences (P>0.05) were registered in the decomposition intervals between the five thinning intensities and the control. However, the values were low, compared to those estimated for temperate ecosystems. For example, Rocha-Loredo and Ramírez-Marcial (2009) obtained k values of 1.40 to 1.44, with decomposition percentages ranging between 34 % and 52 % for pine and pine-oak forests (Quercus crassifolia Bonpl., Quercus sapotifolia Liebm. and Pinus oocarpa Schiede ex Schltdl.) in Chiapas.
Table 4 Decomposition rate k (day-1) for attaining 50, 95 and 99 % degradation of the dry weight, calculated using the formula Xt/Xo =β 0 e-kt, with each of the six treatments of the study.
| Treatment | k (g g-1 t) | Confidence interval 95 % | Decomposition in days | R 2 | |||
|---|---|---|---|---|---|---|---|
| Upper Limit | Lower Limit | t.50 | t.95 | t.99 | |||
| Control | 0.00129 | 0.00147 | 0.00112 | 535.2 | 2313.3 | 3556.1 | 0.783 |
| T1 | 0.00130 | 0.00153 | 0.00107 | 533.5 | 2305.9 | 3544.8 | 0.676 |
| T2 | 0.00134 | 0.00155 | 0.00114 | 515.5 | 2228.2 | 3425.4 | 0.739 |
| T3 | 0.00141 | 0.00166 | 0.00115 | 492.8 | 2129.9 | 3274.2 | 0.677 |
| T4 | 0.00131 | 0.00153 | 0.00109 | 527.7 | 2280.8 | 3506.2 | 0.710 |
| T5 | 0.00132 | 0.00151 | 0.00114 | 523.8 | 2263.9 | 3480.2 | 0.782 |
Thinning treatments: T1= Light; T2= Moderate; T3= Intense; T4= Severe; T5 = Porvenir; t.50= 50 % degradation; t.95= 95 % degradation; t.99= 99 % degradation.
Zhang et al. (2008) registered information for 293 k values, corresponding to 70 studies, and fixed them between 0.006 and 4.993; the lowest values were for the Arctic tundra, and the highest, for the tropical rainforest. Stohlgren (1988) cites k values of 0.18 to 0.62 for mixed conifer forests in the United States of America, and the time required for a 95 % decay ranged between 11 and 27 years. In the present study, the registered value was 5.8 years (2 129.8 days) to 6.3 (2 313.3 days), which is lower than that of the documented intervals.
The differences in the constants reflect not only those already extant by type of litterfall but also the influence of environmental factors that limit decomposition. In this regard, the temperate area is considered to be geographically critical for the decomposition of matter, since one of the factors that limit decomposition are the low temperatures and low rainfall rates during the study period, which were significantly and negatively correlated with decomposition (P<0.05) (with averages of -0.535 and -0.707, respectively).
The results are consistent with the records of several researchers, according to whom climate factors are more important at the global level, as they account for variations in the decomposition rates (Lavelle et al., 1993; Couteaux et al., 1995; Hättenschwiler, 2005). However, when litter decomposition is studied at a local level, as in the present work, climate factors lose relevance, and the chemical quality of the material becomes the main factor, particularly in tropical regions, where high temperatures and humidity levels are relatively constant (Didham and Lawton, 1999; Xuluc-Tolosa et al., 2003; Vasconcelos and Laurance, 2005).
As for the structure of the vegetation, there were no significant effects on the decomposition of the litterfall. This agrees with the findings of Barriga (2000), who obtained no significant differences in the decomposition rates when comparing fragmented areas of the humid montane forests of Colombia; this author concludes that the decomposition process was not altered after the occurrence of anthropogenic disturbances. Whereas Chacón and Dezzeo (2007) determined a similar decomposition rate in forests with and without disturbances, and therefore, while the disturbances considered in their study did affect the structure of the forests, they had no significant impact on the littefall decomposition process.
Conclusions
There is spatial and temporal variation in the production of each component of the litterfall, for which the lowest value was obtained with T5 (2.58 Mg·ha-1·year-1). The dynamics in the production of litterfall follows a particular pattern according to the time of the year and constitutes an important fraction of the total biomass production, with maximum values for the last months of the year, and minimum values at the beginning of the year. The total production of branches and other components is significantly different in the six treatments assessed in the study, while there is no significant differences in the production of leaves, reproductive structure, and total production. Leaves are the main components. Marked differences were observed in the number of individuals due to the application of the treatments; however, there is no relationship between the production of litterfall and the decomposition constant (Olson’s k). Furthermore, the degree of intervention (thinning intensity) had no effect on the decomposition patterns during the 360 days of incubation (P>0.05), which confirms that the decomposition rate is similar for the five types of thinning applied.
Acknowledgements
The authors wish to express their gratitude to the Consejo Nacional de Ciencia y Tecnología, Conacyt (National Council for Science and Technology) for granting the post-doctorate scholarship to the first author. Also, to Jazmín Guadalupe Rodríguez and to Víctor Manuel Ayala for their participation in the in-field samplings and laboratory activities.
REFERENCES
Aber J., D. and J. M. Melillo. 1991. Terrestrial Ecosystems, Saunders College Publishing. Philadelphia, PA, USA. 429 p. [ Links ]
Aerts, R. 1997. Climate, leaf litter chemistry and leaf litter decomposition in terrestrial ecosystems: a triangular relationship. Oikos 79:439-449. [ Links ]
Aerts, R. and F. S. Chapin. 2000. The mineral nutrition of wild plants revisited: a re-evaluation of processes and patterns. Advances in Ecological Research 30:1-67. [ Links ]
Bärlocher, F. 2005. Leaf mass loss estimated by litter bag technique. In: Graça M., A. S., F. Bärlocher, M. O. Gessner (eds.). Methods to study litter decomposition practical guide. Springer. Dordrecht, Netherlands. pp. 37-42. [ Links ]
Barriga A., P. 2000. Comparación de las tasas de descomposición de hojarasca y de los grupos funcionales de microorganismos involucrados, entre áreas continuas y fragmentadas de bosque húmedo montano bajo al occidente de la sabana de Bogotá (Cundinamarca, Colombia). Tesis de maestría. Pontificia Universidad Javeria. Bogotá, Colombia. 145 p. [ Links ]
Bernhard-Reversat, F. 1972. Decomposition de la litiere de feuilles en foret ombrophile de Basse Cote-d'Ivoire. Oecologia Plantarum 97:279-300. [ Links ]
Bernhard-Reversat, F. 1993. Dynamics of litter and organic matter at the soil-litter interface in fast-growing tree plantations on sandy ferrallitic soils (Congo). Acta Oecologica 14: 179-195. [ Links ]
Bocock K., L., O. J. Gilbert, C. K. Capstick, D. C. Turner, J. S. Ward and M. J. Woodman. 1960. Changes in leaf litter when placed on the surface of soil with contrasting humus types. European Journal of Soil Science 11:1-9. [ Links ]
Chacón, N. and N. Dezzeo. 2007. Litter decomposition in primary forest and adjacent fire-disturbed forests in the Gran Sabana, southern Venezuela. Biology and Fertility of Soils 43:815-821. [ Links ]
Chapin F., S., P. A. Matson and H. A. Monney. 2002. Principles of terrestrial ecosystem ecology. Springer-Verlag, New York, NY, USA. 423p. [ Links ]
Chara, J., D. Baird, T. Telfer and L. Giraldo. 2007. A comparative study of leaf breakdown of three native species in a slowly-flowing. International Review of Hydrobiology 92(2):183-198. [ Links ]
Couteaux M., M., P. Bottner and B. Berg. 1995. Litter decomposition, climate and litter quality. Trends in Ecology & Evolution 10:63-66. [ Links ]
Didham R., K. and J. H. Lawton. 1999. Edge structure determines the magnitude of changes in microclimate and vegetation structure in tropical forest fragment. Biotropica 31(1):17-30. [ Links ]
Douce G., K. and D. A. Crossley. 1982. The effect of soil fauna on litter mass loss and nutrient dynamics in arctic tundra at Barrow, Alaska. Ecology 63:523-537. [ Links ]
García A., A. y M. S. González. 1998. Pináceas de Durango. Instituto de Ecología, A.C. Comisión Nacional Forestal. Durango, Dgo., México. 187 p. [ Links ]
Golicher D., J., L. Cayuela, J. R. Alkemade M., M. González-Espinosa and N. Ramírez-Marcial. 2008. Applying climatically associated species pools to the modeling of compositional change in tropical montane forests. Global Ecology and Biogeography 17:262-273. [ Links ]
Goma-Tchimbakala, J. and F. Bernhard-Reversat. 2006. Comparison of litter dynamics in three plantations of an indigenous timber-tree species (Terminalia superba) and a natural tropical forest in Mayombe, Congo. Forest Ecology Management 229:304-313. [ Links ]
Hättenschwiler, S. 2005. Effects of Tree Species Diversity on Litter Qualityand Decomposition. In: Scherer-Lorenzen, M., Ch. Körner and E. D. Schulze (eds.). Ecological Studies Vol. 176. Forest Diversity and Function: Temperate and Boreal Systems. Berlín Heidelberg, Germany. pp. 149-164. [ Links ]
Huizar-Amezcua, F., J. J. Corral-Rivas, C. A. López-Sánchez, H. L. Ávila-Márquez y M. G. Nava-Miranda. 2016. Remedición y mantenimiento de seis ensayos de aclareos en masas regulares y el establecimiento de tres primeros ensayos de cortas selectivas en masas mixtas e irregulares en los bosques de la UMAFOR 1008. Informe final del proyecto. Instituto de Silvicultura e Industria de la Madera. Durango, Dgo., México. 25 p. [ Links ]
Hummel F., C., G. M. Locke, J. N. Jeffers and J. M. Christie. 1959. Code of sample plot procedure. Code of sample plot procedure. Her Majesty’s Stationary Office. Forestry Commission Bulletin Num. 31. London, UK. 114 p. [ Links ]
Instituto Nacional de Estadística y Geografía (INEGI). 1988. Atlas nacional del medio físico de México. Primera reimpresión. Secretaría de Programación y Presupuesto. México, D.F., México. 224 p. [ Links ]
Lavelle, P., E. Blanchart, A. Martin, S. Martin and A. Spain. 1993. A hierarchical model for decomposition in terrestrial ecosystems: application to soils of the humid tropics. Biotropica 25(2):130-150. [ Links ]
López-Hernández, J. M., H. González-Rodríguez, R. G. Ramírez-Lozano, I. Cantú-Silva, M. V. Gómez-Meza, M. Pando-Moreno y A. E. Estrada-Castillón. 2013. Producción de hojarasca y retorno potencial de nutrientes en tres sitios del estado de Nuevo León, México. Polibotanica 35:41-64. [ Links ]
López-López, M. A., J. Velásquez-Mendoza, A. Velásquez-Martínez, V. González-Romero y V. M. Cetina-Alcalá. 1998. Estado nutrimental de Abies religiosa en una área con problemas de contaminación ambiental. Agrociencia Serie Recursos Naturales Renovables 1:53-59. [ Links ]
Nájera L., J. A. y E. Hernández H. 2009. Acumulación de biomasa aérea en un bosque coetáneo de la región de El Salto, Durango. Ra Ximhai 5(2):225-230. [ Links ]
Olson J., S. 1963. Energy storage and the balance of producers and decomposers in ecological systems. Ecology 44(2):322-331. [ Links ]
Ott, L. 1993. An introduction to statistical methods and data analysis. 2nd ed. Duxbury Press. Boston, MA, USA. 769 p [ Links ]
Pérez-Suárez, M., J. T. Arredondo-Moreno, E. Huber-Sannwald and J. J. Vargas-Hernández. 2009. Production and quality of senesced and green litterfall in a pine-oak forest in central-northwest Mexico. Forest Ecology and Management 258(7):1307-1315. [ Links ]
Ramírez-Herrera, C., J. J. Vargas-Hernández y J. López-Upton. 2005. Distribución y conservación de las poblaciones naturales de Pinus greggii. Acta Botánica Mexicana 72:1-16. [ Links ]
Ramírez-Marcial, N., A. Camacho-Cruz, M. González-Espinosa and F. López-Barrera. 2006. Establishment, survival and growth of tree seedlings under seccessional Montane Oak Forests in Chiapas, Mexico. In: Kappelle, M. (ed.). Ecology and Conservation of Neotropical Montane Oak Forests, Ecological Studies 185. Springer, Berlín, Alemania. pp. 177-189. [ Links ]
Reyes-Carrera, S. A., J. Méndez-González., J. A. Nájera-Luna y J. Cerano-Paredes. 2012. Producción de hojarasca en un rodal de Pinus cembroides Zucc. en Arteaga, Coahuila, México y su relación con las variables climáticas. Revista Chapingo Serie Ciencias Forestales y del Ambiente 19(1):147-155. [ Links ]
Rocha-Loredo, A. G. y N. Ramírez-Marcial. 2009. Producción y descomposición de hojarasca en diferentes condiciones sucesionales del bosque de pino-encino en Chiapas, México. Boletín de la Sociedad Botánica de México 84:1-12. [ Links ]
Rzedowski, J. 1978. Vegetación de México. Editorial Limusa, México, D.F., México. 432 p. [ Links ]
Saavedra-Romero, L., D. Alvarado-Rosales., J. Vargas Hernández y T. Hernández-Tejeda. 2003. Análisis de la precipitación pluvial en bosques de Abies religiosa (HBK.) Schlecht. et Cham., en el sur de la ciudad de México. Agrociencia serie Recursos Naturales Renovables 1:57-64. [ Links ]
Statistical Package for the Social Sciences (SPSS). 2012. Data analysis software packages. Version 21 for Windows. SPSS Inc. Chicago, IL USA. n/p. [ Links ]
Stohlgren T., J. 1988. Litter dynamics in two Sierran mixed conifer forests. I. Litterfall and decomposition rates. Canadian Journal of Forest Research 18:1127-1135. [ Links ]
Vasconcelos H., L. and W. F. Laurance. 2005. Influence of habitat, litter type, and soil invertebrates on leaf-litter decomposition in a fragmented Amazonian landscape. Oecologia 144:456-462. [ Links ]
Villavicencio-Enríquez, L. 2012. Producción, pérdida de peso y tasas de descomposición de hojarasca en cafetales tradicional y rústico, y selva mediana, en Veracruz, México. Revista Chapingo Serie Ciencias Forestales y del Ambiente 18(2):159-173. [ Links ]
Xuluc-Tolosa, F. J., H. F. Vester M., N. Ramírez-Marcial, J. Castellanos-Albores and D. Lawrence. 2003. Leaf litter decomposition of tree species in three successional phases of tropical dry secondary forest in Campeche, Mexico. Forest Ecology and Management 174(1):401-412. [ Links ]
Yang Y., S., J. S. Xie, Y. X. Chen and Z. M. He. 2001. Amount, composition and seasonal dynamics of litter fall in mixed forest of Cunninghamia lanceolata and Tsoongi dendronodorum. Scientia Silvae Sinicae 37:30-34. [ Links ]
Zapata D., C. M., J. A. Ramírez, J. D. León P. y M. I. González H. 2007. Producción de hojarasca fina en bosques alto andino de Antioquia, Colombia. Revista Facultad Nacional de Agronomía-Medellín 60(1):3771-3784. [ Links ]
Zhang D., D. Hui, Y. Luo and G. Zhou. 2008. Rates of litter decomposition in terrestrial ecosystems: global patterns and controlling factors. Journal of Plant Ecology 1:85-93. [ Links ]
Received: March 16, 2018; Accepted: September 28, 2018
 Este es un artículo publicado en acceso abierto bajo una licencia Creative Commons
