


Serviços Personalizados
Journal
Artigo
 texto em
  Inglês (pdf)
 Artigo em XML
 Referências do artigo
 Enviar este artigo por email
Indicadores
-
 Citado por SciELO
 -
 Acessos
Links relacionados
-
 Similares em
SciELO
Similares em
SciELO
Compartilhar

 Permalink
Revista mexicana de ciencias forestales
versão impressa ISSN 2007-1132
Rev. mex. de cienc. forestales vol.9 no.50 México Nov./Dez. 2018
https://doi.org/10.29298/rmcf.v9i50.263
Articles
Assessment of the conservation status of the watersheds of Nuevo León, Mexico
1Facultad de Ciencias Forestales de la Universidad Autónoma de Nuevo León. México.
2Fundación para el Desarrollo de la Cordillera Volcánica Central (Fundecor), Costa Rica e Instituto Internacional para la Conservación y Manejo de la Vida Silvestre (Icomvis), Universidad Nacional, Heredia. Costa Rica.
In order to evaluate the conservation status of the watersheds of Nuevo León, 48 environmental variables were analyzed to construct four indexes. Four of the fourteen watersheds in Nuevo León cover 79 % of the state territory. Most prominent among them is the Río Bravo-San Juan basin, which houses within it Monterrey’s Metropolitan Area, where over 90 % of the inhabitants of the state dwell. In contrast, six basins of Nuevo León cover a total of 2 492 km2 (3.9 % of state territory), and therefore they can be considered marginal. The six marginal watersheds of Nuevo León, in addition to Río Soto La Marina, obtained the lowest scores for the Index of Sites with Official Declaration (; 2.4 points). The three basins with the highest scores for the Index of Proposed Priority Sites are among the marginal basins: Sierra de Rodríguez, Río Tamesí and Matehuala, with values of 45.3, 39.1, and 36.8 points, respectively. The Río Bravo- San Juan and Río San Fernando basins registered the highest values for the Environmental Impact Index, with 60.7 and 40.5 points, respectively. For the Conservation Status Index, five of the 14 basins showed positive values (Río Tamesí, Sierra Madre Oriental, Matehuala, Sierra de Rodríguez and Presa San José-Los Pilares), four of which are marginal, covering a joint surface area that amounts to only 2.3 % of the state. The fifth with positive value for this index was the Sierra Madre Oriental basin, while the nine remaining basins (Río Bravo-Matamoros-Reynosa, Río Bravo-San Juan, Río Bravo-Sosa, Presa Falcón-Río Salado, Río Bravo-Nuevo Laredo, Río Soto La Marina, Laguna Madre, Río San Fernando and Sierra Madre Oriental) obtained negative values for this index, which means that the environmental impacts exceed the conservation attributes of these watersheds.
Key words: Protected area; conservation; watersheds; water; environmental impact; environmental services
Se evaluó la condición de conservación de las cuencas hidrográficas de Nuevo León, mediante el análisis de 48 variables ambientales para construir cuatro índices. Cuatro de las 14 cuencas del estado cubren 79 % del territorio estatal, destacan la cuenca Río Bravo - San Juan por albergar al Área Metropolitana de Monterrey que concentra más de 90 % de la población estatal. En contraste, seis cuencas comprenden 2 492 km2 (3.9 % del territorio total), por lo que se consideran marginales. Estas y la cuenca Río Soto La Marina obtuvieron las puntaciones más bajas para el Índice de Sitios con Declaratoria Oficial ( 2.4 puntos). Las tres cuencas con los mayores valores para el índice de Sitios Prioritarios Propuestos corresponden al grupo de cuencas marginales: Sierra de Rodríguez, Río Tamesí y Matehuala con valores de 45.3, 39.1 y 36.8 puntos, respectivamente. Río Bravo - San Juan y Río San Fernando tuvieron los registros más altos para el Índice de Impacto Ambiental, con 60.7 y 40.5 puntos, respectivamente. El Índice del Grado de Conservación, fue positivo para cinco de las 14 cuencas: Río Tamesí, Sierra Madre Oriental, Matehuala, Sierra de Rodríguez y Presa San José - Los Pilares, cuatro de las cuales son marginales; sin embargo, su extensión conjunta representa solo 2.3 % del estado. La quinta cuenca con valor positivo para este índice fue la Sierra Madre Oriental. Las nueve cuencas presentaron valores negativos para este índice, lo que significa que los impactos ambientales superan a sus atributos de conservación.
Palabras clave: Áreas naturales protegidas; conservación; cuencas hidrográficas; impacto ambiental; recurso hídrico; servicios ambientales
Introduction
The water supply required to meet the human needs in the cities is one of the highest social priorities. Today, there is a global tendency to concentrate the population in the cities. 58 % of the world population lives in cities; the percentage of urban population in Mexico is 78 %. The state of Nuevo León is an extreme case, as 95 % of its population is concentrated in urban areas (Inegi, 2017; World Bank, 2017).
The average national yearly precipitation is 760 mm; this determines a mean availability of 447 260 Hm3 of fresh water per year; however, the population growth has significantly reduced the availability of water; between 1950 and 2012, the mean availability per inhabitant at a national level decreased by 453 %, dropping from 18 035 to 3 982 m3 inhabitant-1year-1 (Bezaury-Creel et al., 2017). There are a total of 320 watersheds in the country, with a wide variety of sizes (Conagua, 2016). Nuevo León comprises fourteen watershades in four hydrological regions -RH24 Bravo-Conchos, RH25 San Fernando-Soto La Marina, RH26 Pánuco, and RH37 El Salado-, which jointly cover a total surface area of 234 442 km2, i.e. 3.7 times the territory of the state, and encompass Coahuila, Tamaulipas, San Luis Potosí, Zacatecas and Veracruz (Conagua, 2016). 68 % of the state has a dry and semi-dry climate; the mean yearly precipitation is 650 mm, and therefore two thirds of its surface area are covered by xerophilous vegetation (Inegi, 2017).
Nuevo León has 5 119 504 inhabitants, concentrated mainly in the Metropolitan Area of Monterrey (MAM), whose urban sprawl amounts to 1.5 % of the total surface area of the state, where 88 % of its inhabitants dwell (Inegi, 2017); furthermore, it is the state of the republic with the greatest migration from rural to urban locations (Moreno, 2005). An increase of 1 457 783 inhabitants, of whom 85 % (1 246 914) will live in the 12 municipalities included in the MAM, has been projected for the year 2030 (Conapo, 2017).
One of the main challenges faced by the MAM is the water supply for the population, and therefore the conditions of conservation of its watersheds must be analyzed in order to design the strategies and implement the necessary actions to meet the demand of water for its growing population. Based on this, the objective of the present study was to perform a diagnose of the conditions of conservation of the 14 watersheds of Nuevo León in terms of environmental impact, by means of environmental variables, in order to build indexes that may allow their prioritization according to their conservation status.
Materials and Methods
A geographical information system (GIS) has been built based on digital maps provided by various institutions, primarily by the Comisión Nacional para el Conocimiento y Uso de la Biodiversidad National (Conabio) (Commission for the Knowledge and Use of the Biodiversity), the Instituto Nacional de Geografía y Estadística (Inegi) (National Institute of Geography and Statistics), the Comisión Nacional Forestal (Conafor) (National Forest Commission) and the Secretaría de Medio Ambiente y Recursos Naturales (Semarnat) (Department of the Environment and Natural Resources). All the digital covers were combined and analyzed with the ArcGisTM software, version 10.4, and with vectorial maps using Lambert’s conformal conic projection and the datum WGS 84.
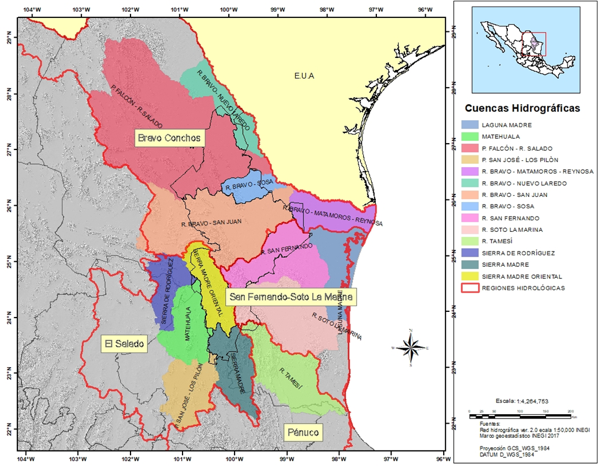
The state of Nuevo León exhibits great contrasts in terms of climate, orography and geology; fourteen watersheds are located in its territory, within four hydrological regions, covering a total surface area of 234 442 km2, i.e. 3.7 times the territory of the state; they also comprise the states of Coahuila, Tamaulipas, San Luis Potosí, Zacatecas and Veracruz (Figure 1, Table 1).
Cuencas hidrográficas = Watersheds
Figure 1 The hydrological Regions and watersheds of the state of Nuevo León extend their total surface area into the neighboring states.
Table 1 Watersheds of Nuevo León and their surface area in relation to the territory that they occupy regionally (outside the political boundaries of the states).
| Code of the hydro-logical region | Hydrological region | Number of the water-shed | Code of the watershed | Name of the watershed | Surface area in the region (ha) | Surface area in N.L. (ha) | Proportion of the watershed within N.L. (%) |
|---|---|---|---|---|---|---|---|
| RH24 | Bravo-Conchos | 1 | RH24A | Río Bravo - Matamoros - Reynosa | 941 098 | 100 160 | 10.6 |
| 2 | RH24B | Río Bravo - San Juan | 3 263 017 | 1 967347 | 60.3 | ||
| 3 | RH24C | Río Bravo - Sosa | 488 900 | 374743 | 76.7 | ||
| 4 | RH24D | Presa Falcón - R. Salado | 6 051 915 | 1 328504 | 22.0 | ||
| 5 | RH24E | Río Bravo - Nuevo Laredo | 945 606 | 156 379 | 16.5 | ||
| RH25 | San Fernando | 6 | RH25B | Río Soto La Marina | 2 095779 | 255413 | 12.2 |
| 7 | RH25C | Laguna Madre | 1 211 623 | 2 975 | 0.2 | ||
| 8 | RH25D | Río San Fernando | 1 681976 | 883 887 | 52.6 | ||
| RH26 | Pánuco | 9 | RH26B | Río Tamesí | 1 678 514 | 46 977 | 2.8 |
| RH37 | El Salado | 10 | RH37A | Sierra Madre Oriental | 973156 | 860138 | 88.4 |
| 11 | RH37B | Matehuala | 1 075291 | 60 485 | 5.6 | ||
| 12 | RH37C | Sierra de Rodríguez | 788 286 | 12 341 | 1.6 | ||
| 13 | RH37G | Presa San José - Los Pilares and others | 1 128528 | 26 210 | 2.3 | ||
| 14 | RH37H | Sierra Madre | 1 120 477 | 280 327 | 25.0 | ||
| Total | 23444166 | 6 355886 | 27.1 | ||||
Three indexes were generated in order to determine the conservation status of the watersheds: the Index of Sites with Official Declaration, the Index of Proposed Priority Sites, and the Environmental Impact Index. Once the value of the indexes was normalized, the differential of the average value of the sum of the indexes of the Sites with Official Declaration and the Proposed Priority Sites, minus the value of the Environmental Impact Index, was used to calculate the Conservation Status Index, which summarizes the relative condition of the watersheds.
Nine variables were used for estimating the Index of Sites with Official Declaration. This refers to those political instruments of conservation that manage their natural resources under an official decree which confers them national and international recognition for the conservation of the water resource (Bezaury-Creel et al., 2012; Semarnat, 2013; Conabio, 2015) (Table 2).
Table 2 Values of the variables considered for the construction of the Index of Sites with Official Declarations of the Nuevo León watersheds.
| Name of the watershed | 1 | 2 | 3 | 4 | 5 | 6 | 7 | 8 | 9 |
|---|---|---|---|---|---|---|---|---|---|
| Río Bravo-Matamoros-Reynosa | 0 | 0 | 0 | 0 | 2 | 2.2 | 0 | 0 | 0 |
| Río Bravo-San Juan | 16 | 18.3 | 0 | 0 | 80 | 3.9 | 0.3 | 18 | 5.5 |
| Río Bravo-Sosa | 2 | 13.7 | 0 | 0 | 42 | 8.4 | 0 | 13.7 | 0 |
| Presa Falcón-R. Salado | 0 | 0 | 0 | 0 | 199 | 24.5 | 0 | 0 | 0 |
| Río Bravo-Nuevo Laredo | 0 | 0 | 0 | 0 | 58 | 55.1 | 0 | 0 | 0 |
| Río Soto La Marina | 1 | 0 | 0 | 0 | 0 | 0 | 0 | 0.03 | 0 |
| Laguna Madre | 0 | 0 | 0 | 0 | 2 | 10.4 | 0 | 0 | 0 |
| Río San Fernando | 7 | 0.8 | 1 | 0.1 | 75 | 10.6 | 0 | 0.8 | 0.05 |
| Río Tamesí | 1 | 0 | 0 | 0 | 0 | 0 | 0 | 0.05 | 0 |
| Sierra Madre Oriental | 12 | 2.6 | 0 | 0 | 2 | 0.4 | 0 | 2.6 | 0.1 |
| Matehuala | 0 | 0 | 0 | 0 | 1 | 5.7 | 0 | 0 | 0 |
| Sierra de Rodríguez | 0 | 0 | 0 | 0 | 0 | 0 | 0 | 0 | 0 |
| San José-Los Pilares and others | 0 | 0 | 0 | 0 | 0 | 0 | 0 | 0 | 0 |
| Sierra Madre | 2 | 1.1 | 0 | 0 | 0 | 0 | 0 | 1.1 | 0 |
1 = Number of PNAs; 2 = Proportion of PNAs (%); 3 = Number of RAMSAR sites; 4 = Proportion of RAMSAR sites (%); 5 = Number of EMUs; 6 = Proportion of EMUs (%); 7 = Proportion of PNAs with a current management plan (< 5 years) (%); 8 = Proportion of PNAs with no current management plan (> 5 years) (%); 9 = Proportion of PNAs with no management plan (%). PNA = Natural Protected Area; RAMSAR = Internationally important wetlands; EMU = Environment Management Unit.
The Index of Proposed Priority Sites includes 16 variables and considers sites with extraordinary ecological characteristic, which, however, are not recognized as official political instruments of conservation (Arriaga et al., 2000; Conabio, 2002; Conabio-Conanp-TNC-Pronatura, 2007; Conabio-Conanp, 2010; Conabio, 2014; Cipamex-Conabio, 2015; Conabio, 2016; Conabio, 2016a) (Table 3).
Table 3 Values of the variables considered for the construction of the Index of Proposed Priority Sites of the Nuevo León watershed.
| Name of the watershed | 1 | 2 | 3 | 4 | 5 | 6 | 7 | 8 | 9 | 10 | 11 | 12 | 13 | 14 | 15 | 16 |
|---|---|---|---|---|---|---|---|---|---|---|---|---|---|---|---|---|
| Río Bravo-Matamoros-Reynosa | 0 | 0 | 0 | 0 | 5.0 | 0 | 26.8 | 0 | 0 | 0 | 0 | 0.2 | 0.63 | 1.1 | 0 | 0 |
| Río Bravo-San Juan | 2 | 53.1 | 8.5 | 6.0 | 10.9 | 6.1 | 19.4 | 1.9 | 7.5 | 0.5 | 19.1 | 4.32 | 11.56 | 7.5 | 3 | 15.9 |
| Río Bravo -Sosa | 2 | 93.1 | 0 | 0 | 3.8 | 5.6 | 15.5 | 0.0 | 7.9 | 0 | 17.0 | 3.13 | 18.94 | 3.0 | 1 | 20.1 |
| Presa Falcón-R. Salado | 2 | 0.1 | 0 | 0 | 3.0 | 3.2 | 12.2 | 1.9 | 7.4 | 0 | 5.4 | 1.61 | 8.73 | 10.2 | 0 | 0 |
| Río Bravo -Nuevo Laredo | 1 | 13.1 | 0 | 0 | 1.7 | 0.8 | 32.5 | 0 | 22.6 | 0 | 85.9 | 3.1 | 3.51 | 2.1 | 0 | 0 |
| Río Soto La Marina | 1 | 1.7 | 57.4 | 8.8 | 2.1 | 1.3 | 20.5 | 3.7 | 11.7 | 0 | 7.4 | 10.4 | 31.87 | 8.0 | 1 | 22.5 |
| Laguna Madre | 0 | 0 | 0 | 0 | 0.0 | 0 | 85.4 | 0.0 | 0 | 0 | 0 | 0.0 | 0.00 | 14.4 | 0 | 0 |
| Río San Fernando | 1 | 0.1 | 15.5 | 8.0 | 4.2 | 2.5 | 28.8 | 16.8 | 10.8 | 0.4 | 5.6 | 6.55 | 7.78 | 4.5 | 3 | 5.9 |
| Río Tamesí | 1 | 91.0 | 98 | 2.2 | 7.0 | 13.5 | 4.9 | 2.4 | 0.3 | 0 | 28.7 | 6.0 | 22.73 | 10.7 | 1 | 61.3 |
| Sierra Madre Oriental | 2 | 3.1 | 2.9 | 23.9 | 4.1 | 1.7 | 10.1 | 25.3 | 0.1 | 0 | 54.2 | 14.72 | 15.50 | 12.9 | 4 | 30.1 |
| Matehuala | 0 | 0 | 0.8 | 58.1 | 38.6 | 22.8 | 17.9 | 10.6 | 5.0 | 0 | 64.5 | 56.4 | 7.22 | 3.5 | 1 | 58.7 |
| Sierra de Rodríguez | 0 | 0 | 5 | 95.1 | 30.7 | 15.7 | 4.8 | 68.1 | 0 | 0 | 100 | 90.6 | 7.31 | 1.3 | 1 | 100 |
| Presa San José-Los Pilares and others | 0 | 0 | 0 | 0 | 0 | 7.3 | 58.8 | 26.1 | 0 | 0 | 56.1 | 23.0 | 39.99 | 18.5 | 0 | 0 |
| Sierra Madre | 0 | 0 | 1.7 | 0 | 0.5 | 9.8 | 24.8 | 17.0 | 10.2 | 0 | 43.4 | 17.9 | 15.63 | 8.9 | 1 | 4.2 |
1 = Number of PHRs; 2 = Proportion of PHRs (%); 3 = Proportion for environmental water services (%); 4 = Proportion for the conservation of the biodiversity (%); 5 = Proportion with extreme priority hexagons (%); 6 = Proportion with high priority hexagons (%); 7 = Proportion with medium priority hexagons (%);8 = Proportion with high priority terrestrial hexagons (%); 9 = Proportion with medium priority terrestrial hexagons (%); 10 = Proportion with extreme priority terrestrial hexagons (%); 11 = Proportion of TPRs (%); 12 = Sites with extreme priority attention for conservation (%); 13 = Sites with high priority attention for conservation (%); 14 = Sites with medium priority attention for conservation (%); 15 = Number of AICBs; 16 = Proportion of AICBs (%). PHR = Priority Hydrological Region; AICBs = Areas of Importance for the Conservation of Birds.
The Environmental Impact Index was constructed based on 23 variables related to environmental characteristics that have an impact on the water catchment and to human activities with negative effects on the watersheds (Pacheco et al., 2008; Pacheco et al., 2008a; Inegi, 2010; Castellarini et al., 2014; Conabio, 2014a; Conabio, 2014b; Conagua, 2016; Conagua, 2016a; Inegi, 2016; Conabio, 2017) (Table 4).
Table 4 Values of the variables considered for the construction of the Environmental Impact Index of the Nuevo León watersheds.
| Name of the watershed | 1 | 2 | 3 | 4 | 5 | 6 | 7 | 8 | 9 | 10 | 11 | 12 | 13 | 14 | 15 | 16 | 17 | 18 | 19 | 20 | 21 | 22 | 23 |
|---|---|---|---|---|---|---|---|---|---|---|---|---|---|---|---|---|---|---|---|---|---|---|---|
| Río Bravo -Matamoros-Reynosa | 194.7 | 0.0038 | 2 022.2 | 0 | 326 | 0 | 0 | -48 835 995 | -128.3 | 6.51 | 0 | 1.4 | 86.5 | 0 | 0 | 0 | 0 | 100 | 0 | 0 | 95 | 0 | 31.0 |
| Río Bravo -San Juan | 861.7 | 0.0122 | 4 894.7 | 4 263 942 | 120 886 | 4.8 | 1.1 | -285 762 827 | -61.6 | -151.68 | 0 | 1.8 | 45.3 | 0.07 | 5.2 | 9.1 | 7.4 | 46.1 | 19.0 | 13.1 | 6 743 | 24.0 | 17.9 |
| Río Bravo -Sosa | 788.3 | 0.0103 | 4 718.6 | 10 971 | 3 715 | 0.4 | 0.2 | -253 359 961 | -218.6 | 9.19 | 0 | 1.2 | 36.0 | 0.05 | 0 | 0 | 46.7 | 53.3 | 0 | 0 | 512 | 0 | 17.6 |
| Presa Falcón-R. Salado | 788.3 | 0.0103 | 4 718.6 | 61 896 | 5 005 | 0.4 | 0.1 | -253 546 300 | -307.7 | 23.67 | 0.5 | 5.2 | 48.2 | 0.03 | 2.2 | 22.8 | 74.4 | 0.6 | 0 | 0 | 670 | 0 | 15.1 |
| Río Bravo-Nuevo Laredo | 788.3 | 0.0103 | 4 718.6 | 0 | 620 | 0.0 | 0.3 | -253 359 961 | -503.4 | 9.48 | 0 | 2.2 | 36.9 | 0 | 0 | 0 | 99.8 | 0 | 0 | 0 | 80 | 0 | 18.7 |
| Río Soto La Marina | 192.9 | 0.0070 | 904.5 | 7 302 | 9 846 | 0.3 | 0.3 | -51 367 785 | 19.5 | 1.69 | 0 | 0.1 | 14.2 | 0 | 0 | 0 | 0.9 | 35.6 | 61.0 | 2.6 | 263 | 96.7 | 0.8 |
| Laguna Madre | 9.8 | 0.0015 | 115.6 | 0 | 0 | 0 | 0 | -18 716 094 | 142.9 | 0.03 | 0 | 100 | 0 | 0 | 0 | 0 | 0 | 100 | 0 | 0 | 2 | 0 | 26.0 |
| Río San Fernando | 903.0 | 0.0134 | 5 324.0 | 77 711 | 28 117 | 0.3 | 0.3 | -309 679 454 | 25.2 | -32.95 | 0 | 2.8 | 55.1 | 0 | 0 | 6.9 | 5.1 | 40.5 | 22.2 | 25.4 | 1 367 | 11.4 | 23.4 |
| Río Tamesí | 156.0 | 0.0060 | 581.6 | 0 | 1 092 | 0 | 0.1 | -36 446 406 | 28.9 | 0.72 | 0 | 0 | 20.1 | 0 | 0 | 0 | 0 | 0 | 100 | 0 | 64 | 100 | -0.8 |
| Sierra Madre Oriental | 70.0 | 0.0006 | 311.3 | 0 | 38 423 | 0 | 0.5 | -34 446 406 | 32.0 | -35.66 | 0.3 | 0 | 55.1 | 0 | 0 | 58.8 | 21.1 | 20.0 | 0.1 | 0 | 332 | 67.4 | 6.1 |
| Matehuala | 18.8 | 0.0003 | 173.7 | 0 | 1 417 | 0 | 0.6 | -16 238 775 | 79.9 | 5.49 | 0 | 0 | 59.0 | 0 | 0 | 65.8 | 29.2 | 4.9 | 0 | 0 | 7 | 59.8 | 2.5 |
| Sierra de Rodríguez | 1.6 | 0.0001 | 94.1 | 0 | 0 | 0 | 0 | -6 102 150 | 65.9 | 0.49 | 0 | 0 | 61.5 | 0 | 0 | 100 | 0 | 0 | 0 | 0 | 1 | 100 | -2.9 |
| Presa San José-Los Pilares and others | 18.4 | 0.0003 | 175.5 | 0 | 1 229 | 0 | 0.4 | -10 646 243 | 90.5 | -1.00 | 0 | 0 | 43.7 | 0 | 0 | 100 | 0 | 0 | 0 | 0 | 5 | 0.2 | 2.1 |
| Sierra Madre | 22.7 | 0.0008 | 182.3 | 11 486 | 16 643 | 0.2 | 0.7 | -22 428 541 | 59.4 | 19.71 | 0 | 0 | 50.4 | 0 | 0 | 11.6 | 54.4 | 31.9 | 2.1 | 0 | 79 | 2.6 | 2.4 |
1 = Consumption of water for urban use (Hm3); 2 = Water consumption by livestock (Hm3); 3 = Water consumption by agriculture (Hm3); 4 = Number of urban inhabitants (Inegi, 2010); 5 = Number of rural inhabitants (Inegi, 2010); 6 = Proportion of basins with urban sprawls (%); 7 = Proportion of basins with rural sprawls (%); 8 = Water balance of total available water vs total water demand (Hm3); 9 = Average volume of available groundwater (2015) (Hm3); 10 = Proportional adjustment of the available groundwater in the N.L. fraction of the watershed (Hm3); 11 = Wind erosion ratio (%) (Inegi, 2013); 12 = Water erosion ratio (%) (Inegi, 2013); 13 = Laminar water ratio (%) (Inegi, 2013); 14 = Anthropic erosion rate (%) (Inegi, 2013); 15 = Actual evapotranspiration rate of 200-300 mm (%); 16 = Actual evapotranspiration rate of 300-400 mm (%); 17 = Actual evapotranspiration rate of 400-500 mm (%); 18 = Actual evapotranspiration rate of 500-600 mm (%); 19 = Actual evapotranspiration rate of 600-700 mm (%); 20 = Actual evapotranspiration rate of 700-800 mm (%); 21 = Forest fire heat points between January, 2000, and November, 2017; 22 = Proportion of the watershed with a ban (%); 23 = Increase of anthropic uses between Soil Use Series 5 and 1 (%).
The Conservation Status Index summarizes the relative condition, having been estimated, after the normalization of the values of the Index of Sites with Official Declaration, the Index of Proposed Priority Sites, and the Environmental Impact Index, minus the value of the Environmental Impact Index (tables 2, 3 and 4).
The suitability indexes of an area can be estimated according to the information of its basic life history, or when modifying the existing models. The Conservation Status index is defined as a numeric index representing the ability of a watershed to conserve biodiversity, based on the results of the three indexes mentioned above. An index, according to Inhabert’s definition (1976), is the ratio of a value of interest divided by a comparison standard. For the purposes of this assessment procedure, the value of interest is an estimation of the measure of the conservation status of the Nuevo León watersheds, and the comparison standard is the optimal condition of the habitat for the same assessment area.
The data of all the variables were normalized through the division of the values for each variable by its maximum value, so that all the data ranged between 0 and 1. The following formula was utilized:
Where:
Nv = Normalized value
Vvar= Value of each variable
MaxVvar = Maximum value of the variable
The values were then weighted based on the importance assigned to each variable by the experts who participated in the study, according to the following scale:
2 = Very Low
4 = Low
6 = Medium
8 = High
10 = Very High
The value of each normalized variable ranged between 0 and 1 and was multiplied by the assigned weighting value; thus, its final value ranged between 0 and 10. The following formula was used for the weighting:
Where:
Wv = Weighted value
Nv = Normalized value
Wk = Weighting constant assigned to the variable (between 0 and 10)
In order to adjust the value of the variables between 0 and 100, the normalized data were multiplied by the total number of the variables by the maximum weighting value to calculate each index. The weight of all the variables was estimated by dividing 100 by the result of the normalization, whereby a constant was obtained. This was multiplied by the weighted value of each watershed, yielding the respective index, according to the following formula:
Where:
II = Index of interest
WvV1 =Weighted value of variable 1
WvBV2 = Weighted value of variable 2
WvV3 = Weighted value of variable 3
WvVn = Weighted value of variable n
Ki= Constant of interest
Results and Discussion
Four of the fourteen watersheds of Nuevo León cover 79 % of the territory of the state: Río Bravo-San Juan, Presa Falcón-Río Salado, Río San Fernando and Sierra Madre Oriental. The Río Bravo-San Juan basin stands out for housing the MAM, which concentrates over 90 % of the total population of the state. In contrast, six watersheds covering a total of 2 492 km2 (3.9 % of the territory of the state) have only 4 064 inhabitants, i.e. 0.09 % of the total population (4 660 627 inhabitants). For this reason, Matehuala, Sierra de Rodríguez, Presa San José-Los Pilares, Río Tamesí, Laguna Madre and Río Bravo-Matamoros-Reynosa can be regarded as marginal. This means that most of the territory (90 %) of each is located in the neighboring states (Table 1; Figure 1).
Index of Sites with Official Declaration
The six marginal watersheds, plus that of Río Soto La Marina, obtained lower scores (; 2.4 points), which reflects the lack of political instruments for their conservation (Table 5; Figure 1).
Table 5 Values of the Index of Sites with Official Declaration, Index of Proposed Priority Sites, Index of Environmental Impact, and Conservation Status Index for the 14 watersheds of Nuevo León.
| Name of the watershed | Index of Sites with Official Declaration (0 to 100) | Index of Proposed Priority Sites (0 to 100) | Index of Environmental Impact (0 to 100) | Conservation Status Index (-50 to 50) |
|---|---|---|---|---|
| Presa Falcón - R. Salado | 13.7 | 14.5 | 37.1 | -33.5 |
| Río Bravo - Matamoros - Reynosa | 0.6 | 3.1 | 18.9 | -27.2 |
| Laguna Madre | 2.6 | 9.3 | 19.7 | -19.9 |
| Río Bravo - Nuevo Laredo | 15.5 | 16.8 | 28.2 | -14.9 |
| Río Bravo - San Juan | 59.4 | 35.5 | 60.7 | -10.8 |
| Río San Fernando | 34.9 | 24.7 | 40.5 | -10.1 |
| Sierra Madre | 2.8 | 16.5 | 17.0 | -7.4 |
| Río Soto La Marina | 0.7 | 23.1 | 18.9 | -5.0 |
| Río Bravo - Sosa | 22.8 | 27.2 | 32.1 | -3.7 |
| Presa San José - Los Pilares and others | 0 | 21.8 | 9.4 | 8.5 |
| Sierra Madre Oriental | 11.6 | 27.9 | 18.0 | 11.0 |
| Río Tamesí | 0.7 | 39.1 | 16.6 | 16.5 |
| Matehuala | 1.4 | 36.8 | 15.3 | 16.6 |
| Sierra de Rodríguez | 0 | 45.3 | 12.0 | 30.3 |
The order in which the watersheds are listed is dictated by the rising values of the Conservation Status Index.
The Río Bravo-San Juan watershed exhibited the highest value, with 59.4 points, followed by the Río San Fernando and Río Bravo-Sosa watersheds, with 34.9 and 22.8 points, respectively (Figure 2; tables 1 and 5).
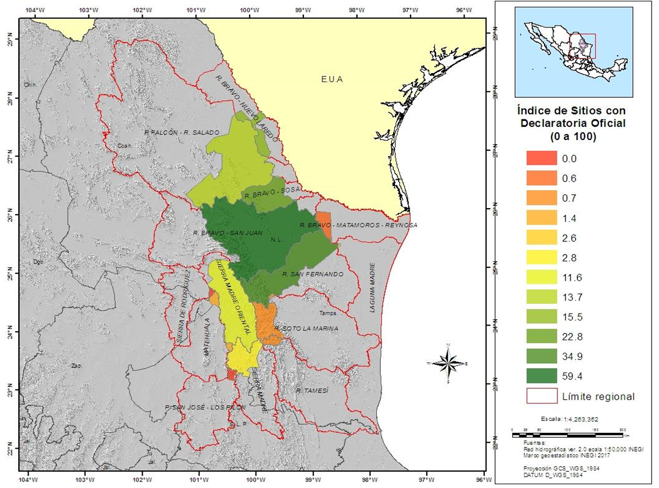
Índice de Sitios con Declaratoria Oficial = Index of Sites with Official Declaration
Figure 2 Index of Sites with Official Declaration of the watersheds of the state of Nuevo León.
The Río Bravo-San Juan watershed includes 16 natural protected areas (NPAs) covering 18.3 % of the surface area of the state, followed by that of Río Bravo-Sosa, with 13.7 % of its surface area, which encompasses two PNAs and, in the third place, the Sierra Madre Oriental watershed, with 2.6 % and 12 PNAs; the Río San Fernando watershed stands out with seven PNAs, but occupies a mere 0.8 % of the territory of the state (Table 2).
The role of those areas that are protected as water reservoirs is well known. One third of the 105 most populated cities in the world protect their forests because they are the source of the water supply for their inhabitants (Dudley and Solton, 2003; UNEP-WCMC and IUCN, 2016).
There are four RAMSAR sites in the northeastern region of Mexico -two in Coahuila, one in Tamaulipas and one in Nuevo León: Baño de San Ignacio, with a surface area of 557 ha, located within the Río San Fernando watershed, and covering only 0.06 % of this watershed in Nuevo León (Table 2).
The state comprises 461 environmental management units (EMUs), which cover 9.8 % of its territory; the Río Bravo-Nuevo Laredo basin covers the largest proportion of the state’s surface area (55.1 %) and includes a total of 58 of these conservation and management units (EMUs). Next is Presa Falcón-Río Salado, with 24.5 % of the surface area of the state and 199 EMUs. The third place corresponds to Río San Fernando, with 10.6 % of the surface area of the state and 75 EMUs (Table 2).
Of the 34 PNAs, only two have current management plans. The Río Bravo-San Juan basin has 16 PNAs on a surface area of 360 678 ha, which amounts to 18 % of the state’s territory; this renders it the basin with the largest number and expanse of PNAs in the state. However, only the Cerro de la Silla Natural Monument (6 039 ha) has a current management program. The Río Bravo-Sosa watershed, with two PNAs (without current management programs), covering a surface area of 51 378 ha (13.7 % of the state’s territory) occupies the second place in the state. It is followed by the Sierra Madre Oriental basin, which has 12 PNAs (with obsolete management plans) and a surface area of 22 419 ha, i.e. 2.6 % of the territory. The Río San Fernando watershed has seven PNAs, on 6 911 ha, which amount to less than 1 % of the surface area of the state (Table 2).
The Cumbres de Monterrey National Park belongs to the Río Bravo-San Juan basin and is a particularly important source of water for the MAM, since almost 10 % of the 11 m3 seg-1 demanded by the city -equivalent to 251 liters per person- are produced only in the locality of La Huasteca (Cantú et al., 2010).
The state of Nuevo León has a huge deficit of conservation areas. Its 34 PNAs cover 7 % of its territory. Today, 14.7 % of the total continental surface area -but only 9.9 % of the surface area of Mexico- is protected (Bezaury-Creel et al., 2012; UNEP-WCMC and IUCN, 2016). In the tenth meeting of the Conference of the Parties to the Convention on Biological Diversity, in 2010, a revised and updated Strategic Plan was adopted for the 2011-2020 Convention on Biological Diversity, with five objectives and 20 Aichi goals for biodiversity. One of these goals is to conserve at least 17 % of the terrestrial areas through an effective and equitable ecologically representative management and protected areas systems, as well as other effective area-based conservation actions integrated into the landscape and into the broader seascape (UNEP-WCMC and IUCN, 2016).
In the case of Nuevo León, more than 635 000 ha would have to be declared new PNAs, in the next few years, in order to meet the Aichi goal. It is unlikely that this will happen, given that, in the last decade, actions geared toward the protection of the biodiversity have been avoided, as neither financial resources nor specialized technical personnel or sufficient infrastructure and equipment have been allotted to ensure the protection of the natural heritage.
Index of Proposed Priority Sites
The three watersheds with the highest values correspond to the group of marginal basins of Nuevo León: Sierra de Rodríguez (45.3), Río Tamesí (39.1) and Matehuala (36.8) (Table 4; Figure 3). This means that they are located in high biodiversity sites and that they currently lack political instruments for their conservation (PNAs, EMUs, etc.). A large part of their territory is located in the states of San Luis Potosí, Zacatecas and Tamaulipas. As for the main watersheds of Nuevo León, the one with the highest score was that of Río Bravo-San Juan (35.5), followed by that of the Sierra Madre Oriental (27.9) and that of Río Bravo-Sosa (27.2) (Figure 3; Table 4).
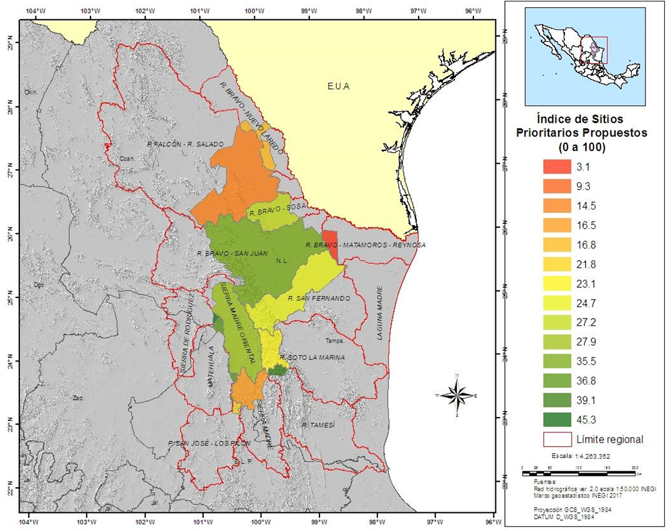
Índice de Sitios Prioritarios Propuestos = Index of Proposed Priority Sites
Figure 3 Index of Proposed Priority Sites of the watersheds of Nuevo León.
Four Priority Hydrological Regions (PHR) exist in the state, which together cover 1 490 317 ha -i.e. 23 % of the total surface area. Most prominent among them is the Río Bravo-San Juan watershed, with 1 045 031 ha in two PHR (Cumbres de Monterrey National Park, and Río San Juan and Río Pesquería), which cover 53 % of their surface area (Conabio, 2002) (Figure 3, Table 3).
As for the eligible areas for the conservation of the biodiversity of Nuevo León, Conabio proposed 464 338 ha, of which 84.7 % are located within three watersheds: the Sierra Madre Oriental, Río Bravo-San Juan and Río San Fernando, plus 526 451 ha, by federal initiative, for the protection of the water services; the three watersheds together -Río Bravo-San Juan, Río Soto La Marina and Río San Fernando- cover 85 % of this surface area (Conabio, 2014a) (Figure 3; Table 3).
A total of 1 835 942 ha, i.e. 29 % of the territory of Nuevo León, consist of epicontinental aquatic hexagons, proposed by Conabio-Conanp (2010) for prioritizing the fresh water bodies of Mexico. Most prominent is the Río Bravo-San Juan basin, with 213 656 ha of extreme priority hexagons, amounting to 55.5 % of the total surface of these hexagons in Nuevo León (Figure 3; Table 3).
The priority terrestrial hexagons are the result of another exercise carried out by experts, organized by Conabio (2007) for prioritizing the terrestrial ecosystems with conservation purposes. In Nuevo León, these hexagons comprise a total of 991 332 ha, which amount to 15.6 % of the state’s territory. Notably, three watersheds -Río Bravo-San Juan, Presa Falcón-Río Bravo and Río San Fernando- concentrate 57 % of this priority surface area (Figure 3; Table 3).
Nuevo León includes 26 terrestrial priority regions (TPR) covering 21 % (1 381 491 ha) of its surface area. The Río Bravo-San Juan and Sierra Madre Oriental basins concentrate most (61 %) of the TPRs (Arriaga et al., 2000) (Figure 3; Table 3).
Priority attention sites for conservation were created by Conabio (2016) through the establishment of categories of extreme, high and medium priority. Such sites occupy 1 721 010 ha (27 % of the surface area of Nuevo León); most prominent are those of the Río Bravo-San Juan and Sierra Madre Oriental basins, with a total of 831 096 ha (Figure 3; Table 3).
Six of the 230 areas of importance for the conservation of birds (AICBs) of Mexico are located in Nuevo León, on a surface area of 844 905 ha, of which 67 % are within the Río Bravo-San Juan and Sierra Madre Oriental basins (Cipamex-Conabio, 2015) (Figure 3; Table 3).
Environmental Impact Index
The two watersheds with the highest values for environmental impact were Río Bravo-San Juan and Río San Fernando, with 60.7 and 40.5 points, respectively (Table 5; Figure 4). Notably, the Presa Falcón-Río Salado and Sierra Madre Oriental basins, which amount to 34 % of the territory of Nuevo León, had relatively low environmental impact indexes, of 37.1 and 18 points, respectively; therefore, decision makers must regard them as priority in order to intensify their exploitation as sources of water, based on the premise of their conservation (Figure 4; Table 4).
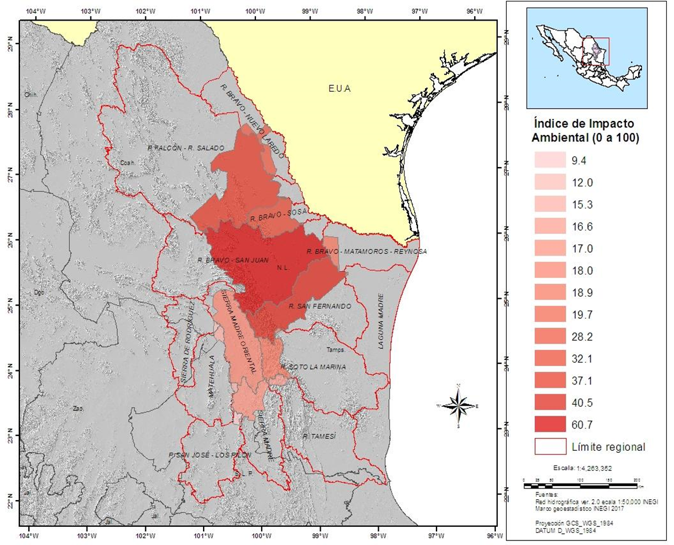
Índice de Impacto Ambiental = Index of Environmental Impact
Figure 4 Index of Environmental Impact of the Nuevo León watersheds.
The Nuevo León watersheds recorded a deficit of -1 601 065 856 Hm3 of water, an equivalent amount to that which the MAM would consume in 3.9 years, at a rate of 13 m3second-1, which is the current consumption rate of the city (Conagua, 2016). The Río San Fernando basin has the highest negative value, of -309 679 454 Hm3, followed by the Río Bravo-San Juan basin, with -285 762 827 Hm3 (Conagua, 2016a). The balance between the availability and the consumption of water in the 14 watersheds yields negative figures (Table 4).
The Río Bravo-San Juan basin houses the MAM, with 223 inhabitants km-2, a much higher figure than that of the second most densely populated basin in the state, San Fernando, with 12 inhabitants km-2, while the national mean is 61 inhabitants km-2 (Inegi, 2017). 89.6 % of the state’s inhabitants have access to drinking water service. However, there is a marked contrast between the population that inhabits the Río Bravo-San Juan basin, with a 97.8 % coverage of this service, in relation to the inhabitants of the Sierra Madre basin, where the coverage is only 75.8 % (Conagua, 2016) (Table 4). The Río San Juan aquatic ecoregion, which corresponds to the eponymous basin, was the only one in the state that has been rated as highest priority for conservation in all of North America, by Abell et al. (2000).
By 2010 there were 4 653 458 inhabitants in Nuevo León (Inegi, 2010), 4.9 % of whom live in 5 185 rural localities (Inegi, 2010). Most of the rural population, which consist of 120 886 inhabitants (53 %), is concentrated in Río Bravo-San Juan. However, this basin also registers the highest number of urban inhabitants. At a global level, cities occupy 3 % of the surface area of the continent. In Nuevo León, urban sprawls cover 104 183 ha, which amount to a mere 1.6 % of the state’s territory (Inegi, 2016); this implies an excessive concentration and centralization of human activities in the state (Table 4).
It has been estimated that one third of the 100 largest cities in the world obtain a considerable proportion of their drinking water from protected forest areas (UNEP-WCMC and IUCN, 2016). In Mexico, every year the PNAs contribute almost 3.4 billion dollars’ worth of environmental services; i.e. for every US dollar of federal public expense allocated to the PNAs, 52 US dollars are recovered in environmental services. Out of these 3.4 billion dollars spent in environmental services, 135.6 million dollars (4 %) correspond to the supply of water for human consumption (Bezaury-Creel, 2009).
Conservation Status Index
Five watersheds registered positive values for the Conservation Status Index: Sierra de Rodríguez, Matehuala, Río Tamesí, Sierra Madre Oriental and Presa San José-Los Pilares. All these, with the exception of Sierra Madre Oriental, cover only a small surface area in Nuevo León, and are therefore regarded as marginal. This means that their conservation attributes are above the environmental impact values. Conversely, negative values for the Conservation Status Index were observed in nine watersheds; which implies that their environmental impacts are greater than their conservation attributes (Table 5, Figure 5).
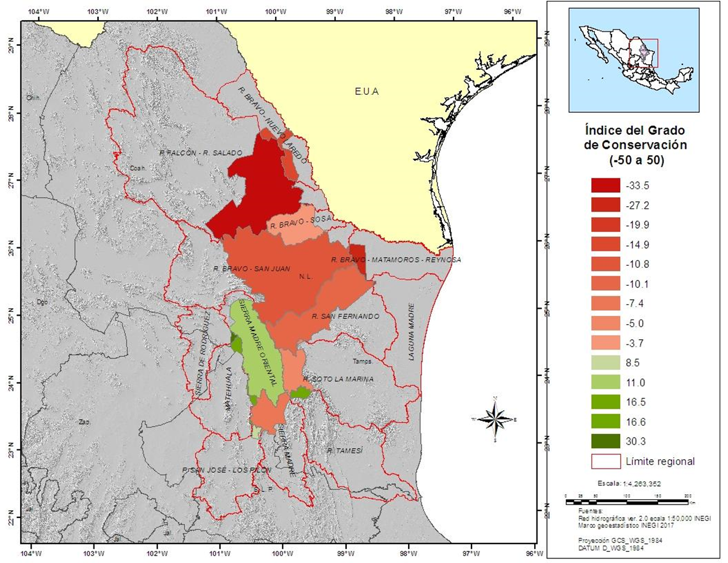
Índice de Grado de Conservación = Conservation Status Index
Figure 5 Conservation Status Index of the watersheds of Nuevo León.
The nine remaining watersheds exhibited negative values; i.e. their environmental impacts are above the conservation attributes of sites under official decree (PNAs, EMUs, RAMSAR) and priority sites (TPRs, AICBs, priority hexagons, etc.). The first four watersheds with the highest negative values were: Presa Falcón-Río Salado, with -33.5 points, followed by the marginal watersheds: Río Bravo-Nuevo Laredo, Laguna Madre and Río Bravo-Matamoros-Reynosa, with -27.2, -19.9, and -14.9 points, respectively. The Río Bravo-San Juan and San Fernando basins -the main sources of water for the MAM- exhibited values of -10.8 and -10.1, respectively, which show their high environmental impacts. Although they have the largest number of legal instruments for conservation in Nuevo León, as indicated by their high values for the Index of Sites with Official Declaration, they contain a relatively larger number of PNAs and EMUs than other basins in the state (Table 5; Figure 5).
The Sierra Madre Oriental stands out for its large surface area and its good conservation status; it was the only non-marginal basin in the state that had a positive value for the Conservation Status Index. Aguilar et al. (2010) point this out in their study aimed at prioritizing the watersheds of Mexico from the perspective of the conservation of biodiversity, in which they registered a positive correlation between the priority level of the watersheds and their level of impact; this means that the level of impact increases as the importance value of the watersheds for conservation grows.
The Río Bravo-Matamoros-Reynosa basin, considered marginal in Nuevo León, registered the second lowest value for the Conservation Status Index (-27.2), due to the scarcity of legal documents for conservation with official declaration and the few proposed priority sites in its territory. Based on the above, this basin occupies the second-to-last place among the state’s basins in terms of conservation status, only after Presa Falcón-Río Salado (-33.5) (Table 5, Figure 5).
Although the Río Bravo-San Juan basin exhibited the highest value for the Index of Sites with Official Declaration (59.4) and the third for the Index of Proposed Priority Sites (35.5), it was the one with the highest Environmental Impact Index (60.7), and therefore it obtained a negative value for the conservation Status index (-10.8) (Table 5, Figure 5).
The Río Bravo-Sosa had the lowest negative value for the Conservation Status Index (-3.7) because it was the third highest value for the Index of Sites with Official Declaration (22.8), but the fourth for the Environmental Impact Index (32.1) (Table 5, Figure 5).
The Presa Falcón-Río Salado basin stands out for being the one with the lowest value for the Conservation Status Index (-33.5) among the fourteen watersheds in the state; it obtained the third place for the Environmental Impact Index (37.1) (Table 5, Figure 5).
The Río Bravo-Nuevo Laredo basin registered the fourth highest negative value for the Conservation Status Index (-14.9), having had the fourth value for the Environmental Impact Index (28.2) (Table 5, Figure 5).
Although Río Soto La Marina exhibited the lowest value for the Index of sites with Official Declaration (0.7) among the non-marginal basins, it registered a relatively low value for the Conservation Status Index (-5.0) (Table 5, Figure 5).
The Laguna Madre basin, regarded as marginal, obtained the third lowest value for the Conservation Status Index (-19.9), as a result of the scarcity of legal instruments for conservation with official declaration, and of the low number of priority sites proposed in its territory (Table 5, Figure 5).
The Presa San Fernando basin stands out for being the one with the second highest value for the Environmental Impact Index (40.5), as well as for the Index of Sites with Official Declaration (34.9) (Table 5, Figure 5).
Although the Río Tamesí watershed, regarded as marginal in Nuevo León, recorded a very low value for the Index of Sites with Official Declaration (0.7), it exhibited a positive value for the Conservation Status Index (16.59) (Table 5, Figure 5). Sierra Madre Oriental stands out for being the only non-marginal basin with a positive value for the Index of Sites with Official Declaration (11.0) (Table 5, Figure 5).
The Matehuala, Sierra de Rodriguez and Presa San José-Los Pilares basins had positive values for the Conservation Status Index and stand out for their extremely low values (< 1.5) for the Index of Sites with Official Declaration.
Finally, the Sierra Madre marginal basin exhibited a negative value for the conservation Status Index (-7.4) (Table 5, Figure 5).
The methodology employed to generate the indexes of the present study considers the environmental variables of biodiversity and governance attributes, and of environmental impacts as cited by other authors to prioritize the watersheds and aquatic ecoregions at a national and continental scale (Abell et al., 2000; Valencia et al., 2007; Aguilar et al., 2010).
The results make it possible to prioritize the watersheds according to the various indexes in order to implement actions geared at improving the conditions of the basins of Nuevo León.
Conclusions
Four of the 14 watersheds present in Nuevo León cover 79 % of this state’s territory: Río Bravo-San Juan, Presa Falcón-Río Salado, Río San Fernando and Sierra Madre Oriental, while other six cover a total of 2 492 km2 (3.9 % of the state’s territory) and are therefore regarded as marginal: Matehuala, Sierra de Rodríguez, Presa San José-Los Pilares and others, Río Tamesí, Laguna Madre and Río Bravo-Matamoros-Reynosa.
Nuevo León, with 7 % of its territory in PNAs, has a marked deficit in relation to the Aichi goal for the year 2020, of protecting at least 17 % of its ecosystems in PNAs. Of the 34 PNAs existing in the state, three watersheds concentrate the largest protected surface: Río Bravo-San Juan, Río Bravo-Sosa and the Sierra Madre Oriental. As for the rest of the watersheds, PNAs are present on less than 1 % of their surface area. There is only one RAMSAR site, in the San Fernando basin.
Only two PNAs in Nuevo León, covering 1 % of the state´s surface, have current management plans: La Pastora Park and the Cerro de la Silla Natural Monument, in the Río Bravo-San Juan basin.
Nuevo León contains 461 EMUs, concentrated in two basins: Río Bravo-Nuevo Laredo and Presa Falcón-Río Salado, both located in the north of the state.
The Río Bravo-San Juan basin, which houses the MAM, concentrates more than 90 % of the state’s total population.
The Conservation Status Index rates corresponding to the Río Bravo-San Juan and San Fernando basins evidence their high environmental impacts, despite having the largest number of legal instruments for their conservation, as indicated by their high values for the Index of Sites with Official Declaration
The Sierra Madre Oriental basin is one of the non-marginal basins with the highest Conservation Status Index, which renders it an important alternative source of water for the state.
The government authorities may utilize the results of the present study to orient the public policies of Nuevo León, in order to implement the necessary actions for improving the ecological conditions of the watersheds and ensure water supply for the population.
Referencias
Abell, R., D. Olson, E. Dinerstein, P. Hurley, J. Diggs, W. Eichbaum, S. Waters, T. Allnutt, C. Locks and P. Hedao. 2000. Freshwaters Ecoregions of North America: A Conservation Assessment. Island Press. Washington, DC. USA. 319 p. [ Links ]
Aguilar, V., M. Kolb, P. Koleff y T. Urquiza. 2010. Las Cuencas de México y su Biodiversidad: Una Visión Integral de las Prioridades de Conservación. In: Cotler, H. (coord.). Las Cuencas Hidrográficas de México. Diagnóstico y Priorización. Instituto Nacional de Ecología, Semarnat. México, D.F., México. pp. 142 a 153. [ Links ]
Arriaga, L., J. M. Espinoza, C. Aguilar, E. Martínez, L. Gómez y E. Loa (coords.). 2000. Regiones terrestres prioritarias de México. Comisión Nacional para el Conocimiento y uso de la Biodiversidad. México, D.F., México. 609 p. [ Links ]
Bezaury-Creel, J. E. 2009. El Valor de los Bienes y Servicios que las Áreas Naturales Protegidas Proveen a los Mexicanos. The Nature Conservancy Programa México - Comisión Nacional de Áreas Naturales Protegidas. México, D.F., México. 32p. [ Links ]
Bezaury-Creel, J. E., J. F. Torres y N. Moreno. 2012. Base de datos geográfica de áreas naturales protegidas estatales del Distrito Federal y municipales de México para el análisis de vacíos y omisiones en conservación. 1 capa ArcInfo + 1 archivo de metadatos. TNC-Pronatura-Conabio-Conanp, México, D.F., México. n/p. [ Links ]
Bezaury-Creel, J. E. , F. Ochoa-Pineda, M. O. Llano-Blanco, C. Lasch-Thaler, C. Herron, D. Vázquez-Castañeda, A. Hernández-Yañez y F. Hernández-Ruíz. 2017. Agua dulce, conservación de la biodiversidad, protección de los servicios ambientales y restauración ecológica en México. The Nature Conservancy. Ciudad de México, México. 72 p. [ Links ]
Cantú, C., F. González, J. Marmolejo y J. Uvalle. 2010. Paisaje y Aspectos Turísticos. In: Cantú, C., F. González, J. Uvalle y J. Marmolejo (eds.), Biodiversidad y Conservación del Monumento Natural Cerro de La Silla, México. UANL-CONABIO-CONANP. Monterrey, N.L., México. pp. 106-133. [ Links ]
Castellarini, F., C. Siebe, E. Lazos, B. de la Tejera, H. Cotler, C. Pacheco, E. Boege, A. R. Moreno, A. Saldívar, A. Larrazábal, C. Galán, J. M. Casado y P. Balvanera. 2014. Socio ecoregiones de México, escala: 1:1 000000. Edición: 1. Centro de Investigaciones en Ecosistemas, Universidad Nacional Autónoma. Proyecto: FQ003, Extraído del proyecto Servicios Ecosistémicos de México: patrones, tendencias y prioridades de investigación. Financiado por la Comisión Nacional para el Conocimiento y Uso de la Biodiversidad (Conabio) México, D.F., Morelia, Mich. México. s/p. [ Links ]
Sociedad para el Estudio y Conservación de las Aves en México-Comisión Nacional para el Conocimiento y Uso de la Biodiversidad (Cipamex-Conabio) . 2015. Áreas de importancia para la conservación de las aves, 2015. Escala: 1:250,000. Sección Mexicana del Consejo Internacional para la Preservación de las Aves. Financiado por CONABIO-FMCN-CCA. Comisión Nacional para el Conocimiento y Uso de la Biodiversidad, México, D.F. México. 369 p. [ Links ]
Comisión Nacional para el Conocimiento y Uso de la Biodiversidad (Conabio). 2002. Regiones Hidrológicas Prioritarias. Catálogo de metadatos geográficos. Comisión Nacional para el Conocimiento y Uso de la Biodiversidad. Escala: 1:4 000 000. México, D.F., México. s/p. [ Links ]
Comisión Nacional para el Conocimiento y Uso de la Biodiversidad-Comisión Nacional de Áreas Naturales Protegidas-The Nature Conservancy Programa México- Pronatura (Conabio-Conanp- TNC- Pronatura) . 2007. Sitios prioritarios terrestres para la conservación de la biodiversidad. Escala 1: 1 000 000. México, D.F., México. s/p. [ Links ]
Comisión Nacional para el Conocimiento y Uso de la Biodiversidad (Conabio). 2014. Áreas elegibles para la conservación en México, escala: 1:2 500 000. Comisión Nacional para el Conocimiento y Uso de la Biodiversidad. México, D. F., México. s/p. [ Links ]
Comisión Nacional para el Conocimiento y Uso de la Biodiversidad (Conabio). 2014a. Grado de rezago social por localidad, 2010. Escala 1: 250 000. Comisión Nacional para el Conocimiento y Uso de la Biodiversidad. México, D.F., México. s/p. [ Links ]
Comisión Nacional para el Conocimiento y Uso de la Biodiversidad (Conabio). 2014b. Índice de desarrollo humano por municipio, 2010, escala: 1:250 000. Comisión Nacional para el Conocimiento y Uso de la Biodiversidad. Programa de las Naciones Unidad para el Desarrollo México (PNUD). México, D.F., México. s/p. [ Links ]
Comisión Nacional para el Conocimiento y Uso de la Biodiversidad (Conabio). 2015. Base de Datos Geográfica de Áreas Naturales Protegidas Estatales, del Distrito Federal y Municipales de México. Escala 1:50 000. Comisión Nacional para el Conocimiento y Uso de la Biodiversidad / Comisión Nacional de Áreas Naturales Protegidas. México, D.F., México. s/p. [ Links ]
Comisión Nacional para el Conocimiento y Uso de la Biodiversidad (Conabio). 2016. Sitios de atención prioritaria para la conservación de la biodiversidad. Escala: 1:1 000 000. Comisión Nacional para el Conocimiento y Uso de la Biodiversidad. México, D.F., México. s/p. [ Links ]
Comisión Nacional para el Conocimiento y Uso de la Biodiversidad (Conabio) 2016a. Sitios prioritarios para la restauración. Escala: 1:1 000 000. Comisión Nacional para el Conocimiento y Uso de la Biodiversidad. México, D.F., México. s/p. [ Links ]
Comisión Nacional para el Conocimiento y Uso de la Biodiversidad (Conabio). 2017. Puntos de calor detectados con imágenes de satélite. http://incendios.conabio.gob.mx/ . (8 de diciembre de 2017). [ Links ]
Comisión Nacional para el Conocimiento y Uso de la Biodiversidad-Comisión Nacional de Áreas Naturales Protegidas (Conabio-Conanp). 2010. Sitios prioritarios acuáticos epicontinentales para la conservación de la biodiversidad. Escala: 1:1 000 000. Comisión Nacional para el Conocimiento y Uso de la Biodiversidad y Comisión Nacional de Áreas Naturales Protegidas. México, D.F., México. s/p. [ Links ]
Comisión Nacional del Agua (Conagua). 2016. Atlas del Agua en México. Comisión Nacional del Agua. Subdirección General de Planeación. SINA. México D.F., México. 137 p. [ Links ]
Comisión Nacional del Agua (Conagua). 2016a. Estadísticas del Agua en México, edición 2016. Publicaciones Estadísticas y Geográficas. SINA. México D.F. México. https://doi.org/978-968-817-895-9 (12 de enero de 2016). [ Links ]
Comisión Nacional de Población (Conapo). 2017. Proyecciones de crecimiento de la población 2010-2030. http://www.conapo.gob.mx/es/CONAPO/Proyecciones (10 de diciembre de 2017). [ Links ]
Cotler, H., A. Garrido, V. Bunge y M. Cuevas. 2010. Las Cuencas Hidrográficas de México: Priorización y Toma de Decisiones. In: Cotler, H. (coord.). Las Cuencas Hidrográficas de México. Diagnóstico y Priorización. Instituto Nacional de Ecología, Semarnat. México, D.F., México. pp. 210 a 215. [ Links ]
Dudley, N. and S. Stolton. 2003. Can protected areas quench our thirst? Conservation in Practice 4 (4): 30-31. [ Links ]
Inhabert, H. 1976. Environmental Indices. Serie Environmental Science and Technologý. New York Wiley. New York, NY USA. 178 pg. [ Links ]
Instituto Nacional de Estadística y Geografía (Inegi). 2010. Censo de Población y Vivienda 2010. SINCE (2 de diciembre de 2017). [ Links ]
Instituto Nacional de Estadística y Geografía (Inegi). 2016. Manchas urbanas y rurales, 2015', escala: 1:250 000. Edición: 2015. Instituto Nacional de Estadística y Geografía. Obtenido de Cartografía geoestadística urbana y rural amanzanada. Cierre de la Encuesta Intercensal 2015. Aguascalientes, Ags., México. s/p. [ Links ]
Instituto Nacional de Estadística y Geografía (Inegi). 2017. Población de Nuevo León. http://cuentame.inegi.org.mx/monografias/informacion/nl/poblacion/distribucion.aspx?tema=me&e=19 . (3 de diciembre de 2017). [ Links ]
Moreno, P. 2005. Gran atlas de México. Editorial Planeta. México, D.F., México. 146 p. [ Links ]
Pacheco, C., U. Carrillo, F. Castellarini y P. Balvanera. 2008. Consumo de agua para riego. Escala: 1:1 000 000. Centro de Investigaciones en Ecosistemas (CIEco), Universidad Nacional Autónoma de México Campus Morelia. Proyecto: FQ003, Extraído del proyecto FQ003: Servicios Ecosistémicos de México: patrones, tendencias y prioridades de investigación. Financiado por la Comisión Nacional para el Conocimiento y Uso de la Biodiversidad (CONABIO) México. Morelia, Mich., México. n/p. [ Links ]
Pacheco, C., U. Carrillo, F. Castellarini y P. Balvanera. 2008a. Consumo de agua de uso urbano, escala: 1:1 000 000. Centro de Investigaciones en Ecosistemas (CIEco), Universidad Nacional Autónoma de México Campus Morelia. Proyecto: FQ003, Extraído del proyecto FQ003: Servicios Ecosistémicos de México: patrones, tendencias y prioridades de investigación. Financiado por la Comisión Nacional para el Conocimiento y Uso de la Biodiversidad (CONABIO) México, D.F. Financiado por la Comisión Nacional para el Conocimiento y Uso de la Biodiversidad (CONABIO) México. Morelia, Mich., México. s/p. [ Links ]
Secretaría de Medio Ambiente y Recursos Naturales (Semarnat). 2013. Unidades de Manejo para el Aprovechamiento Sustentable de la Vida Silvestre 2010. Escala: 1:1. Secretaría de Medio Ambiente y Recursos Naturales. México, D.F., México. n/p. [ Links ]
United Nations Environment Programme-World Conservation Monitoring Centre-International Union for Conservation of Nature (UNEP-WCMC-IUCN) . 2016. Protected Planet Report 2016. UNEP-WCMC and IUCN. Cambridge UK and Gland, Switzerland. 73 p. [ Links ]
Valencia, J., J. Díaz y L. Vargas. 2007. La Gestión Integrada de los Recursos Hídricos en México: Un Nuevo Paradigma en el Manejo del Agua. In: Cotler, H. (comp.). El Manejo Integral de Cuencas en México. Estudios y Reflexiones para Orientar la Política Ambiental. Segunda Edición. Instituto Nacional de Ecología, Semarnat. México, D.F., México. 347 p. [ Links ]
World Bank. 2017. Urban population per cent of total. https://data.worldbank.org/indicator/SP.URB.TOTL.IN.ZS?view=map . (9 de diciembre de 2017). [ Links ]
Received: March 12, 2018; Accepted: October 08, 2018
 Este es un artículo publicado en acceso abierto bajo una licencia Creative Commons
