


Servicios Personalizados
Revista
Articulo
 texto en
  Inglés (pdf)
 Artículo en XML
 Referencias del artículo
 Enviar artículo por email
Indicadores
-
 Citado por SciELO
 -
 Accesos
Links relacionados
-
 Similares en
SciELO
Similares en
SciELO
Compartir

 Permalink
Revista mexicana de ciencias forestales
versión impresa ISSN 2007-1132
Rev. mex. de cienc. forestales vol.9 no.50 México nov./dic. 2018
https://doi.org/10.29298/rmcf.v9i50.237
Articles
Rainfall redistribution and nutrient input in Pinus cooperi C.E. Blanco
1Facultad de Ciencias Forestales, Universidad Autónoma de Nuevo León. México.
2Tecnológico Nacional de México, Instituto Tecnológico El Salto. México.
Precipitation is one of the most important forms of nutrient input to forest ecosystems; it enters the soil through redistribution pathways: Gross rainfall (Pi), Throughfall (Pd) and Stemflow (Ef). 42 events were evaluated in which the volumes of rainfall were recorded, as well as chemical composition: pH, electric conductivity, macro and micronutrients (Ca, Na, Mg, K, Zn, Mn, Fe and Cu). The objective of the present investigation was to determine the total deposition, incorporation and extraction of nutrients through Pi, Pd and Ef, in addition to the precipitation/deposition relation, to determine the differences in nutrients concentration, a comparison test was applied among the routes already indicated, under a vegetation cover of Pinus cooperi. Ca recorded the highest deposition and incorporation, with 42.89 and 21.74 kg ha-1 respectively. Cu showed the lowest input and accumulated 21.16 and 16.34 g ha-1. The rest of the nutrients presented a behavior from highest to lowest for Pd: Ca> Na> K> Mg> Mn> Fe> Zn> Cu, Pi: Ca> Na> K> Mg> Mn> Zn> Fe> Cu and for Sf: Ca> K> Na>Mg>Mn>Fe>Zn>Cu. This behavior can be associated with the deposition of solid particles on foliage surfaces and branches, phenology, as well as morphological and physiological traits of the species, as well as rainfall chemistry and dry days between rainfall events.
Key words: Nutrient input; nutrient deposition; macronutrients; micronutrients; Pinus cooperi C.E. Blanco; precipitation
La precipitación es una de las formas más importantes de entrada de nutrimentos a los ecosistemas forestales; ingresa al suelo mediante las vías de redistribución: Precipitación incidente (Pi), Precipitación directa (Pd) y Escurrimiento fustal (Ef). Se evaluaron 42 eventos en los cuales se registraron los volúmenes de lluvia, así como su composición química: pH, conductividad eléctrica, deposición de macro y micronutrimentos (Ca, Na, Mg, K, Zn, Mn, Fe y Cu). El objetivo de la presente investigación fue determinar la deposición total, incorporación y remoción de nutrimentos vía Pi, Pd y Ef, así como la relación precipitación/deposición, para determinar diferencias en la concentración de nutrimentos mediante la prueba no paramétrica de Kruskal-Wallis entre las vías ya señaladas, bajo la cubierta vegetal de Pinus cooperi. Ca fue el más importante, con 42.89 y 21.74 kg ha-1, respectivamente. Cu registró el menor aporte y acumuló 21.16 y 16.34 g ha-1. El resto de los nutrimentos presentaron comportamiento de mayor a menor en Pd: Ca> Na> K> Mg >Mn >Fe >Zn >Cu, Pi: Ca>Na>K>Mg>Mn>Zn>Fe>Cu y para Ef: Ca>K>Na>Mg>Mn>Fe>Zn>Cu. Este patrón se puede asociar con la deposición de partículas sólidas en el dosel, la fenología, la morfología y la fisiología de la especie, así como a la composición química de la lluvia y días secos entre eventos de precipitación.
Palabras clave: Aporte de nutrimentos; deposición de nutrimentos; macronutrimentos; micronutrimentos; Pinus cooperi C.E. Blanco; precipitación
Introduction
The main source of water for a terrestrial biome is precipitation, both its annual quantity and its distribution throughout the year determine the phenological and productive patterns of the ecosystem. Atmospheric humidity, although of lesser magnitude in terms of what represents the amount of water that contributes to the system, plays an important role in controlling the rates and demands of evapotranspiration by vegetation (Romero, 2007).
Part of the total precipitation in a forest is retained by the canopy and trunk of the trees (interception of the canopy), and is reintegrated into the atmosphere by evaporation. Of the total water that reaches the surface of the soil, a fraction comes from the dripping of the leaves or directly through the canopy (direct precipitation); the rest reaches the ground flowing through the surface of the shafts (shaft runoff). These two flows are of great importance in quantifying the balance of nutrients in ecosystems. However, there are differences in both the amount of water and the concentration of nutrients between them (Ward and Robinson, 1990; Huber and Oyarzun, 1992; Hanchi and Rapp, 1997).
The water that is deposited on the vegetal cover is enriched in terms of organic matter and mineral elements as a product of the exudates of the leaves and the shaft of the tree. In addition, the atmospheric particles that are retained and accumulated are dragged by the water and finally put in the soil, which generates more favorable conditions for the plants. The amount of deposition of nutrients depends on the type of canopy or species, the architecture and shape of the canopy (shaft, leaves and branches), chemical composition and structure of the tree. The magnitude of the retention and incorporation of nutrients within an ecosystem is closely related to the abundance of precipitation (Santa et al., 1989; Andrade et al., 1995; Xu et al., 2001; Xu et al., 2005; Nie et al., 2007). In this sense, Burch et al. (1996) determined that the highest concentration.
The objective of this investigation was to determine the contribution of nutrients in Pinus cooperi C. E. Blanco, a species of ecological importance, representative of El Salto, Durango State, and one of the main ones under forest exploitation. This knowledge contributes to the recovery of degraded soils through reforestation programs in which the selection of species starts from criteria such as this information. The relevance of this research is that it reports data on the incorporation and or removal, by precipitation, of nutrients in a forest ecosystem, considering atmospheric and biological (physiological and morphological) aspects that may influence the presence of this species, in particular, in the Mexican forests where it is naturally distributed.
Study area
The study area belongs to the El Salto Technological Institute and is located in the Sierra Madre Occidental, in the El Salto municipality in Durango (ITES), (23°47'07.08" N and 105°22'05.12" W), at an altitude of 2 500 m. The average temperature of the coldest month is from 3 ºC to 18 ºC and that of the hottest month from 6.5 ºC to 22 ºC; the average rainfall is 1 300 mm year -1.
The predominant species are Pinus cooperi C. E. Blanco, Pinus durangensis Ehren, Pinus leiophylla Schl. & Cham., Pinus teocote Schiede ex Schltdl. and Pinus ayacahuite Ehren, associated with pine-oak forest. The types of soils in the place are: Regosol, Fluvisol and Cambisol, they are shallow and stony soils (IUSS Grupo de Trabajo WRB, 2007; Nájera et al., 2011).
The record of the 42 precipitation events was made in the rainy season of the region, corresponding to June-September 2016. An event is the period of precipitation consisting of relatively continuous rain, drizzle or shower, separated from the previous one and later for a dry period of a minimum duration of 8 hours (Yáñez et al., 2014).
Components of precipitation
The methodology used to measure each route of redistribution of precipitation was based on the experience of Cantú and González (2002):
Incident precipitation. PVC channels of 1 000 cm2 (10 cm wide × 100 cm long) connected by means of hoses to 20 L containers were used, in which the rainwater was collected. Four channels were installed at 1.0 m above the surface of the ground in an open area without trees, adjacent to the experimental plot. The gutters were covered with a mesh to avoid obstruction with leaf litter and insects of the water flow to the recipients.
Direct precipitation: A plot (20 m × 10 m) was selected inside the vegetation cover to be investigated and the same type of gutters described was used to collect the rainwater that passed through the canopy; they were installed at random at 1.0 m above the ground surface fixedly below the canopy of a tree. Each gutter was connected to a 20 L plastic container and covered with a protective mesh to prevent contamination by leaf litter and insects. They were not removed during the entire study period.
Shaft runoff. Four trees were chosen at random and steel plastic hoses 3 cm in diameter were used, with perforations of 1.5 cm × 2.5 cm every 4 cm; they were fixed on the shafts at 1.5 m hgh. This device worked as a spiral rain collector.
For each rainfall event, readings were taken of the precipitation deposited in the 20 L cans and 100 mL samples in plastic jars for later storage.
The samples were transferred to the Soil Laboratory of the Facultad de Ciencias Forestales de la Universidad Autónoma de Nuevo León (School of Forest Sciences of the Autonomous University of Nuevo Leon)where the pH and electrical conductivity were recorded (CE, μS cm-1). Once the data were recorded, they were filtered with Whatman Grade I filter paper, for the elimination of impurities. Subsequently, they were stored at 4 °C to prevent the loss of volumes and decrease microbial activity.
Determination of macro and micronutrients
For the determination of macro and micronutrients, the material was analyzed directly by means of the atomic absorption spectrophotometer (Varian, SpectrAA-200 model) with a nutrient concentration curve of each of the elements, Mn, Fe, Zn and Cu.
To measure the concentration of Ca, Na, K and Mg it was necessary to make dilutions to calculate the concentration of the analyzed element, for which a series of suppressors was used to avoid ionization during the analysis:
For sodium (Na) and calcium (Ca) solutions of 1: 5 were prepared with a suppressor (KCl), potassium chloride and two samples were worked in one, that is, 1 mL of sample + 0.2 mL (KCl) + 3.8 mL of distilled water.
For magnesium (Mg), solutions of 1: 5 were prepared with lanthanum chloride (LaCl3); A solution of 0.1 ml (LaCl3) + 3.9 mL of distilled water was applied to the samples (1 mL).
For potassium (K), solutions of 1: 5 were prepared with (CsCl) cesium chloride and to the samples (1 mL) were added a solution of 0.1 mL (CsCl) + 3.9 mL of distilled water.
The concentrations obtained by the atomic absorption spectrophotometer for micro and macronutrients were recorded in mg L-1 and subsequently converted to g m-2 and kg m-2.
The conversion of units of direct precipitation and incident precipitation was calculated with the following equation:
To calculate the concentration of shaft runoff, the following equation was used:
Where:
CC = Concentration in g and kg m-2
Ci = Reading of the atomic absorption spectrophotometer mg L-1
Pp = Precipitation volume (mL)
Ac = Crown area (determined for each tree)
In the determination of Pd and Pi, the area occupied by the gutter was considered and for the shaft runoff, the area of the crown was used as the surface receiving the precipitation.
Total deposition of nutrients
For each event, the average of the four readings corresponding to each sample collected was taken. To calculate the total deposition, all of the 42 rain events were added.
Determination of the incorporation and removal of nutrients
The calculation of the net concentration of nutrients was based on the same principle proposed by Aboal (1998) and Tobón (2000) for the analysis of net precipitation.
For the incorporation of nutrients (IN), it was necessary to obtain the net concentration of nutrients (CNN), by means of the following equation (Jiménez et al., 2006):
Where:
CNN = Net concentration of nutrients
Cn Pd = Net concentration of direct precipitation
Cn Sf = Net concentration of shaft runoff
With the net concentration of nutrients (CNN), we proceeded to calculate the incorporation (IN) by means of the following equation (Jiménez et al., 2006):
Where:
IN = Integration of nutrients
CNN = Concentration of nutrients
Cn Pi = Net concentration of incident precipitation
According to this last author, positive incorporation values (+) represent incorporation of nutrients, while negative values (-) indicate removal.
Statistical analysis
To determine the distribution of nutrient deposition, a Kolmogorov-Smirnov normality test was performed, with the statistical package SPSS version 22.0 (IBM, 2013). The distribution of the data did not meet the assumption of normality, so the Kruskal-Wallis nonparametric test to determine the equality of medians.
Correlations were made with which the degree of association between the deposition variables (macro and micronutrients) and the volume of precipitation is explained.
Results and Discussion
Net and incident precipitation
The annual cumulative incident precipitation was 963.46 mm, while the net precipitation was 721.66 mm in 42 events analyzed. All of Pd's are; below the incident precipitation, which indicates that when flowing through the canopy and shaft of the tree, it is retained by the different structures. The interception losses I = Pi - (Pd + Ef) correspond to about 25 % of the total rainfall reaching the surface of the trees.
There were 42 events recorded for direct precipitation
Most of the events reached a volume less than 40 mm of incident precipitation (37 cases). Figure 1 shows that 31 was the highest value of incident precipitation and net precipitation, with 105.13 mm and 64.53 mm, respectively.
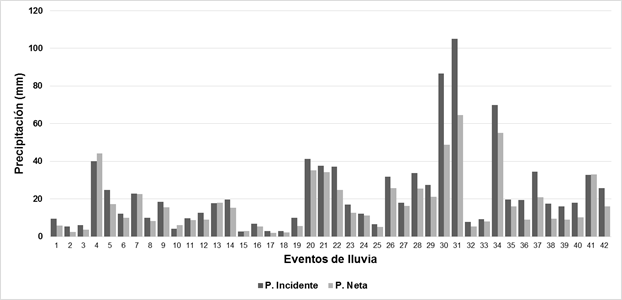
Precipitación = Precipitation; Eventos de lluvia = Precipitation events; P. incidente = Incident precipitation; P. neta = Net precipitation.
Figure 1 Precipitation (mm) incident and net over 42 events.
The results suggest that the size of individuals (Table 1) influences the flow, the greater the volume, the greater the volume of water reaching the ground (Romero, 2007).
Total deposition
With respect to the deposition of macronutrients, Ca had values of 64.05, 42.78 and 0.12 Kg ha-1, for incident precipitation, direct and fusional runoff, respectively. In addition, it was the nutrient with the highest deposition considered for the three evaluated routes, followed by Na with 31.96, 22.31 and 0.03 kg ha-1, K with 17.57, 12.77 and 0.04 kg ha-1, while Mg represented the nutrient with the lower deposition, with values of 12.14, 8.93 and 0.02 kg ha-1. The pathway with the greatest accumulation of macronutrients. It was the incident precipitation. The total deposition considered as the sum of direct precipitation and fusional runoff for Ca, Na, K and Mg was of values of 42.89, 22.35, 12.81 and 8.95 Kg ha-1, respectively, of which the first is the most outstanding value
Romero (2007) recorded a contribution of nutrients in incident precipitation of Ca, Na, K and Mg of 19.65, 19.24, 6.06 and 2.67 kg ha-1, respectively. A fusional runoff with 5.98, 5.21, 2.24 and 1.22 kg has the same order and in direct precipitation only reports the value of Ca with 22.50 kg ha-1, evaluating Pinus halepensis Miller and Pinus pinea L. in Alicante, Spain. These results coincide with the highest concentration of Ca, although the values are different and with the same order of deposition of the nutrients observed in the present study.
The deposition of the micronutrients is enriched by the Mn with values of 3 433.56, 2 787.90 and 4.51 g ha-1 for the incident precipitation, direct and fusional runoff, respectively. The concentrations of Fe were of 347.66, 368.88 and 1.84 g ha-1, while Zn accumulated 465.16, 339.33 and 0.45 g ha-1 and Cu had the lowest values for the three evaluated routes with 25.99, 21.13 and 0.03. The total deposition was dominated by Mn. The values of the total deposition were 2 792.41, 370.71, 339.78 and 21.16 g ha-1 for Mn, Fe, Zn and Cu.
Net concentration and incorporation of nutrients
Ca had the highest concentration (CNN), while Mg had the lowest. All the macronutrients evaluated recorded removal (-) at the passage of the canopy (Table 2).
Table 2 Total incorporation of macronutrients in Pinus cooperi C.E. Blanco.
| Nutrient | CNN (kg ha-1) | (+) Inc/(-)Rem | IN Total (kg ha-1) |
|---|---|---|---|
| Mg | 8.95 | -3.19 | 5.76 |
| Na | 22.35 | -9.61 | 12.74 |
| Ca | 42.89 | -21.16 | 21.74 |
| K | 12.81 | -4.76 | 8.05 |
Mg had a reception of 8.95 kg ha-1 and an incorporation of 5.76 kg ha-1, which indicates that during the circulation of the precipitation in the arboreal structure, 3.19 kg ha-1 were removed.
The absorption or removal of nutrients according to Jiménez et al. (2006) originates from two origins, by the dry deposition produced by the wind and by biological activity, which has been documented by various sources (Santa et al., 1989; Méndez, 1997; Romero, 2007); while the second refers to the movement of nutrients in plant tissues, but there is no information that specifies the net amount of nutrient exchange between plant / precipitation.
Jaramillo (2003) refers to the amount of nutrients that reach the soil (Total IN) for the Pinus caribea Morelet forest for K, Ca and Mg with values of 127.4, 85.8 and 27.0 kg ha-1, respectively; describes a removal of nutrients at the passage of the crown for the three minerals, as well as for the route of the shaft incorporations of 17.4, 5.4 and 8.5 kg ha-1. With respect to the values obtained in the present study, there are differences, since this amount is reduced for all minerals when going through the canopy of the crown and shaft.
As indicated in Table 2, Mn presented the highest value of CNN, while that of Cu was the lowest.
Three of the four micronutrients evaluated underwent removal, with the exception of Fe, which incorporated a small but significant amount. Table 3 shows that the rest of the micronutrients were absorbed by the structure.
Table 3 Total incorporation of macronutrients in Pinus cooperi C.E. Blanco.
| Nutrient | CNN (g ha -1 ) | (+)Inc/(-)Rem | IN Total (g ha -1 ) |
|---|---|---|---|
| ZN | 339.78 | -125.39 | 214.39 |
| Mn | 2 792.41 | -641.15 | 2 151.27 |
| Fe | 370.71 | 23.06 | 393.77 |
| Cu | 21.16 | -4.82 | 16.34 |
The assessment of micronutrients has been poorly documented and the importance of these minerals has not been given. In a Pinus pseudostrobus forest, Cantú and González (2001) evaluated Cu, Fe, Mn and Zn finding an average annual deposition with values of 1.0, 8.0, 3.5 and 2.0 g ha-1, respectively. These values are low compared to those obtained in the present investigation.
Rainwash
pH
During the period of follow-up of the rain events, the pH of the incident precipitation remained with the values between 4.42 to 6.12, once the rain flows on the tree canopy, it is modified (direct precipitation) and decreases slightly and acquires values from 4.21 to 6.27. When the rain runs through the shaft of the tree (fusional runoff), it slightly acidifies and reaches figures of 3.85 to 6.82 (Figure 2).
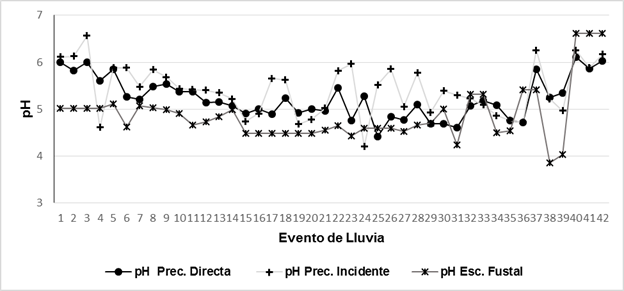
Evento de lluvia = Precipitation events; Prec. incidente = Incident precipitation; Prec. directa = Direct precipitation; Esc. fustal = Fustal runoff.
Figure 2 pH behavior in direct precipitation (Pd), incident precipitation (Pi) and fustal runoff (Sf) under the canopy of Pinus cooperi C.E. Blanco.
Abbassian et al. (2015), in its evaluation of nutrients in direct precipitation in a plantation of Picea abies (L.) H. Karst and a forest of Fagus orientalis Lipsky in northern Iran, gives values of pH between 7 and 7.5 for both species; in the incident precipitation, similar values (7). According to the results for P. cooperi, the differences between these are too high, with a moderate acidity, while in the case of P. abies and F. orientalis their values are considered as indicators of a moderate alkalinity.
The water that flows through the leaves and stem can be enriched in nutrients or can suffer a loss; therefore, the changes in the chemical composition are very variable and these usually happen from the plant to the water or vice versa. There is a relationship with the washing of elements and the direct absorption of the ions present in the precipitation (Romero, 2007; Yáñez et al., 2014).
According to Yáñez et al. (2014), who evaluated the hydrological properties of a fragment of the Tamaulipan Thorn Scrub (MET, for its acronym in Spanish) in northeastern Mexico, the pH values for the incident precipitation were 7.4; in direct precipitation it decreased slightly to 7.2 and for fusional runoff, to 6.9, which indicates results with the same tendency.
Electric conductivity
The electrical conductivity recorded an average value for the incident precipitation of 15.33 μS cm-1, while, for direct precipitation, when passing through the canopy of 12.08 μS cm-1, which indicates that there was a slight decrease; and for the fusional runoff of 39.06 μS cm-1, which means that the rain flowing through the shaft of P. cooperi increases the electrical conductivity (Figure 3).
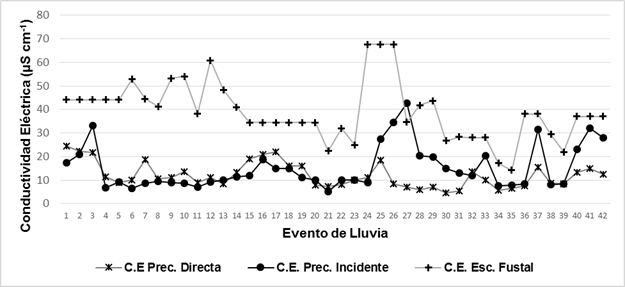
Conductividad eléctrica = Electrical conductivity; Evento de lluvia = Precipitation events; Prec. incidente = Incident precipitation; Prec. directa = Direct precipitation; Esc. fustal = Fustal runoff.
Figure 3 Behavior of the electrical conductivity in Pd, Pi and Ef, under the canopy of Pinus cooperi C.E. Blanco.
Conductivity is the measure of the capacity of an aqueous solution to transmit an electric current. This capacity depends on the presence of ions, their concentration, mobility and valence, and the environmental temperature. The solutions in most of their inorganic compounds are relatively good conductors. In contrast, molecules of organic compounds are poor from an electric current (Wetzel and Likens, 1979).
The results obtained show that the electrical conductivity presented a tendency very similar to that documented by Yáñez et al. (2014) in the evaluation of MET; there they recorded values of 71.7 μS cm-1 for incident precipitation, 145 μS cm-1 for direct precipitation and for fusional runoff of 126.8 μS cm-1. The concentration of ions differs in the fustal runoff, which for P. cooperi is greater.
García (2018) evaluated 15 precipitation events in the same plant association under different thinnings; reached figures of 100.56 and 187.63 μS cm-1 for incident and direct precipitation, respectively, which can be related to the volume of precipitation and deposition of nutrients for this ecosystem.
Statistical analysis for the concentration of nutrients
For macronutrients, most events presented significant differences in concentrations. Based on the data derived from the comparison test for the 3 redistribution pathways (Kruskal-Wallis), the Na was the element with the largest number of differences, representing 71.43 % (29 events), followed by Mg and K with the same number of differences equivalent to 69.05 % (29 events), and Ca that reached 64.29 % (27 events) (Table 4).
Table 4 χ2 values of according to the Kruskal-Wallis test for the different nutrients.
| Events | Mg | Na | Ca | K | Zn | Mn | Fe | Cu |
|---|---|---|---|---|---|---|---|---|
| 1 | 0.000NS | 1.333NS | 1.333NS | 1.333NS | 0.083NS | 5.333* | 5.398* | 0.000NS |
| 2 | 2.083NS | 0.333NS | 0.083NS | 1.333NS | 3.000NS | 0.333NS | 0.527NS | 4.083* |
| 3 | 2.083NS | 2.083NS | 0.083NS | 0.333NS | 2.08NS | 2.083NS | 5.463* | 3.000NS |
| 4 | 7.538* | 7.538* | 7.423* | 9.846** | 7.423* | 8.346* | 7.497* | 7.385* |
| 5 | 7.000* | 7.000* | 8.018* | 6.709* | 6.564* | 7.000* | 7.436* | 6.006* |
| 6 | 5.982* | 6.745* | 8.018* | 7.318* | 6.300* | 7.318* | 5.778NS | 6.018* |
| 7 | 7.538* | 7.731* | 6.000* | 9.846** | 9.269** | 8.000* | 8.056* | 7.449* |
| 8 | 9.269** | 8.769* | 7.731* | 8.000* | 8.000* | 7.538* | 5.654NS | 7.423* |
| 9 | 7.423* | 7.731* | 7.538* | 9.269** | 7.538* | 7.731* | 7.538* | 3.524NS |
| 10 | 7.538* | 7.385* | 7.423* | 8.346* | 7.423* | 7.423* | 7.652* | 7.423* |
| 11 | 9.269** | 9.846** | 7.423* | 7.731* | 8.769* | 7.538* | 7.420* | 9.302** |
| 12 | 7.731* | 7.538* | 8.346* | 9.846** | 5.333* | 3.000NS | 8.192* | 3.000NS |
| 13 | 8.000* | 7.538* | 7.731* | 8.000* | 0.333NS | 0.000NS | 9.881** | 4.500* |
| 14 | 7.731* | 7.385* | 7.731* | 7.42* | 3.000NS | 5.333* | 4.192NS | 2.080 NS |
| 15 | 0.000NS | 3.000NS | 0.083NS | 2.083NS | 0.333NS | 1.333NS | 1.708NS | 0.000NS |
| 16 | 0.083NS | 2.083NS | 0.000NS | 0.083NS | 0.333NS | 1.333NS | 1.033NS | 0.429NS |
| 17 | 1.333NS | 4.083* | 0.000NS | 0.333NS | 0.083NS | 5.333* | 2.083NS | 0.333NS |
| 18 | 4.083* | 4.083* | 0.333NS | 5.333* | 1.333NS | 3.000NS | 2.083NS | 2.400NS |
| 19 | 0.000NS | 1.333NS | 3.000NS | 5.333* | 5.333* | 5.333* | 0.333NS | 1.500NS |
| 20 | 7.538* | 7.731* | 7.423* | 7.538* | 7.538* | 7.731* | 7.538* | 6.250* |
| 21 | 9.846** | 8.000* | 9.846** | 8.769* | 5.333* | 1.333NS | 8.800* | 3.857* |
| 22 | 7.385* | 7.538* | 7.538* | 7.538* | 1.333NS | 2.083NS | 7.731* | 1.500NS |
| 23 | 8.346* | 8.000* | 8.000* | 7.538* | 7.538* | 8.000* | 7.038* | 7.282* |
| 24 | 2.083NS | 0.750NS | 0.750NS | 2.083NS | 0.000NS | 0.000NS | 0.000NS | 1.500NS |
| 25 | 0.500NS | 3.125 NS | 2.000NS | 0.000NS | 0.125NS | 0.000NS | 0.500NS | 1.800NS |
| 26 | 8.769* | 8.000* | 6.182* | 7.385* | 7.731* | 7.538* | 7.528* | 5.791NS |
| 27 | 7.423* | 7.538* | 7.385* | 7.385* | 8.000* | 7.423* | 5.773NS | 5.143NS |
| 28 | 8.000* | 9.846** | 9.846** | 7.423* | 7.423* | 7.538* | 9.032** | 4.511NS |
| 29 | 8.769* | 8.346* | 7.423* | 7.731* | 0.083NS | 4.083* | 8.028* | 0.333NS |
| 30 | 7.385* | 8.346* | 8.346* | 8.769* | 6.667* | 5.667NS | 7.538* | 0.333NS |
| 31 | 7.731* | 9.846** | 9.846** | 8.346* | 9.846** | 7.538* | 6.976* | 6.000* |
| 32 | 0.333NS | 1.333NS | 0.083NS | 2.083NS | 4.083* | 2.083NS | 0.083NS | 5.333* |
| 33 | 0.750NS | 0.083NS | 0.333NS | 0.750NS | 0.000NS | 0.000NS | 0.333NS | 0.000NS |
| 34 | 7.731* | 9.269** | 8.346* | 7.538* | 7.538* | 7.385* | 7.845* | 8.326* |
| 35 | 8.769* | 8.000* | 7.385* | 7.385* | 6.409* | 6.727* | 3.731NS | 5.143NS |
| 36 | 5.333* | 5.333* | 2.083NS | 4.083* | 5.333* | 5.333* | 1.708NS | 3.429NS |
| 37 | 9.846** | 8.346* | 8.346* | 7.731* | 4.083* | 3.000NS | 7.463* | 0.083NS |
| 38 | 8.227* | 8.909* | 8.227* | 7.636* | 8.909* | 8.227* | 7.409* | 6.045* |
| 39 | 8.909* | 8.909* | 8.909* | 6.000NS | 5.333* | 3.000NS | 6.073* | 0.083NS |
| 40 | 0.750NS | 0.333NS | 1.333NS | 1.333NS | 3.000NS | 0.750NS | 0.021NS | 0.750NS |
| 41 | 7.423* | 7.423* | 7.538* | 7.423* | 0.083NS | 0.750NS | 7.538* | 1.333NS |
| 42 | 0.000NS | 3.000NS | 2.083NS | 1.333NS | 5.333* | 5.333* | 1.349NS | 1.333NS |
NS = no significant difference (P> 0.05), * = significant difference (P≤0.05), ** = highly significant difference (P≤0.05). The events 1, 2, 3, 15, 16, 17, 18, 19, 24, 25, 32, 33, 36, 40 and 42 no no fustal runoff (Ef) was recorded.
Zn, Mn, Fe and Cu had significant differences in 23, 23, 24 and 12 rain events, corresponding to 54.76 % for Zn and Mn, 57.76 % and 28.57 % for Fe and Cu.
Linear correlations
To understand the degree of association between the study variables, correlations were made to define the degree of association between nutrient deposition and precipitation.
Incident precipitation
The degree of association between variables is reliable in each macronutrient evaluated, in which the highest setting was Na with an R² of 0.77 and, in the opposite case, in Mg with an R² of 0.47, considered as an average adjustment. Most of the events are concentrated in precipitations smaller than 35 mm, although exceptionally occur some whose volumes exceed 60 mm.
Figure 4 shows the deposition ratios for the four macronutrients, which indicate that, with a greater volume of incident precipitation, there is a greater accumulation of nutrients.
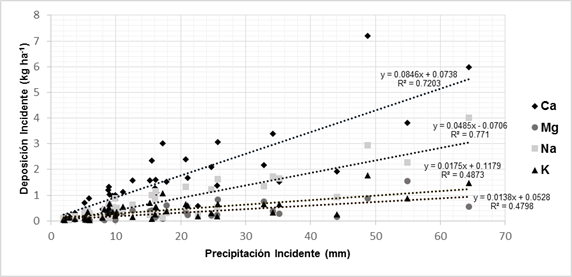
Deposición incidente = Incident deposition; Precipitación incidente = Incident precipitation.
Figure 4 Relationship between incident precipitation (mm) and incident deposition (kg ha-1) of macronutrients.
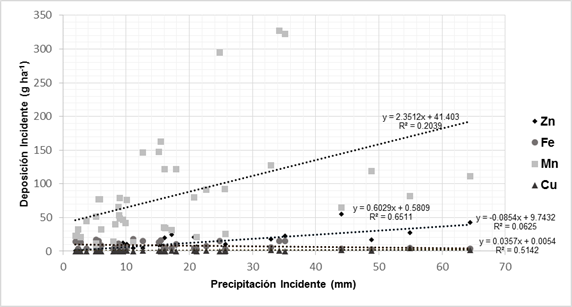
The ratio of micronutrients in the incident precipitation showed a low coefficient of determination for most of the evaluated cases. This may be influenced by other factors, that is, not only the amount of precipitation affects your deposition; it can also be attributed to its low availability. In this case, the relation with a better fit is Zn with a value of R² of 0.65, while of Fe was of R² of 0.06
Net precipitation
The net precipitation, in addition to being influenced by atmospheric factors, is also modified by others such as the phenology and morphology of the species.
The regression equations indicate mean and high R² values of 0.77, 0.81, 0.72 and 0.50 for Ca, Na, K and Mg, respectively; net precipitation a considerable predictor variable in the nutrient deposit (Figure 6).
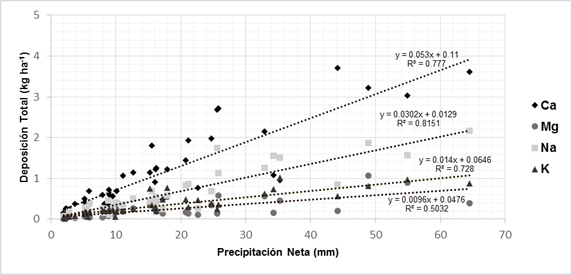
Deposición total= Total deposition; Precipitación neta = Net precipitation
Figure 6 Relationship between net precipitation (mm) and total deposition (Kg ha-1) in macronutrients.
Figure 7 shows that micronutrients registered low R² values of 0.25, 0.08, 0.37 and 0.37 for Mn, Fe, Zn and Cu, respectively, in which it can be noticed that the amount of precipitation does not fully describe the deposit of nutrients, which responds to other factors that determine the deposition. In precipitation below 30 mm, greater deposition of nutrients occurs.
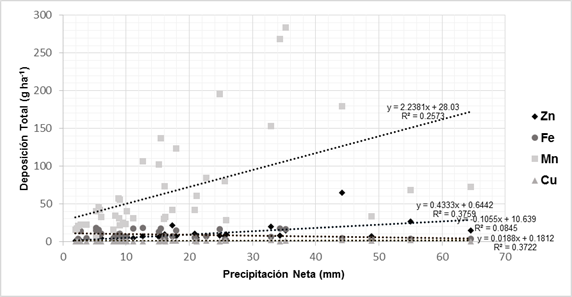
Deposición total= Total deposition; Precipitación neta = Net precipitation
Figure 7 Relationship between net precipitation (mm) and total deposition (g ha-1) in micronutrients.
The results show the importance of the factors that influence the deposition of nutrients, of biotic and abiotic origin, which are very diverse. They emphasize, mainly, the form and the density of the glass, the composition and the foliar age, the variations in the texture of the bark, the presence of lichens, the age of the forest, the architecture of the tree, the precipitation regime, the atmospheric composition, the season, the type of vegetation, the amount and duration of precipitation, the altitude of the area, the activity of the microflora, among others (Santa et al., 1989; Méndez, 1997; Pryor and Barthelmie, 2005; Návar et al., 2009).
Forest hydrology is considered a fundamental part to understand the dynamics of an ecosystem, so it is relevant to describe the flow of precipitation and nutrients within them, where the structure of the forest canopy is the main factor that directly influences these processes (Wan and Chen, 1999; Xiao et al., 2002).
For the evaluation of species in this context, the amount and duration of rainfall explain the variation of deposition and sources and external factors are important for the presence of chemicals in precipitation (Návar et al., 2009).
Conclusions
The incorporation of macronutrients has an order of higher to lower Ca> Na> K> Mg, while for micronutrients Mn, Fe, Zn and Cu.
The route of redistribution with greater nutrimental flow was direct precipitation, otherwise, the shaft runoff.
There is a greater association of macronutrient deposition with precipitation volumes, while in micronutrients deposition is influenced by other factors besides the volume of precipitation, such as climate, environmental temperature, rainfall regime, biology of the species and anthropogenic activities, among others.
Pinus cooperi offers a great variety of economic benefits for the north of the country, for its timber use. Based on the results from the present study, it is a species that greatly contributes to the recharge of soil nutrients by rainwashing, which is why it plays an important role in the recovery and restoration of the ecosystems.
Acknowledgements
The authors thank the Facultad de Ciencias Forestales, UANL and the Instituto Tecnológico de El Salto for the technical support provided to accomplish this study, as well as to the Project Ciclos Biogeoquímicos en Bosques de la Sierra Madre Occidental, de la Región de El Salto, Durango, México (Biological Cycles in Forests of the Sierra Madre Occidental of the El Salto Region, Durango, México) Project number TECNM.5746.16-P and to Conacyt for the scholarchip for graduate studies to carry out this research.
REFERENCES
Abbasian, P., P. Attarod, S. M. M. Sadeghi, J. T. Van Stan II and S. M. Hojjati. 2015. Throughfall nutrients in a degraded indigenous Fagus orientalis forest and a Picea abies plantation in the North of Iran. Forest Systems 24(3): 2171-9845. [ Links ]
Aboal V., J. R. 1998. Los flujos netos hidrológicos y químicos asociados de un Bosque de Laurisilva en Tenerife. Tesis Doctoral. Universidad de la Laguna. Tenerife, España. 184 p. [ Links ]
Andrade G., D. C., D. Da Silva H., A. Ferreira C., F. Bellote A. y U. I. Moro L. 1995. Contribución del agua de lluvia en la oferta de nutrimentos minerales para Eucalyptus grandis. Bosque 16(1):47-51. [ Links ]
Burch, H., P. Waldner and B. Fritschi. 1996. Variation of pH and concentration of nutrients and minerals during rain-events. In: 6th Conference of the European Network of Experimental and Representative Basins (ERB). Ecohydrological Processes in Small Basins. 24-26 September. Strassbourg, France. pp. 59-64. [ Links ]
Cantú S., I. and H. González R. 2001. Interception loss, throughfall and stemflow chemistry in pine and oak forests in northeastern Mexico. Tree Physiology 21(12-13):1009-1013. [ Links ]
Cantú S., I. y H. González R. 2002. Propiedades hidrológicas del dosel de los bosques de pino-encino en el noreste de México. Ciencia UANL 5(1):72-78. [ Links ]
García L., Y. W. 2018. Pérdidas por intercepción de lluvia en el matorral espinoso tamaulipeco bajo diferentes intensidades de raleo. Tesis maestría. Facultad de Ciencias Forestales, Universidad Autónoma de Nuevo León. Linares, N.L., México. 45 p. [ Links ]
Hanchi, A. and M. Rapp. 1997. Stemflow determination in forest stands. Forest Ecology and Management 97: 231-235. [ Links ]
Huber, A. W. y C. E. Oyarzun. 1992. Redistribución de las precipitaciones en un bosque siempre-verde del sur de Chile. Turrialba 42(2): 192-199. [ Links ]
International Business Machines (IBM). 2013. IBM SPSS Statistics for Windows, Version 22.0. IBM Corp. Armonk, NY, USA. n/p. [ Links ]
Jaramillo, A. 2003. La lluvia y el transporte de nutrimentos dentro de ecosistemas de bosque y cafetales. Cenicafé 54(2):134-144. [ Links ]
Jiménez R., C. J., C. Calvo A. y D. Arias A. 2006. Lavado de nutrimentos en plantaciones forestales de Vochysia ferruginea Mart. y Vochysia guatemalensis Donn. Sm., Sarapiquí, Costa Rica. Revista Forestal Mesoamericana Kurú 3(8):16-26. 1-11. [ Links ]
Méndez G., J. 1997. Perfil químico de la precipitación a través del dosel de cuatro especies de leguminosas de una plantación en Linares, NL. Tesis doctoral. Universidad Autónoma de Nuevo León. Linares, N.L., México. 120 p. [ Links ]
Nájera L., J. A., O. A. Aguirre C., E. J. Treviño G., J. Jiménez P. y E. Jurado Y. 2011. Tiempos y rendimientos del aprovechamiento forestal en El Salto, Durango, México. Revista Chapingo Serie Ciencias Forestales y del Ambiente 17(1):49-58. [ Links ]
Návar, J., J. Méndez G. and H. González. 2009. Gross precipitation and throughfall chemistry in legume species planted in Northeastern México. Plant and Soil 318(1-2):15-26. [ Links ]
Nie, L., D. Wang and J. Li. 2007. Transfer characteristics of nutrient elements through hydrological process of a Pinus tabulaeformis stand in the West Mountain of Beijing. Frontiers of Forestry in China 2(3):329-334. [ Links ]
Pryor S., C. and J. Barthelmie R. 2005. Liquid and chemical fluxes in precipitation, throughfall and stemflow: observations from a deciduous forest and a red pine plantation in the midwestern USA. Water, Air, and Soil Pollution 163(1-4):203-227. [ Links ]
Romero C., L. 2007. Estudio de los flujos hídricos en las Dunas de Guardamar Del Segura. Tesis Doctoral. Universidad de Alicante. Guardamar del Segura, España. 296 p. [ Links ]
Santa R., I., J. F. Gallardo, C. San Miguel y A. Moyano. 1989. Intercepción, pluviolavado y escorrentía cortical en una plantación de Pinus sylvestris de la Cuenca de Candelario (centro-oeste de España). Bosque 10(1):19-27. [ Links ]
Tobón M., C., I. W. Bouten and S. Dekker. 2000. Forest floor water dynamics and root water uptake in four forest ecosystems in northwest Amazonia. Journal of Hydrology 237(3-4):169-183. [ Links ]
Wan, S. Q. and L. Z. Chen. 1999. Canopy distribution of precipitation in warm temperate deciduous broad-leaved forests. Acta Phytoecologica SINICA 23(6) 557-561. [ Links ]
Ward, R. C. and M. Robinson. 1990. Principles of hydrology. McGraw Hill International Editions. London, England, UK. pp. 54-78. [ Links ]
Wetzel, R. G. and G. Likens. 1979. Limnological analyses. Ed. Springer. Alabama, NY USA. 429 p. [ Links ]
IUSS Grupo de Trabajo WRB. 2007. Base referencial mundial del recurso suelo. Primera actualización. Informes sobre Recursos Mundiales de Suelos No. 103. FAO. Roma, Lazio, Italia, 117 p. [ Links ]
Xiao, Y., L. Dai, D. Niu, F. Tong, G. Chen and H. Deng. 2002. Influence of canopy on precipitation and its nutrient elements in broad-leaved/Korean pine forest on the northern slope of Changbai Mountain. Journal of Forestry Research 13(3):201-204. [ Links ]
Xu, Y., G. Zhou, Z. Wu, T. Luo and Z. He. 2001. Chemical composition of precipitation, throughfall and soil solutions at two forested sites in Guangzhou, South China. Water, Air, and Soil Pollution 130 (1-4):1079-1084. [ Links ]
Xu, X., Q. Wang and E. Hirata. 2005. Precipitation partitioning and related nutrient fluxes in a subtropical forest in Okinawa, Japan. Annals of Forest Science 62(3):245-252. [ Links ]
Yáñez D., M. I., I. Cantú S., H. González R. y J. I. Uvalle S. 2014. Redistribución de la precipitación en tres especies arbustivas nativas y una plantación de eucalipto del noreste de México. Tecnología y Ciencias del Agua 5(2): 71-84. [ Links ]
Received: March 15, 2018; Accepted: October 26, 2018
 Este es un artículo publicado en acceso abierto bajo una licencia Creative Commons
