


Services on Demand
Journal
Article
 text in
  English (pdf)
 Article in xml format
 Article references
 Send this article by e-mail
Indicators
-
 Cited by SciELO
 -
 Access statistics
Related links
-
 Similars in
SciELO
Similars in
SciELO
Share

 Permalink
Revista mexicana de ciencias forestales
Print version ISSN 2007-1132
Rev. mex. de cienc. forestales vol.9 n.50 México Nov./Dec. 2018
https://doi.org/10.29298/rmcf.v9i50.236
Articles
Phytodiversity and structure of a pine - oak forest in the Sierra Madre del Sur, México
1Facultad de Desarrollo Sustentable, Universidad Autónoma de Guerrero. México.
2Instituto para el Manejo y Conservación de la Biodiversidad A. C. México.
3Facultad de Ciencias Forestales, Universidad Autónoma de Nuevo León. México.
4Escuela Técnica Superior de Ingenieros en Montes, Universidad Politécnica de Madrid. España.
The condition of the vegetation of a pine forest in the Sierra Madre del Sur in the state of Guerrero, Mexico, was evaluated. Five 1 000 m2 circular plots were established. A census of every > 4’ DBH woody species was made. The height (h), diameter (DBH) and canopy diameter were measured for each tree. Density, coverage, and frequency were estimated. The importance value index was calculated as well as diversity through the Margalef Index (DMg) and the Shannon-Wiener Index (H'). The vertical structure was described by Pretzsch Index. In total, five species which belong to two families and two genera were recorded. The family with the greatest presence in the study was Fagaceae with three species. The specie with the highest value of importance was Pinus oocarpa, 63.53 %, in contrast to Quercus rugosa with 3.23 %. The vertical diversity index of Pretzch recorded the highest occurrence of species in the low stratum, with 50.4 % of the individuals; of which P. oocarpa contributed by 51 individuals. It is concluded that the evaluated plant community is in an active regeneration state and has low diversity as well as scarce species richness.
Key words: Mixed forest; diversity; phytodiversity; ecological indicators; Pretzch Index; Pinus - Quercus forests
En un bosque de Pinus-Quercus en la Sierra Madre del Sur en el estado de Guerrero, se evaluó la fitodiversidad y estructura de la vegetación. Se establecieron cinco parcelas circulares de 1 000 m2. Se realizó un censo de todas las especies leñosas con un DAP > 10 cm. A cada individuo se le tomaron medidas dendrométricas de altura total (h), diámetro (DAP) y diámetro de la copa. Se estimó la densidad, la cobertura, la frecuencia y el Índice de Valor de Importancia, así como la diversidad mediante el Índice de Margalef (D Mg ) y el Índice de Shannon-Wiener (H´). La estructura vertical se describió mediante el Índice de Pretzsch. En total se registraron cinco especies pertenecientes a dos familias y dos géneros. La familia con mayor presencia en el lugar de estudio fue Fagaceae con tres especies. Pinus oocarpa registró el mayor valor de importancia, de 63.53 %, en contraste con Quercus rugosa con 3.23 %. El índice de diversidad vertical de Pretzch reveló la mayor ocurrencia de especies en el estrato bajo, con 50.4 % de los individuos; de los cuales P. oocarpa aportó 51. Se concluye que la comunidad vegetal estudiada está en proceso de regeneración activa y posee baja diversidad y una riqueza de especies reducida.
Palabras clave: Bosque mixto; diversidad; fitodiversidad; indicadores ecológicos; Índice de Pretzch; bosques de Pinus - Quercus
Introduction
Forests contribute to the provision of environmental goods and services, such as the conservation of biological diversity, carbon sequestration, regulation of the hydrological cycle and climate (Seppelt et al., 2011). After the tropical forest, Pinus-Quercus forests are one of the most diverse ecosystems in the world; they are found in the United States of America, Mexico, Guatemala, El Salvador, Nicaragua, Honduras and Cuba (Mora and Alanís, 2016).
The structure of these forests is recognized as a key indicator of fitodiversity, ecological stability and the development of stands (Franklin et al., 2002), along with density and diversity are important characteristics for the quantitative description of vegetation (Gadow et al., 2007). In this sense, trees are the main elements of the ecosystem structure (Del Río et al., 2003) and an adequate indicator of biodiversity to assess the status of the forest stand (Ozdemir et al., 2012).
According to Magurran (2004), measures of richness provide an understandable and instantaneous expression of diversity, and indicators of horizontal structure such as density, dominance and frequency; they describe the relationship between species of a population (Hernández et al., 2013; Saravanan et al., 2013), and they have been frequently used in vegetation studies (Castellanos et al., 2010; Alanís et al., 2011; Méndez et al., 2014), from their great intuitive appeal.
However, in the part of the Sierra Madre del Sur that belongs to the state of Guerrero, few studies have been developed regarding the current state of the Pinus-Quercus forests. In this context, the present investigation evaluates the fitodiversity and structure of a Pinus-Quercus forest in the Sierra Madre del Sur, Mexico. This research will generate information about the current state of the vegetation, which could be used for the development of ecological restoration programs.
Materials and Methods
Study Area
The study described below was conducted in an area of Pinus-Quercus forest in the Atoyaquillo ejido, Coyuca de Benítez municipality, which is part of the Sierra Madre del Sur in the state of Guerrero, Mexico. The area is located at 17°09'46.34 "north and 100°03'55.76" west. The altitudinal interval is from 1 000 to 1 100 m. The average annual rainfall is 1 100 mm (Figure 1) (Inegi, 2002).

Analysis of vegetation
To evaluate the condition of the vegetation of a Pinus-Quercus forest, five 1 000 m2 circular plots (radius =17.84 m) were established. This design was chosen because only one control point is required at the center, unlike rectangular or square plots that consider four (McRoberts et al., 2015). They were randomly distributed in areas that presented the same physiographic conditions of slope, exposure and altitude. In the sampling plots, a census of all woody species with a DBH> 10 cm (d0.10 m) was carried out. The variables quantified for each individual were: total height (h), with a Suunto Pm-5 hypsometer; the diameter (DBH), with a 1270mm Haglöf Mantax Blue caliper; and a crown diameter with a Truper ® fiberglasss measuring tape of 100 m (north - south and east - west).
The density by species was determined with respect to the total number of trees; coverage, depending on the area of the cup; and its frequency based on the presence of the species in the sampling plots. The calculated variables were used to calculate the Importance Value Index (IVI), which is a weighted value at the taxon level, and which acquires percentage values on a scale of 0 to 100 (Mostacedo and Fredericksen, 2000).
Data analysis
To evaluate the contribution of the species to the structure of the plant community of interest, the estimation of the following variables was used: abundance, coverage, frequency and value index of importance. For the species richness the Margalef index (D Mg ) was used and for the alpha diversity the Shannon-Wiener index (H') (Magurran, 2004) (Table 1).
Table 1 Formula used to determine the indexes for horizontal distribution, of species diversity and vertical structure.
| Formula | Num. | Description |
|---|---|---|
|
|
(1) |
De = Absolute density De rel = Relative density per species |
|
|
(2) |
N
i
= Number of de individuals of the
i species S = Swampling surface area (ha) |
|
|
(3) |
Do = Absolute
dominance Gi = Basimetric area of the i species S = Surface area (ha) |
|
|
(4) |
Do
rel
= Relative dominance of the
i species in regard to total dominance Do = Absolute dominance |
|
|
(5) |
Fr = Absolute
frequence Fr rel = Relative frequence of the i species in regard to total frequence P i = Number of sites in which the i species is present NS = Total number of sampling sites |
|
|
(6) | |
|
|
(7) |
De
rel
= Relative density per species in regard to total density Do rel = Relative dominance of the i species in regard to total dominance Fr rel = Relative frequence of the i species in regard to total frequence |
|
|
(8) |
D
Mg
= Margalef’s index s = Number of present species ln = Natural logarithm N = Total number of individuals |
|
|
(9) |
H´ =
Shannon-Wiener índex S = Number of present species |
|
|
(10) |
N = Total number
of individuals n i = Number of individuals of the i species ln = Natural logarithm |
|
|
(11) |
S = Number of present species Z = Number of vertical strata |
|
|
(12) | |
|
|
(13) |
P
ij
= Species percentage in each zone;
it is calculated by the following equation: p ij =ni,j/N n i,j = Number of individuals of the same i species in the j zone N = Total number of individuals |
The vertical structure of the vegetation was characterized with the index of A (Pretzsch, 2009) (Table1), which considers minimum values of 0 and maximum of A max , and in which the vegetation is represented in three strata, according to the maximum recorded height: stratum I: 80 %-100 % of the maximum height of the vegetation; stratum II: 50 %-80 %, and stratum III: from 0 to 50 %.
If A is equal to 0, the stand is constituted by a single species in a single stratum, whereas A max occurs when all the species are in equal proportions in the stand and in the different strata (Pretzsch, 2009).
Results and Discussion
Diversity
The Margalef index (1951) yielded a value of 0.72, which implies a low diversity according to the same author's measurement criteria, in which values lower than 2.0 indicate a low species richness. The Shannon index (1948) of 0.78 stands for a low diversity according to the parameters of the same author. In an investigation conducted under the same methodology in a temperate forest of the Sierra Madre del Sur of Mexico, Méndez et al. (2014) obtained a similar value in the Margalef index, but higher in the Shannon index.
In another investigation, Alanís et al. (2011) recorded higher values in both indices in a study on tree regeneration after fire in the Chipinque Ecological Park (northeast of Mexico); López et al. (2017) calculated higher figures when evaluating the composition and diversity of forest species in temperate forests of the state of Puebla, based on the same dasometric variables estimated in this study. Graciano et al. (2017) also obtained outstanding values when studying pine - oak forests in different regions of northeastern Mexico. The low diversity of tree species in this type of ecosystem is attributed to the high frequency of Pinus and Quercus genera in these plant communities (Mora and Alanís, 2016).
Species richness
A richness of five species was recorded, which belong to two families and two genera (Table 2). Of the two families, Fagaceae is represented by three species, while the Pinaceae family only two. Méndez et al. (2014) found five families and the same number of species in a Pinus-Quercus forest of the Sierra Madre del Sur after a fire. Juárez et al. (2014) accounted for a lower number of species in a forest of the Sierra de San Carlos in Tamaulipas, Mexico; whereas Torres et al. (2006), Alanís et al. (2011), Zacarías et al. (2011), Hernández et al. (2013), Graciano et al. (2017), López et al. (2017) and Rubio et al. (2017) registered a greater number of species in different regions of Mexico in this plant association, compared to this study. This low species richness could be due to the influence of anthropogenic factors such as agriculture, illegal logging, local use of species and the constant fires from illegal crops in the region.
Table 2 List species in the study area.
| Scientific name | Common name | Family |
|---|---|---|
| Pinus maximinoi H. E. Moore | Pino | Pinaceae |
| Pinus oocarpa Schiede ex Schltdl. | Ocote | Pinaceae |
| Quercus crassifolia Benth. | Encino blanco | Fagaceae |
| Quercus elliptica Née | Encino amarillo | Fagaceae |
| Quercus rugosa Née | Barrilillo | Fagaceae |
Density
A total number of 254 individuals (N) ha-1 were counted, 88.19 % (22 4 N ha-1) from which are pines and 11.81 % (30 N ha-1), oaks. Pinus oocarpa had the highest density (77.95 %; 198 N ha-1), and in contrast, Quercus rugosa had the lowest value (0.79 %; 2 N ha-1). Torres et al. (2006), Alanís et al. (2011), Méndez et al. (2014), Graciano et al. (2017) and López et al. (2017) recorded a higher number of trees per hectare at different regions of pine-oak forests of Mexico.
There is a great variety of species that stand out as the most abundant in pine-oak ecosystems in Mexico. Méndez et al. (2014) in an analysis of post-fire regeneration in a forest in the Sierra de Guerrero, Pinus radiata D. Don., in a characterization study of post-fire regeneration too, Alanís et al. (2011) considered Quercus polymorpha Schltdl. & Cham. as an outstanding species in temperate forests of northeastern Mexico; Graciano et al. (2017) as well as Hernández et al. (2013) in the same type of ecosystem, selected Pinus cooperi C. E Blanco and Pinus arizonica Engelm. López et al. (2017) referred to Pinus montezumae Lamb. in temperate forests of Puebla (Table 3).
Table 3 Ecological importance of the species at the study area.
| Scientific name | Density | Dominance (crown area) |
Frequency | IVI | |||
|---|---|---|---|---|---|---|---|
| Absolute N ha-1 |
Relative A r |
Absolute m2 ha-1 |
Relative A r |
||||
| Absolute | Relative | ||||||
| Pinus oocarpa | 198 | 77.95 | 10 891 | 70.96 | 5 | 41.67 | 63.53 |
| Pinus maximinoi | 26 | 10.24 | 2 561 | 16.69 | 2 | 16.67 | 14.53 |
| Quercus elliptica | 12 | 4.72 | 536 | 3.49 | 1 | 8.33 | 5.52 |
| Quercus crassifolia | 16 | 6.30 | 1 273 | 8.29 | 3 | 25.00 | 13.20 |
| Quercus rugosa | 2 | 0.79 | 88 | 0.57 | 1 | 8.33 | 3.23 |
| Total | 254 | 100 | 15 349 | 100 | 12 | 100 | 100 |
Dominance (coverage)
The total coverage in the area studied was 15 348 m2 ha-1, which suggests a coverage> 100 %, and, therefore, a crown overlap is confirmed, a percentage with which Alanís et al. agree (2011); Hernández et al. (2013) recorded a lower coverage (88.76 %) in their research in a temperate forest of Chihuahua.
Of the two genera of interest, Pinus predominates with 87.64 % coverage (13 452 m2 ha-1), while Quercus occupies the remaining percentage (1 897 m2 ha-1). The results of Alanís et al. (2011) and Sánchez et al. (2014) also pondered Pinus with the highest dominance, as well as various authors. At the species level, Pinus oocarpa had the highest relative coverage with 70.96 % (10 891 m2 ha-1), and Quercus rugosa only 0.57 % (88 m2 ha-1) (Table 3).
Frequency
Pinus was present in all the sampling plots, in particular Pinus oocarpa (41.67 %) and Quercus in three; Quercus elliptica and Quercus rugosa had the lowest relative frequency (8.33 %) and were only identified in one plot (Table 3). This behavior of the pines was ratified by Jiménez et al. (2001), Torres et al. (2006), Alanís et al. (2008), Hernández et al. (2013), Méndez et al. (2014), Delgado et al. (2016), Graciano et al. (2017) and Hernández et al. (2013) in their respective investigations; but Zacarías et al. (2011) and Alanis et al. (2011) highlighted Quercus as the most frequent genus.
Importance Value Index (IVI)
Of the two genera studied Pinus reached 78.05 % of IVI value, and Quercus 21.95 %. At the species level Pinus oocarpa obtained the highest value with 63.53 % and the lowest was Quercus rugosa with 3.23 % (Table 3). The authors who confirmed the highest frequency of pines, also do so for IVI, but do not coincide with the species with the present investigation. Alanís et al. (2010), Alanís et al. (2011) and Zacarías et al. (2011) registered Quercus with the highest IVI in their research experiences.
Diameter and heights classification
In the histogram it is observed that an exponential trend line decreases as the diametric classes increase. The categories of 10-20 cm and 20-30 cm gather more than 50 % of the individuals included in the study, which acts as an indicator of active regeneration due to the high recruitment level of individuals in the area.
The third category also houses a significant number of individuals, but categories greater than 40 cm of DAP group a smaller amount. The results indicate a forest in regeneration and growth in which the most abundant population is grouped in the first diametric categories (Figure 1). Regarding heights, in the category of 11-20 m, the largest number of trees is concentrated, followed by the interval of 0 - 10 m; and finally the smallest group falls within the category of 21 - 30 m (Figure 2).
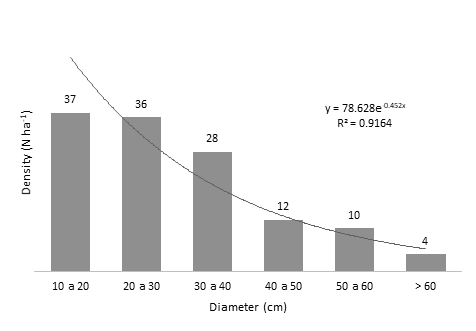
Figure 1 Diametric category distribution in a Pinus-Quercus forest in the la Sierra Madre del Sur, Guerrero, Mexico.
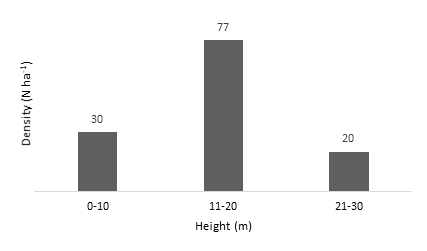
Figure 2 Height class distribution in a Pinus-Quercus forest in the la Sierra Madre del Sur, Guerrero, Mexico.
For the vertical structural diversity of the species, three strata were determined: high (III), from 23 to 28 m; medium (II), from 15 to 22 m and low (I), from 5 to 14 m. Of the three strata, the highest species density was found in the low, with 50.4 % of the individuals (127 N ha-1), of which Pinus oocarpa contributed 102 N ha-1. In the middle stratum, 41.7 % of the total individuals were concentrated, represented by Quercus crassifolia, Quercus rugosa, Pinus maximinoi and Pinus oocarpa with 86 N ha-1 (81.1 %) (Figure 3).
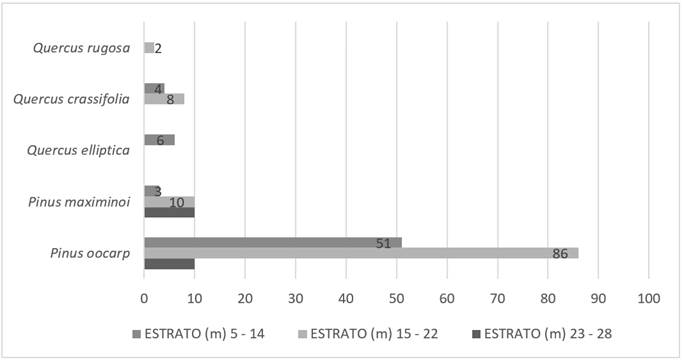
The result obtained for the Pretzsch index was A = 2.07 with an Amax = 2.70, which indicates that the distribution of species is highly represented by the low stratum (I) with a higher proportion of trees between 5 and 14 m, which decreases slightly as the height increases in the next stratum (II). The high stratum (III) has a low relative density (7.8 %), and is made up of two species (Pinus oocarpa and Pinus maximinoi). These results coincide with those of Rubio et al. (2014), who also recorded a high presence of trees in the lower stratum and low representativeness of the upper stratum (Table 4).
Conclusions
According to the results of the present investigation, it is concluded that the studied plant community gathers few species (5 species) and a low diversity, which is related to the high density of Pinus and Quercus, which generates a projection of greater than 100 %.
This community presents a state of active regeneration, since of the three vertical strata defined, the best represented is the lower one, which confirms the largest number of individuals of low bearing and in the lower diameter categories (10 to 30 cm) a numerous population and few specimens with diameters above 40 cm.
Acknowledgements
To the authorities of the ejido of Atoyaquillo in Coyuca de Benítez, especially to Don Carmelo Bernal for the support and facilities granted to carry out field work. To the colleagues Erick Naranjo, Tatiana Niño, Marta Rojnik, Carlos Valdes, Lourdes Pedroza, Abel Martínez and Michel Martínez for the support in gathering of data at the field and their support at the office. To the field brigades for the support and support in the data collection in the field, especially Ángel, Artemio, Esteban and Silvestre.
REFERENCES
Alanís, E., J. Jiménez, D. Espinoza, E. Jurado, O. A. Aguirre y M. A. González. 2008. Evaluación del estrato arbóreo en un área restaurada post-incendio en el Parque Ecológico Chipinque, México. Revista Chapingo Serie Ciencias Forestales y del Ambiente 14(2):113-118. [ Links ]
Alanís, E. , J. Jiménez , M. Pando, O. A. Aguirre, E. J. Treviño y P. C. García. 2010. Efecto de la restauración ecológica post-incendio en la diversidad arbórea del Parque Ecológico Chipinque, México. Madera y Bosques 16(4):39-54. [ Links ]
Alanís, E. , J. Jiménez , A. Valdecantos, M. Pando, O. A. Aguirre y E. J. Treviño. 2011. Caracterización de regeneración leñosa post-incendio de un ecosistema templado del Parque Ecológico Chipinque, México. Revista Chapingo. Serie Ciencias Forestales y del Ambiente 17(1):31-39. [ Links ]
Castellanos, J. F, E. J. Treviño, O. A. Aguirre, J. Jiménez y A. Velázquez 2010. Diversidad arbórea y estructura espacial de bosques de pino-encino en Ixtlán de Juárez, Oaxaca. Revista Mexicana de Ciencias Forestales 1(2):29-52. [ Links ]
Del Río, M., F. Montes, I. Cañellas y G. Montero. 2003. Revisión: Índices de diversidad estructural en masas forestales. Investigaciones Agrarias: Sistemas de Recursos Forestales 12(1):159-176. [ Links ]
Delgado D., A., S. A. Heynes, M. D. Mares, N. L. Piedra, F. I. Renata, K. Rodríguez, A. I. Villanueva, M. S. González y L. Ruacho. 2016. Diversidad y estructura arbórea de dos rodales en Pueblo Nuevo, Durango. Revista Mexicana de Ciencias Forestales 7(33):94-107. DOI: 10.29298/rmcf.v7i33.92 [ Links ]
Franklin, J. F., T. A. Spies, R. Van Pelt, A. B. Carey, D. A. Thornburgh, D. R. Berg, D. B. Lindenmayer, M. E. Harmon, W. S. Keeton, D. C. Shaw, K. Bible and J. Chen. 2002. Disturbances and structural development of natural forest ecosystems with silvicultural implications, using Douglas-fir forest as an example. Forest Ecology and Management 155(1):399-423. [ Links ]
Gadow, K. V., O. S. Sánchez y J. G. Álvarez. 2007. Estructura y Crecimiento del Bosque. Universidad de Göttingen. Göttingen Alemania. 287 p. [ Links ]
Graciano, G., O. A. Aguirre, E. Alanís y J. E. Lujan. 2017. Composición, estructura y diversidad de especies arbóreas en un bosque templado del Noreste de México. Ecosistemas y Recursos Agropecuarios 4(12):535-542. [ Links ]
Hernández, J., O. A. Aguirre, E. Alanís, J. Jiménez y M. A. González. 2013. Efecto del manejo forestal en la diversidad y composición arbórea de un bosque templado del noroeste de México. Revista Chapingo serie Ciencias Forestales y del Ambiente 19(3):189-199. [ Links ]
Instituto Nacional de Estadística y Geografía (Inegi). 2002. Coyuca de Benítez Guerrero: Cuaderno estadístico municipal 2001. Aguascalientes, Ags., México. 39 p. [ Links ]
Jiménez, J., O. A. Aguirre y H. Kramer. 2001. Análisis de la estructura horizontal y vertical en un ecosistema multicohortal de pino - encino en el Norte de México. Investigaciones Agrarias, Sistema de Recursos Forestales 10(2):356-366. [ Links ]
Juárez S., M., P. A. Domínguez-Calleros y J. Návar-Chaidez. 2014. Análisis de la estructura silvícola en bosques de la Sierra de San Carlos, Tamaulipas, Mexico. Foresta Veracruzana 16(1):25-34. [ Links ]
López J., A., O. A. Aguirre, E. Alanís, J. C. Monarrez, M. A. González y J. Jiménez. 2017. Composición y diversidad de especies forestales en bosques templados de Puebla, México. Madera y Bosques 23(1): 39-51. [ Links ]
Magurran, A. 2004. Measuring Biological Diversity. Blackwell Science Ldt. Blackwell Publishing Company. Oxford, UK. 256 p. [ Links ]
Margalef, R. 1951. Diversidad de especies en las comunidades naturales. Publicación del Instituto Biología Aplicada. Barcelona, España 9:5-27. [ Links ]
McRoberts, R. E., E. O. Tomppo y E. L. Czaplewski. 2015. Diseños de muestreo de las evaluaciones forestales nacionales. SLU. 1. FAO. Roma, Italia. 21p. [ Links ]
Méndez, C., E. Alanís, J. Jiménez, O. A. Aguirre y E.J. Treviño. 2014. Análisis de la regeneración postincendio en un bosque de pino-encino de la Sierra de Guerrero, México. Ciencia UANL 17(69):63-70. [ Links ]
Mora, C. A. y E. Alanís. 2016. Resiliencia de bosques de pino-encino en América: Una visión global del estado actual. Revista Forestal Mesoamericana KURÚ 13(36):1-2. [ Links ]
Mostacedo, B. y T.S. Fredericksen. 2000. Manual de métodos básicos de muestreo y análisis en ecología vegetal. Editora El País. Santa Cruz, Bolivia. 87p. [ Links ]
Ozdemir, I., K. Ozkan, A. Mert, U.Y., Ozkan, O. Senturk and O. Alkan. 2012. Mapping forest stand structural diversity using Rapideye satellite data. Recuperado de Recuperado de http://congrexprojects.com/docs/12c04_docs2/poster2_6_ozdemir.pdf (13 de septiembre de 2017). [ Links ]
Pretzsch, H. 2009. Forest Dynamics, Growth and Yield. From Measurement to Model. Springer-Verlag. Berlín Heidelberg, Alemania. 664p. [ Links ]
Rubio E., A., M. A. González, J. Jiménez, O. A. Aguirre, D. Y. Ávila y E. Alanís. 2014. Diversidad y distribución vertical de especies mediante el índice de Pretzsch. Ciencia UANL 17(65):34-41. [ Links ]
Rubio E. , A., M. A. González, W. Himmelsbach, D. Y. Ávila, E. Alanís y J. Jiménez. 2017. Patrones de distribución espacial del arbolado en un bosque mixto de pino - encino del Noreste de México. Revista Mexicana de Biodiversidad 88:113-121. [ Links ]
Sánchez, J., P. A. Domínguez y J. Návar. 2014. Análisis de la estructura silvícola en bosques de la Sierra de San Carlos, Tamaulipas, México. Foresta Veracruzana . 16(1):25-34. [ Links ]
Saravanan, S., K. Ravichandran, A. Balasubramanian and K. Paneerselvam. 2013. Structure and floristic composition of tree diversity in Andaman tropical evergreen forest of middle Andaman, India. Indian Journal of Forestry 36(2):167-171. [ Links ]
Seppelt, R., C. F. Dormann, F.V. Eppink, S. Lautenbach and J.S. Schmidt. 2011. A quantitative review of ecosystem service studies: approaches, shortcomings and the road ahead. Journal of Applied Ecology 48:630-636. [ Links ]
Shannon, C. 1948. The mathematical theory of communication. En: The mathematical theory of communication. In: Shannon, C. E. and W. Weaver (ed.). University of Illinois Press Urbana. Champaign, IL, USA. pp. 29-125. [ Links ]
Torres L., M., J. A. Sánchez y J. Jiménez. 2006. Análisis estructural de un ecosistema forestal de Pinus - Quercus en la Sierra Madre Oriental. Revista Ciencia Forestal en México 31(100):7-30. [ Links ]
Zacarías, L. E., G. Cornejo, J. Cortés, N. González y G. Ibarra. 2011. Composición, estructura y diversidad del cerro El Águila, Michoacán, México. Revista Mexicana de Biodiversidad 82(3):854-869. [ Links ]
Received: March 15, 2018; Accepted: October 08, 2018
 Este es un artículo publicado en acceso abierto bajo una licencia Creative Commons
