


Serviços Personalizados
Journal
Artigo
 texto em
  Inglês (pdf)
 Artigo em XML
 Referências do artigo
 Enviar este artigo por email
Indicadores
-
 Citado por SciELO
 -
 Acessos
Links relacionados
-
 Similares em
SciELO
Similares em
SciELO
Compartilhar

 Permalink
Revista mexicana de ciencias forestales
versão impressa ISSN 2007-1132
Rev. mex. de cienc. forestales vol.9 no.49 México Set./Out. 2018
https://doi.org/10.29298/rmcf.v9i49.153
Articles
Physicochemical characterization of a Calcisol under different land -use systems in Northeastern Mexico
1Facultad de Ciencias Forestales, Universidad Autónoma de Nuevo León. México.
Changes in land use cause variations in the physicochemical characteristics of soil. The present study aims to quantify the changes in the physicochemical characteristics of a Calcisol in three land uses in the Northeast of Mexico: Native Vegetation Area (AVN), Cropland Area (AA) and Pasture Area (ASP). Four composite soil samples were taken at 0-5 and 5-30 cm depth from each land- use plot. The variables bulk density, texture, mechanical resistance to penetration, organic matter, pH and electric conductivity were determined. The analysis of variance showed differences in the organic matter with values of 4.2 % for AVN, 2.08 % for ASP and 1.19 % and for AA in the depth 0-5 cm. The texture was clay loam for AA, silty loam for ASP and loam for AVN showing differences. The soil under the three types of land -use presented low salinity (70.2 to 396.0 μS cm-1) showing differences at both depths. The soil hardness showed differences (p≤0.05) between plots. The AA showed lower values (0.78 kg cm-2), contrasting with the values obtained for ASP (2.98 kg cm-2) and AVN (3.10 kg cm-2). The pH and bulk density did not show. On the other hand, the decrease of the soil’s organic carbon in the first 5 cm depth was up to 71.6 % when cultivating an area over a period of 60 years that was originally a thornscrub. Furthermore, the abandonment of the cropland for the establishment of a grazing system for 15 years led to a re-accumulation of organic matter up to 21.2 %.
Key words: Calcisol; physicochemical characteristics; organic matter; Tamaulipan thornscrub; Northeastern Mexico; land -use systems
Los cambios en el uso del suelo provocan variaciones en sus características fisicoquímicas. El objetivo del presente estudio fue cuantificar dichos cambios de un Calcisol en tres tipos de uso de suelo: Área de Vegetación Nativa (AVN), Área Agrícola (AA) y Área Sometida a Pastoreo (ASP). Se tomaron cuatro muestras compuestas de suelo a 0-5 y 5-30 cm de profundidad para cada tipo de uso. Se determinaron las variables: densidad aparente, textura, resistencia mecánica a la penetración, materia orgánica, pH y conductividad eléctrica. Los análisis de varianza mostraron diferencias en la materia orgánica con valores de 4.2 % para AVN, 2.08 % para ASP y 1.19 % para AA en la profundidad 0-5 cm. La textura fue arcillo-limoso para AA, franco- arcillosa para ASP y franco para AVN, con diferencias. Los tres tipos de uso tienen escasa salinidad (70.2 a 396.0 μS cm-1), y confirman diferencias en ambas profundidades. La resistencia mecánica a la penetración mostró diferencias (p≤0.05) entre los usos del suelo; AA registró 0.78 kg cm-2 ASP 2.98 kg cm-2 y AVN 3.10 kg cm-2. En este contexto, el pH y la densidad aparente no tuvieron diferencias. La disminución del carbono orgánico del suelo en los primeros 5 cm de profundidad fue de 71.6 % después de cultivar un área por 60 años que originalmente fue matorral. Además, el abandono del cultivo para establecer un sistema de pastoreo por 15 años condujo a una re-acumulación de la materia orgánica de hasta un 21.2 %.
Palabras clave: Calcisol; características fisicoquímicas; materia orgánica; matorral espinoso tamaulipeco; noreste de México; sistema de uso de suelo
Introduction
Soils provide multiple ecosystem services as physical and infrastructure support for agriculture, forestry, recreational and agricultural activities, and socioeconomic as housing, industry and roads; they are the habitat of thousands of organisms and the scenario where biogeochemical cycles occur (Volke et al., 2005; Smith et al., 2016).
Soil degradation is a process that decreases the capacity and potential to produce goods and services quantitatively and qualitatively (García et al., 2012). In Mexico, 24 % of soil degradation results from deforestation and land use change (Sánchez-Castillo et al., 2014), which reduces the current and potential production of ecosystems (Celaya et al., 2015).
At present, the Secretaría de Medio Ambiente y Recursos Naturales (Department of the Environment and Natural Resources) reports for the national territory that the main causes of soil degradation are agricultural activities (17.44 %), overgrazing (17.45 %), deforestation and removal of vegetation (7.38 %), urbanization (1.45 %), overexploitation of vegetation for domestic use (1.07 %), and industrial activities (0.23 %) (Semarnat, 2013). In the state of Nuevo León, the land use change is one of the critical factors that affect the sustainability of natural resources since it is estimated that, of the total forest area of 2 708 104 ha, 16 010 ha year-1 are deforested at 0.6 % annual rate (Céspedes and Moreno, 2010).
The productive capacity of a soil is determined by intrinsic properties such as texture and structure, while others, such as pH and organic matter, can be manipulated by management (Mishra and Sharma, 2010). Land use change radically alters vegetation cover even in a short time, and transforms the physical, chemical and microbial properties of the soil; in addition, it causes carbon loss due to direct or indirect human disturbance to varying degrees, which is an important global change factor (Smith et al., 2016).
Soil organic matter plays an important role in the maintenance of fertility, by retaining and transferring nutrients to plants (Álvarez et al., 2012); it is a key indicator of soil quality, both in its agricultural functions (production and economy) and in its environmental functions. In addition, it is considered the main determinant of the biological activity of soil and nutrient source (Cantú and Yáñez, 2017). It affects other soil properties (Murray et al., 2014) and their functions, including water retention (Carter, 2002), air infiltration, water infiltration (Hillel, 2004) and aggregate stability (Six et al., 2004); modifies the porosity and capacity of available water (Darwish et al., 1995).
In particular, Soils of the Calcisol type (IUSS, 2015) are of great value for the Northeast of Mexico and particularly in the Linares region, NL, since they have a wide distribution in the arid zones of the state since they cover 50.50 % (32 707 km -2) of its territory (Semarnat, 2002a). Calcisols are soils in which there is a substantial accumulation of secondary lime and extend into arid and semi-arid environments, often associated with parental materials with a high calcareous content (Akça et al., 2018).
From the above considerations, the objective of this study was to evaluate the effect of land use changes on the physical and chemical properties of a Calcisol under three different land use systems.
Materials and Methods
Study area
The study area is located in three adjoining properties belonging to the ejido Gatos Güeros in Linares municipality, Nuevo León, between 25°07'55.2" N and 99°18'59.1" W, with an altitude of 225 m (Figure 1). The selected properties are located in the Subprovince of Llanuras y Lomeríos (Plains and Hills) whose name comes from the presence of plains interrupted by scattered hills, low slopes and soft conglomerates. The type of climate is BS1 (h') semi-dry very warm-warm, with average annual rainfall of 600-700 mm, average annual temperature of 22.4 °C and that of the coldest month is greater than 18 °C; summer rains and the percentage of winter rain is from 5 % to 10.2 % of the annual total (García, 1981).

Vegetation is represented by the Tamaulipan Thorn Scrub, which is composed of dense and very diverse vegetation of shrub and tree plants, which are distinguished by a wide range of taxonomic groups with differences in growth habits, leaf longevity and phenology (González et al., 2007). In the Subprovince, clear soils are predominant, that are classified like luvic, calcic and haplic Calcisols; these soils are present in all topoform systems but especially in the great alluvial plain (Inegi, 1986). Calcisols are soils in which there is a substantial secondary accumulation of calcareous matter and they are found in arid and semi-arid environments, often associated with parental materials of this kind (IUSS, 2015).
Land use systems and experimental plots
In the research site, three experimental plots with different soil uses were selected to evaluate soil texture, pH, bulk density, mechanical resistance to penetration, electrical conductivity, organic matter and organic carbon.
The first use of the soil, which corresponds to the plot of the Native Vegetation Area (AVN), contains native vegetation (Tamaulipan Thorny Scrub) dominated by bushes, dense and thorny, with a wide range of growth patterns, diverse life times of the leaves, textures and contrasting growth dynamics, as well as its taxonomy and phenology. This system has more than 100 years without human intervention.
The second land use is an Agricultural Area (AA); with seasonal maize cultivation in which only yunta is used and conservation agriculture practices are implemented; the plot is 60 years old.
The third land use was called the Grazing Area (ASP); corresponds to a production system with intensive livestock and grassland rotation and approximately 15 years ago it was changed from a temporary agricultural plot to Buffel grass (Cenchrus ciliaris Fig. & De Not.), Pretoria grass (Dichanthium annulatum (Forssk.) Stapf.) and African Star grass (Cynodon nlemfuensis Vanderyst).
The type of soil in the three land use systems investigated is Calcisol, of the Luvic Calcisol type according to the World Reference Base for Soil Resources Classification (IUSS, 2015).
Soil sampling
In January 2017, four composite samples were collected at two depths (0-5 and 5-30 cm.), with four subsamples each until obtaining approximately 1 kg of soil. Sampling was randomized in each of the three land use systems: Native Vegetation Area (AVN), Agriculture Area (AA) and Grazing Area (ASP). The samples (n = 24) were taken to the Laboratorio de Suelos y Nutrición de bosques de la Facultad de Ciencias Forestales de la Universidad Autónoma de Nuevo León (Laboratory of Soils and Nutrition in the School of Forest Sciences of the Autonomous University of Nuevo Leon), where they were dried in the shade at room temperature, they were screened with 0.2 mm mesh and prepared for chemical analysis.
Physicochemical characterization of the soil
Soil characterization was based on the measurement of the following variables: organic matter (OM) was determined by the modified Walkley /Black method (Woerner, 1989). A wet digestion was carried out with concentrated sulfuric acid (H2SO4) and carbon oxidation with 0.07M potassium dichromate (K2Cr2O7), added to 0.5 g of soil, 25 mL of K2Cr2O7 and 25 mL H2SO4 and titration of excess dichromate with ferrous sulphate 0.2M (FeSO4 7H20). With this procedure, the content of organic matter and organic carbon of the soil (OC) was obtained under the assumption that the former contains 58 % carbon (Castellanos et al., 2000). The soil reaction (pH) was measured by the AS-23 method of NOM-021-RECNAT-2000 (Semarnat, 2002b), by means of the soil suspension: CaCl2 0.01 M at a 1: 2 ratio, through an electrode of glass. Electric conductivity (EC) by rapid determination in soil-water suspension 1: 5 (Woerner, 1989), both pH and EC were recorded in a Corning pH conductivity meter, model 542. Soil texture was defined by the procedure of Bouyoucos by the AS-09 method of NOM-021-RECNAT-2000 (Semarnat, 2002b). The bulk density (DA) by the cylinder method (Woerner, 1989) and the mechanical measurement resistance to penetration (MRP) (kg cm-2) was assessed with a soil hardness meter Yamanaka type penetrometer (Tada, 1987).
Statistical analysis
The variables of interest were analyzed statistically in a completely randomized design with factorial arrangement, by land uses (A, 3) and depth (B, 2) with four replications. Normal tests of Kolmogorov-Smirnov and homocedasticity of Levene were performed (Sokal and Rohlf, 2003).
The original variables for pH, apparent density and mechanical resistance to penetration were used and the variables of clay, silt to square root and the variables organic matter, organic carbon and electrical conductivity were transformed to natural logarithm. The mean comparison was made with the Tukey test (p≤0.05) and the original variables were handled for the Spearman correlation analysis. All the statistical analyzes were carried out with the computer package Statistical Package for the Social Sciences, version 13.0 for Windows (SPSS, 2013).
Results and Discussion
The results obtained for the variables OM, OC, pH, EC, BD, PRM, sand, silt and clay, analyzed in the 0-5 and 5-30 cm depths in the three systems of land use are presented in tables 1 and 2. In the depth pertaining to the organic horizon, OM and OC recorded the highest values in the different land uses, in contrast higher values of pH and EC were observed in the 5-30 cm depth.
Table 1 Mean values in the 0-5 cm soil depth (n = 4), for the variables used in the three land use systems.
| Use | Mean | Median | SD | Min | Max | |
|---|---|---|---|---|---|---|
| OM | Grassland (ASP) | 2.08 | 2.03 | 0.281 | 1.80 | 2.47 |
| (%) | Scrubland (AVN) | 4.20 | 3.91 | 2.54 | 1.72 | 7.28 |
| Agriculture (AA) | 1.19 | 1.13 | 0.221 | 0.99 | 1.50 | |
| OC | Grassland (ASP) | 1.21 | 1.18 | 0.163 | 1.04 | 1.43 |
| (%) | Scrubland (AVN) | 2.43 | 2.27 | 1.473 | 1.00 | 4.22 |
| Agriculture (AA) | 0.69 | 0.65 | 0.128 | 0.58 | 0.87 | |
| pH | Grassland (ASP) | 7.60 | 7.55 | 0.141 | 7.50 | 7.80 |
| Scrubland (AVN) | 7.30 | 7.45 | 0.483 | 6.60 | 7.70 | |
| Agriculture (AA) | 7.73 | 7.75 | 0.096 | 7.60 | 7.80 | |
| EC | Grassland (ASP) | 116.73 | 115.65 | 14.990 | 103.30 | 132.30 |
| (μS cm-1) | Scrubland (AVN) | 80.10 | 77.84 | 12.726 | 68.8 | 96.10 |
| Agriculture (AA) | 79.70 | 80.05 | 8.180 | 70.2 | 88.50 | |
| BD | Grassland (ASP) | 1.32 | 1.32 | 0.078 | 1.23 | 1.38 |
| (g cm-3) | Scrubland (AVN) | 1.24 | 1.21 | 0.079 | 1.19 | 1.36 |
| Agriculture (AA) | 1.27 | 1.26 | 0.021 | 1.25 | 1.29 | |
| MRP | Grassland (ASP) | 2.98 | 2.95 | 0.818 | 2.00 | 4.00 |
| (kg cm-2) | Scrubland (AVN) | 3.10 | 3.00 | 0.663 | 2.40 | 4.00 |
| Agriculture (AA) | 0.78 | 0.80 | 0.222 | 0.50 | 1.00 | |
| Sand | Grassland (ASP) | 14.04 | 16.04 | 4.000 | 8.04 | 16.04 |
| (%) | Scrubland (AVN) | 31.94 | 21.76 | 30.900 | 7.48 | 76.76 |
| Agriculture (AA) | 9.84 | 12.32 | 6.214 | 0.68 | 14.04 | |
| Silt | Grassland (ASP) | 67.50 | 66.00 | 4.435 | 64.00 | 74.00 |
| (%) | Scrubland (AVN) | 47.96 | 56.00 | 23.650 | 13.28 | 66.56 |
| Agriculture (AA) | 54.72 | 54.72 | 3.651 | 50.72 | 58.72 | |
| Clay | Grassland (ASP) | 18.46 | 17.96 | 1.000 | 17.96 | 19.96 |
| (%) | Scrubland (AVN) | 20.10 | 21.60 | 8.089 | 9.96 | 27.24 |
| Agriculture (AA) | 35.78 | 35.96 | 7.022 | 27.24 | 43.96 |
OM = Organic matter; OC = Organic carbon; pH = Hydrogen potential; EC = Electrical conductivity; DA = Bulk density; MRP = Soil hardness; SD = Standard deviation.
Table 2 Mean values in the 5-30 cm soil depth (n=4), for the variables used in the three land use systems.
| Use | Mean | Median | SD | Min | Max | |
|---|---|---|---|---|---|---|
| OM | Grassland (ASP) | 0.87 | 0.87 | 0.125 | 0.70 | 0.99 |
| (%) | Scrubland (AVN) | 1.11 | 1.10 | 0.334 | 0.81 | 1.42 |
| Agriculture (AA) | 0.90 | 0.97 | 0.178 | 0.64 | 1.02 | |
| OC | Grassland (ASP) | 0.50 | 0.51 | 0.072 | 0.41 | 0.58 |
| (%) | Scrubland (AVN) | 0.64 | 0.64 | 0.194 | 0.47 | 0.83 |
| Agriculture (AA) | 0.52 | 0.56 | 0.103 | 0.37 | 0.59 | |
| pH | Grassland (ASP) | 8.05 | 8.05 | 0.129 | 7.90 | 8.20 |
| Scrubland (AVN) | 7.75 | 7.65 | 0.238 | 7.60 | 8.10 | |
| Agriculture (AA) | 7.78 | 7.80 | 0.050 | 7.70 | 7.80 | |
| EC | Grassland (ASP) | 255.63 | 254.50 | 14.720 | 239.50 | 274.00 |
| (μS cm-1) | Scrubland (AVN) | 155.80 | 76.30 | 160.140 | 74.60 | 396.00 |
| Agriculture (AA) | 73.48 | 68.75 | 13.910 | 62.70 | 93.70 | |
| Sand | Grassland (ASP) | 9.04 | 8.04 | 3.464 | 6.04 | 14.04 |
| (%) | Scrubland (AVN) | 24.76 | 24.76 | 1.633 | 22.76 | 26.76 |
| Agriculture (AA) | 6.32 | 6.32 | 2.582 | 3.32 | 9.32 | |
| Silt | Grassland (ASP) | 72.50 | 75.00 | 5.745 | 64.00 | 76.00 |
| (%) | Scrubland (AVN) | 48.32 | 48.00 | 8.320 | 39.28 | 58.00 |
| Agriculture (AA) | 45.04 | 45.72 | 3.180 | 40.72 | 48.00 | |
| Clay | Grassland (ASP) | 18.46 | 17.96 | 2.517 | 15.96 | 21.96 |
| (%) | Scrubland (AVN) | 26.92 | 27.24 | 6.850 | 19.24 | 33.96 |
| Agriculture (AA) | 48.64 | 48.96 | 1.611 | 46.68 | 49.96 |
OM = Organic matter; OC = Organic carbon; pH = Hydrogen potential; EC = Electric conductivity; SD = Standard deviation
The highest contents of OM and OC were located in the scrub area (AVN) in the depth 0-5 cm with average values of 4.2 and 2.43 %, respectively, which corresponds to a soil with high content (Woerner, 1989). On the contrary, the agriculture area (AA) recorded the lowest figures in the same depth (OM 1.19 % and OC 0.69 %), with a carbon content valued as low, a decrease that can be attributed to the processes associated with the same agricultural practices. Aghasi et al. (2010) concluded that changes in land use decrease the quality of the soil substrate and increase its degradation, by reducing the return of organic matter.
The BD values varied from 1.19 to 1.38 g cm-3, among which the grazing area (ASP) had the highest average (1.32 g cm-3), while the scrub (AVN), the lowest average (1.24 g cm-3). This could be explained by grazing management practices, which compact the soil by trampling cattle.
The most outstanding results of mechanical resistance to penetration were for AVN (2.98 kg cm-2) and ASP (3.10 kg cm-2), and the opposite for AA (0.78 kg cm-2).
The order of the OM and RMP content for the different types of land use in the depth of 0-5 cm was as follows: Scrubland> Grassland> Agriculture. For the 5-30 cm depth, the order of OM content was as follows: Scrubland> Agriculture> Grassland. The values of the BD for the different types of land use were in the following order: Grassland> Agriculture> Scrubland.
The results obtained from the physicochemical analysis were subjected to analysis of variance (ANOVA) and Tukey tests (confidence coefficients α = 0.05) by which pH, electric conductivity, organic matter, organic carbon and granulometric fractions (sands, silts and clays) at depths of 0-5 and 5-30 cm were compared.
Through the analysis of variance, significant differences were found for all the studied variables for the land use factor (FA), except for pH; for the depth factor (FB) sand and silt were the only variables that did not have differences; and only OM and OC had them for the interaction (FA * FB) (Table 3).
Table 3 Analysis of variance for the model with two classification criteria, (land use and soil depth) and Levene's contrast for pH, electric conductivity (EC), organic matter (OM), organic carbon (OC), sand, clay and silt.
| Variables |
FA(a) Factor |
FB(b) Factor |
Interaction (FA*FB) |
Levene’s test(c) | Adjusted R2 |
|---|---|---|---|---|---|
| pH | 3.458 NS | 10.670** | 1.892 NS | 0.035 | 0.416 |
| EC | 11.113** | 5.894* | 3.005NS | 0.002 | 0.559 |
| OM | 8.084** | 35.020** | 4.146* | 0.000 | 0.703 |
| OC | 8.085** | 35.023** | 4.16* | 0.000 | 0.703 |
| Sand | 7.724** | 0.804NS | 0.809NS | 0.044 | 0.332 |
| Clay | 34.120** | 6.755* | 1.838NS | 0.004 | 0.762 |
| Silt | 6.816** | 0.018NS | 0.746NS | 0.004 | 0.306 |
FA(a) = Land use; FB(b) = Soil depth; Levene(c) = Variance homogeneity test. *Significant differences (p ≤0.05); **Highly significant differences (p≤0.01); NS = Non-significant.
Organic matter
The Tukey test for OM showed only differences for the 0-5 cm depth, in the scrub and grassing land in particular, where the highest content is recorded; in contrast, the opposite happened in the agricultural system (Figure 2). In a Vertisol under three forms of land use (scrub, agriculture and secondary vegetation), Llorente (2004) identified that OC was different between the systems only for the first 20 cm depth, but was the same for the subsequent ones up to 70 cm. Their results also confirm that shrub concentrates the highest OC content and that agriculture, the lowest. In Turkey, Gol (2009) concluded that the conversion of natural forest to continuous cultivation caused statistically significant decrease in the OM content.
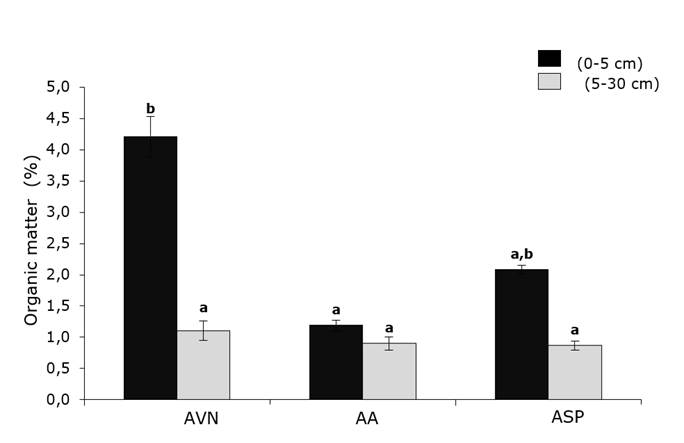
Means with different letters at the same depth are statistically different (Tukey p ≤ 0.05).
Figure 2 Mean values of soil organic matter content (%) at 0-5 and 5-30 cm depths for all three types of land use systems.
There are significant differences between the types of land use in the content of organic matter and organic carbon for the 0-5 cm depth, but values are higher in AVN (4.20 and 2.43 %), compared to those of AA (1.19 and 0.69 %). The maximum accumulation of organic matter was in the 0-5 cm depth in AVN and ASP, with a tendency to decrease as depth increases. This difference in the distribution of organic matter in these two systems is mainly due to the fact that in AVN the contribution of natural materials occurs on the surface of the soil in the form of leaf litter, branches and other structures; while in the ASP the contribution of organic matter is produced from the roots of grasses within the upper part of the soil as rhizogenic humus (Baldock and Nelson, 2000).
The rate of reduction of organic matter when cultivating an area depends fundamentally on the intensity of the management and the edaphic and climatic characteristics; the highest reduction rate occurs in the first 5 to 10 years (Llorente, 2004). It was estimated that the decrease of OM in the 0-5 cm depth was 71.6 %; if these lands were cultivated for 60 years, and that originally it was scrub, on the one hand, and that the 15 years ago ASP was cultivated, it is feasible that a process of reaccumulation of organic matter has occurred, as it is proposed in Johnson’s model (1995). In the 0-5 cm depth of ASP, a recovery of 21.2 % of OM and OC was estimated over a 15 year-period (2.08 and 1.21 %, respectively). In contrast, for the 5-30 cm depth, no reaccumulation occurred but instead a 2.7 % loss of both during the same period took place.
The decrease in OM was lower (20 %) for both types of land use change (agriculture or grazing land) for the 5-30 cm depth. These results agree with those of Chandran (2009), who estimated that 20 to 40 % of organic matter is lost when the lands with native vegetation are converted into cropland; likewise, Llorente (2004) calculated 37 % of organic carbon that is lost when cultivating the soil that was previously occupied by submontane scrub. Cantú and Yáñez (2017) recorded OC losses from 2.5 % in grasslands to 65 % in the agriculture area with respect to scrub vegetation for Vertisol soils. These losses are caused mainly by tillage and by the small amount of waste that is reincorporated into the soil.
pH and Electric Conductivity
pH and electric conductivity are indicators of the quality of the soil and of multiple chemical, physical and biological properties that influence its fertility (Castellanos et al., 2000). In general, soils with pH in a range of 5.8 to 7.5 are considered as desirable or less problematic for most crops (Rodríguez and Rodríguez, 2002). The Calcisol registered averages of 7.3 to 8.0 with respect to the soil reaction (pH), which classifies it as moderately alkaline. The ANOVA for pH did not reveal differences between land use (FA); only for FB = depth, significant differences were confirmed (p≤0.01), and an increase of pH in the 5-30 cm depth for the three systems of land use; there are no significant differences in the FA * FB interaction (Table 3).
EC is very important since it is related to the absorption of nutriments (Salcedo et al., 2014). The results obtained in the analysis of this variable showed significant differences for FA = land use (p≤0.01) and the FB = depth (p≤0.05); in contrast, there were no significant differences in the interaction of FA * FB (p> 0.05) (Table 3). The comparison of means for electric conductivity (EC) for each system of land use is illustrated in Figure 3. EC varied from 79.7 to 116.7.0 μS cm-1 for the 0-5 cm depth; the values of the three types of land use presented a classification of low salinity, which suggests that there is no crop restriction, and there is no presence of salts that exert a negative impact on productivity (Figure 3).
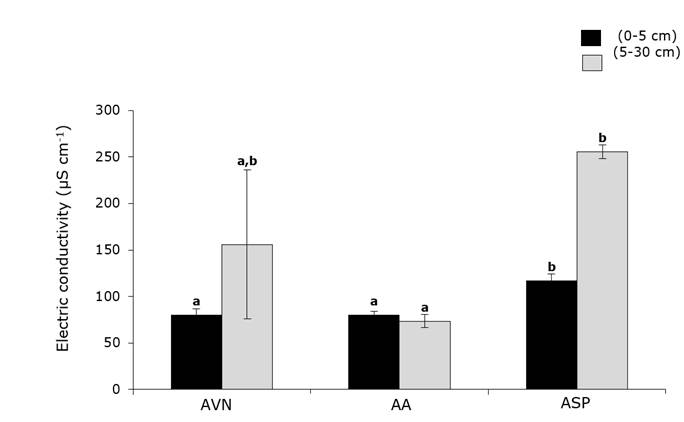
Means with different letters at the same depth are statistically different (Tukey p ≤ 0.05).
Figure 3 Mean values of the soil electric conductivity at 0-5 and 5-30 cm depths for the three types of land use.
In the AVN and ASP plots, a significant increase in electric conductivity was recorded with values of 155.8 and 255.6 μS cm-1, respectively at 5-30 cm, while in the AA they were 73.4 μS cm-1 for the same depth. The highest number of the two areas mentioned above may be due to the presence of feces of cattle in the ASP and the high content of organic matter in AVN; on the other hand, the area with the lowest numbers, AA, has no fertilizer or chemical product at all.
Apparent density and mechanical resistance to penetration
The simple ANOVA for BD showed no significant differences between the systems of land use, and the opposite occurred in the RMP (p ≤ 0.05). The first ranged from 1.24 to 1.32 g cm-3, while the RMP ranges ranged between 0.78 and 3.1 kg cm-2 (Figure 4). Fernández et al. (2016), identified differences in bulk density between forests and other kinds of land use, and attributed the low content of organic matter to the greatest depth. Generally, an excessive compaction of the soil causes a decrease in the land quality by reducing the macroporosity of the soil and the amount of water and nutriments that are available for the plant roots of, which hinders its growth.
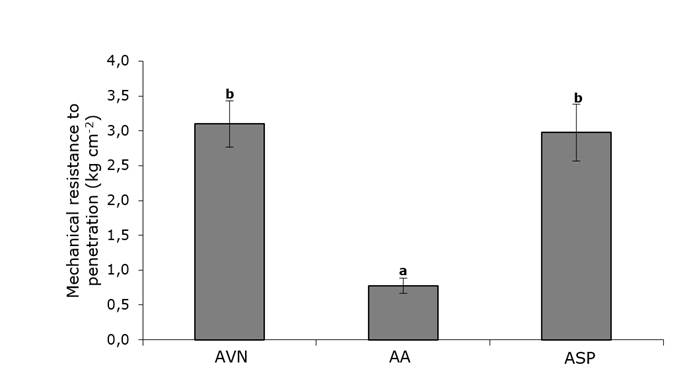
Means with different letters at the same depth are statistically different (Tukey p ≤ 0.05).
Figure 4 Mean values of mechanical resistance to penetration for the kinds of land use: AVN, AA and ASP.
However, according to the evaluations proposed by Woerner (1989), calcic soils show a very low level of compaction, due to the good state of conservation, the absence of trampling of cattle in scrub and the contribution of organic matter.
The highest average values of mechanical resistance to penetration are concentrated in ASP and AVN with values of 3.10 kg cm-2 and 2.98 kg cm-2, respectively. It should be noted that AA had the lowest depressed figures (0.78 kg cm-2), with a ratio of almost 4 to 1 with respect to the other kinds of land use. These values can be explained, mainly in the case of ASP, by the trampling of the animals and in the agricultural area (AA), by the constant clearing of the land with yoke for sowing. Mogollón (2012), in his study in La Sabana de Bogotá, observed critical compaction values of 20.3 kg cm-2 in the first 9 cm of depth due to animal walking; the lower values of 18.5 kg cm-2 in the first 30 cm of depth were due to the preparation labors for sowing, which break the compacted structures, and thus, diminish the mechanical resistance to penetration and bulk density.
Texture
The results of the ANOVA of the percentage variables of sand, clay and silt presented significant differences for the factor: FA = land use (p≤0.01), while in the FB factor = depth, only the clay registered significant differences (p < 0.05), and the interaction of both FA * FB factors (p> 0.05), did not show significant differences (Table 3). The results of the Tukey test (p <0.05) for each texture fraction at two depths are illustrated in Figure 5. Sand and silt only showed differences between uses for the 5-30 cm depth, where sand was the fraction with the highest content in AVN and for ASP the lime was the fraction with the highest and different contents from the other types of use.
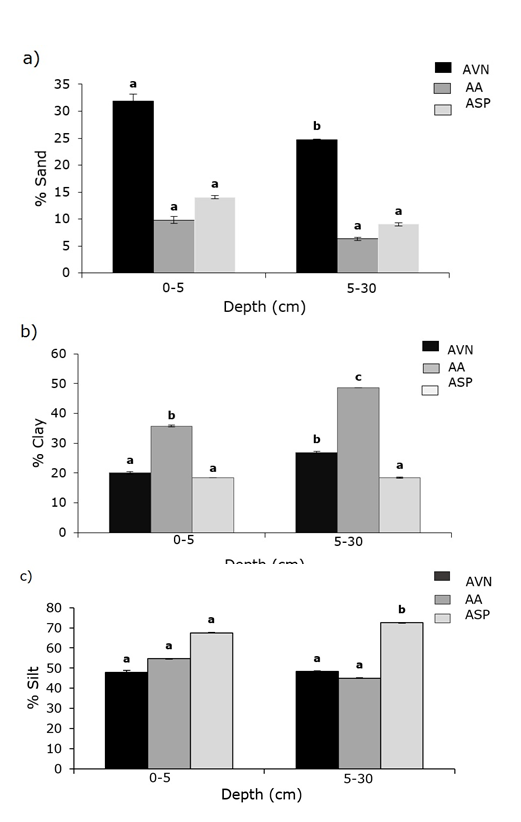
Means with different letters at the same depth are statistically different (Tukey p ≤ 0.05).
Figure 5 Mean values (%) of a) sand, b) clay and c) silt at 0-5 and 5-30 cm depths for AVN, AA and ASP.
Regarding clay, differences are recognized in both soil depths; AA stands out for the highest content in both, while ASP values are the lowest. With the triangle of textures proposed by the International Society of Soil Science (ISSS) (Mathieu and Pieltain, 1998), it was determined that the soil for the depth 0-5 cm is of the loam type (C) for the AVN, clay silt loam (Crl) for AA and silty loam (Cl) for ASP; in depth 5-30 cm was loam type (C) for AVN, for AA silty clay (Rl) and for ASP silty loam (Cl).
The granulometric analysis for both depths allowed to determine the values as: very high in the proportion of silts (from 45 to 72.5 %), high in the clay (18.4 to 48.6 %) and low for the sand (6.3 to 31.9 %). The obtained numbers agree with what was consigned by Miralles (2006), since for the profiles of Calcisol type franc clay and sandy loam textures were distinguished, mainly, and to a lesser extent franc and silty loam textures.
Some studies show that the use or management of the soil does not cause an alteration to the ecosystems in the proportion of mineral particles (Cruz-Ruiz et al., 2012). However, it is observed that in the trawl in the most superficial layers of the soil (0-5 cm) of the Calcisol there is a greater proportion of sands, probably due to the water drag of the finer fractions of the soil from the upper layers, in an eluvial process and the iluviation of these clays at greater depth.
Yüksek et al. (2010) identify significant differences in the contents of sand, silt and clays in different systems of use with respect to a natural forest in Turkey.
Dieckow et al. (2009) mention that soil texture plays an important role in the reduction of carbon stores after the conversion of native vegetation to conventional farmland; it is less adverse in clay soils than in sandy soils, due to the interaction with the surface (organ-mineral interaction) and the physical protection of the internal aggregates.
Table 4 shows the results of the correlation analysis for the 0-5 cm depth. The electric conductivity had a positive and highly significant correlation with the silt content (r = 0.768). Organic matter registered significance in both positive and negative correlations with organic carbon (r = 1.000), clay content (r = -0.832), bulk density (r = -0.594) and mechanical resistance to penetration (r = 0.660). Likewise, sand had a negative and significant correlation with clay (r = -0.661). The pH, clay, silt and BD did not define any correlation for the 0-5 cm depth.
Table 4 Spearman correlation coefficients for the studied variables (n = 12) for 0-5 cm depth.
| Variable | pH | EC | OM | OC | AR | ARC | LI | BD | MRP |
|---|---|---|---|---|---|---|---|---|---|
| pH | - | ||||||||
| EC | -0.128 | - | |||||||
| OM | -0.491 | 0.154 | - | ||||||
| OC | -0.491 | 0.154 | 1.000** | - | |||||
| AR | -0.308 | -1.20 | 3.80 | 0.380 | - | ||||
| ARC | 0.390 | -1.59 | -0.832** | -0.832** | 0.661* | - | |||
| LI | -0.121 | 0.768** | 0.291 | 0.291 | -0.392 | -0.186 | - | ||
| BD | 0.171 | 0.448 | -0.594* | -0.594* | -0.245 | 0.374 | 0.77 | - | |
| MRP | -0.492 | 0.328 | 0.660* | 0.660* | -0.380 | -0.546 | 0.512 | -0.226 | - |
Bold numbers indicate significant differences (**) p≤0.01, (*) p ≤0.05.
pH = Potential hydrogen; EC = Electric conductivity; OM = Organic matter; OC = Organic carbon; AR = Sand; ARC = Clay; LI = Silt; BD = Bulk density; MRP = Mechanical resistance to penetration.
The results of the correlation analysis for the 5-30 cm depth indicate that electric conductivity was negatively correlated with the clays (r = -0.625) and positively with the pH (r = 0.588). Also, the correlation between clay and silt was negative (r = -0.838). Likewise, no correlation was detected with the sand (Table 5).
Table 5 Spearman correlation coefficients for the variables studied (n = 12) for the 5-30 cm depth.
| Variable | pH | CE | OM | OC | AR | ARC | LI |
|---|---|---|---|---|---|---|---|
| pH | - | ||||||
| EC | 0.588* | - | |||||
| OM | 0.044 | 0.260 | - | ||||
| OC | 0.044 | 0.260 | 1.000** | - | |||
| AR | -0.204 | 0.253 | 0.146 | 0.146 | - | ||
| ARC | -0.346 | -0.625* | 0.213 | 0.213 | -0.153 | - | |
| LI | 0.298 | 0.417 | -0.216 | -0.216 | -0.325 | -0.838** | - |
Bold numbers indicate significant differences (**) p≤0.01, (*) p ≤0.05.
pH = Potential hydrogen; EC = Electric conductivity; OM = Organic matter; OC = Organic carbon; AR = Sand; ARC = Clay; LI = Silt
Conclusions
The decrease in OM due to changes in the use of the scrubland to another system of use has a wide range of variation in the shallowest depth, and it is the agricultural system that has the greatest loss of this component. The ASP system has a reaccumulation of more than 20 % MO in the depth 0-5 cm, while at greater depth there is a loss below 3 %.
The values of the apparent density for the different land uses are arranged in the following sequence: Pasture> Agricultural> Scrub and the RMP is almost four times higher in ANV and ASP in relation to AA. The pH increases in the greater depth in the three systems of land use, and the Electrical Conductivity only in the AVN and ASP in this context.
Changes in land use influence the variables of organic matter, electrical conductivity, mechanical resistance to penetration and texture in calcisols, of which, the agricultural system has lower contents of organic matter, higher clay content and lower values of mechanical resistance to penetration and electrical conductivity than the rest of the land use systems. In this way, in Calcisol soils, the management practices of both agriculture and livestock affect their physical and chemical properties.
Acknowledgements
The authors wish to express their gratitude to the Universidad Autónoma de Nuevo León (PAICYT CT263-15 project) for their support to carry on this research study. Also, to the two anonymous technical reviewers for improving this paper by making critical observations.
REFERENCES
Aghasi, B., A. Jalalian and N. Honarjoo. 2010. The comparison of some soil quality indexes in different land uses of Ghareh Aghaj watershed of semirom, Isfahan, Iran. International Scholarly and Scientific Research & Innovation 4(11): 528-532. [ Links ]
Akça, E., S. Aydemir, S. Kadir, M. Eren, C. Zucca, H. Günal, F. Previtali, P. Zdruli, A. Çilek, M. Budak, A. Karakeçe, S. Kapur and E. A. FitzPatrick. 2018. Calcisols and Leptosols. In: S. Kapur, H. Günal and E. Akça (eds). The soil of Turkey. Springer International Publishing AG. World Soils Book Series Cham. Cham, Switzerland. pp. 139-167. [ Links ]
Álvarez A., G., A. Ibáñez H., N. E. García C. y G. Almendros M. 2012. Almacenes de carbono y estabilidad de la materia orgánica del suelo en un agroecosistema cafetalero en la sierra sur de Oaxaca, México. Tropical and Subtropical Agroecosystems 15:611-620. [ Links ]
Baldock, J. A. and P. N. Nelson. 2000. Soil organic matter. Handbook of Soil Science. CRC Press. Boca Raton, FL USA. pp. 25-27. [ Links ]
Cantú S., I. y M. I. Yáñez D. 2017. Efecto del cambio de uso de suelo en el contenido del carbono orgánico y nitrógeno del suelo. Revista Mexicana de Ciencias Forestales 9(45):122-151. [ Links ]
Castellanos, J. Z., J. X. Uvalle B. y A. Aguilar S. 2000. Manual de interpretación de análisis de suelos y aguas (2a edición), Instituto de Capacitación para la Productividad Agrícola. San Miguel Allende, Gto., México. 226 p. [ Links ]
Carter, M. R. 2002. Soil quality for sustainable land management. Agronomy Journal 9 4: 38-47. [ Links ]
Céspedes F., S. E. y E. Moreno S. 2010. Estimación del valor de la pérdida de recurso forestal y su relación con la reforestación en las entidades federativas de México. Investigación Ambiental 2(2): 5-13. [ Links ]
Celaya M., H., F. García O., J. C. Rodríguez y A. E. Castellanos V. 2015. Cambios en el almacenamiento de nitrógeno y agua en el suelo de un matorral desértico transformado a sabana de buffel (Pennisetum ciliare (L) Link). Terra Latinoamericana 33:79 -93. [ Links ]
Chandran, P., S. K. Ray, S. L. Durge, P. Raja, A. M. Nimkar, T. Bhattacharyyal and D. K. Pal. 2009. Scope of horticultural land use system in enhancing carbon sequestration in ferruginous soils of the semi-arid tropics. Current Science 97:1039-1046. [ Links ]
Cruz-Ruiz, E., A. Cruz-Ruiz., L. I. Aguilera-Gómez, H. T. Norman-Mondragón, R. A. Velázquez, G. Nava-Bernal, L. Dendooven y B. G. Reyes-Reyes. 2012. Efecto en las características edáficas de un bosque templado por el cambio de uso de suelo. Terra Latinoamericana 30(2): 189-197. [ Links ]
Darwish, O. H., N. Persaud and D. C. Martens. 1995. Effect of long-term application of animal manure on physical properties of three soil. Plant Soil 176: 289-295. [ Links ]
Dieckow J., C. Bayer, P. C. Conceicao, J. A. Zanatta, L. Martin N., D. B. M. Milori, J. C. Salton, M. M. Macedo, J. Mielniczur and L. C. Hernani. 2009. Land use, tillage, texture and organic matter srock and composition in tropical and subtropical Brazilian soils. European Journal of Soil Science 60: 240-249. doi: 10.1111/j.1365-2389.2008.01101.x. [ Links ]
Fernández O., P. R., D. C. Acevedo, A. Villanueva M. y M. Uribe G. 2016. Estado de los elementos químicos esenciales en suelos de los sistemas natural, agroforestal y monocultivo. Revista Mexicana de Ciencias Forestales 7(35): 65-77. [ Links ]
García, E. 1981. Modificación al sistema de clasificación climática de Köppen para adaptarlo a las condiciones de la república mexicana. Instituto de Geografía. Universidad Nacional Autónoma de México. México, D. F., México. 252 p. [ Links ]
García O., J. A., J. G. Gastón C., J. I. Juan P. y M. A. Balderas P. 2012. Procesos de cambio en el uso de suelo de una microcuenca en el altiplano mexicano. El caso del río San José en el Estado de México. Papeles de Geografía 55-56:63-73. [ Links ]
Gol, C. 2009. The effects of land use change on soil properties and organic carbon at Dagdami river catchment in Turkey. Journal of Environmental Biology 30: 825-830. [ Links ]
González R., H., I. Cantú S., M. V. Gómez M., R. G. Ramírez L. y J. I. Uvalle S. 2007. Producción de hojarasca y reciclado de nutrientes en el Matorral Espinoso Tamaulipeco en el Noreste de México. http://www.iufro.org/uploads/media/t3-gonzalez-humberto-et-al.doc (24 de junio del 2017). [ Links ]
Hillel, D. 2004. Encyclopedia of soils in the environment. Elsevier. London, UK. Vol. 4. pp. 295-303. [ Links ]
Instituto Nacional de Estadística Geográfica e Informática (INEGI). 1986. Síntesis geográfica del Estado de Nuevo León. México, D.F., México. 171 p. [ Links ]
International Union of Soil Sciences (IUSS). 2015. Base referencial mundial del recurso suelo 2014, Actualización 2015. Sistema internacional de clasificación de suelos para la nomenclatura de suelos y la creación de leyendas de mapas de suelos. Working Group WRB Informes sobre recursos mundiales de suelos 106. FAO. Roma, Italia. 206 p. [ Links ]
Johnson, M. G. 1995. The role of soil management in sequestering soil carbon. Soil Management and Greenhouse Effect. Lewis Publishers. Boca Raton, FL USA. pp. 351-363. [ Links ]
Llorente, M. 2004. Caracterización física y química de vertisoles del noreste de México sometidos a distintas formas de manejo. Tesis Maestría en Ciencias Forestales, Facultad de Ciencias Forestales, Universidad Autónoma de Nuevo León. Linares, NL., México. 98 p. [ Links ]
Mathieu, C. et F. Pieltain. 1998. Analyse physique des sols. Lavoisier. Paris, France. 275 p. [ Links ]
Mishra, A. and S. D. Sharma. 2010. Influence of forest tree species on reclamation of semiarid sodic soils. Soil Use and Management 26(4):445-454. [ Links ]
Miralles M., I. 2006. Calidad de suelos en ambientes calizos mediterráneos: Parque Natural de Sierra María-Los Vélez. Tesis de Doctorado. Facultad de Farmacia Departamento de Edafología y Química Agrícola. Universidad de Granada. Granada, España. 578 p. [ Links ]
Mogollón L., M. R. 2012. Comportamiento espacial de la resistencia mecánica a la penetración y su relación con propiedades físicas del suelo en áreas con diferentes usos y ocupaciones en la sabana de Bogotá. Tesis de Maestría. Facultad de Ingeniería. Universidad Nacional de Colombia, Bogotá, Colombia. 125 p. [ Links ]
Murray, R. M., M. G. Orozco, A. Hernández, C. Lemus y O. Nájera. 2014. El sistema agroforestal modifica el contenido de materia orgánica y las propiedades físicas del suelo. Avances de Investigación Agropecuaria 18: 23-31. [ Links ]
Rodríguez H., F. y J. Rodríguez A. 2002. Métodos de análisis de suelos y plantas. Criterios de interpretación. Editorial Trillas. México, D. F., México. 196 p. [ Links ]
Salcedo P., E., A. L. Ypushima P., R. González C., J. F. Zamora N., R. Rodríguez M. y R. Sánchez H. 2014. Efecto de las propiedades edáficas y el contenido nutrimental foliar sobre el crecimiento de teca. Revista Mexicana de Ciencias Forestales 5(24): 80-90. [ Links ]
Sánchez-Castillo, L., T. Kubota and I. Cantú S. 2014. Root strength characteristics of understory vegetation species for erosion 445 mitigation on forest slopes of Mexico. International Journal of Ecology & Development 28(2): 1-8. [ Links ]
Secretaría de Medio Ambiente y Recursos Naturales (Semarnat). 2002a. Inventario Nacional de Suelos. México, 2002, con base en información de Semarnap y Colegio de Postgraduados- Inegi, México. http://www.paot.org.mx/centro/ine-semarnat/informe02/estadisticas_2000/compendio_2000/03dim_ambiental/03_03_Suelos/data_suelos/CuadroIII.3.1.2_b.htm (25 de noviembre de 2017). [ Links ]
Secretaría de Medio Ambiente y Recursos Naturales (Semarnat). 2002b. Norma Oficial Mexicana NOM-021-RECNAT-2000. Establece las especificaciones de fertilidad, salinidad y clasificación de suelos. Estudios, muestreos y análisis. Diario Oficial de la Federación. 31 de diciembre de 2002. Segunda edición. México, D F., México. 85 p. [ Links ]
Secretaría de Medio Ambiente y Recursos Naturales (Semarnat). 2013. Informe de la situación del medio ambiente en México. Compendio de estadísticas ambientales. Indicadores clave y de desempeño ambiental Edición 2012. México, D.F. 262 p. http://apps1.semarnat.gob.mx/dgeia/informe_12/pdf/Informe_2012.pdf (25 de noviembre de 2017). [ Links ]
Six, J., H. Bossuyt, S. D. Degryze and K. Denef. 2004. A history of research on the link between (micro) aggregates, soil biota, and soil organic matter dynamics. Soil Tillage Research 79 : 7-31. [ Links ]
Smith, P., J. I. House, M. Bustamante, J. Sobocká, R. Harper, G. Pan, P. C. West, J. M. Clark, T. Adhya, C. Rumpel, K. Paustian, P. Kuikman, M. F. Cotrufo, J. A. Elliott, R. Mcdowell , R. I. Griffiths, S. Asakawa, A. Bondeau, A. K. Jain, J. Meersmans and T. A. M. Pugh. 2016. Global change pressures on soils from land use and management. Global Change Biology 22:1008-1028. [ Links ]
Sokal, R. R. and F. J. Rohlf. 2003. Biometry the principles and practice of statistics in biological research. 3rd Edition. W. H. Freeman and Company. New York,NY USA. 887 p. [ Links ]
Statistical Package for the Social Sciences (SPSS). 2013. SPSS Statistics. Standard released Version. 22.0. for Windows. SPSS Inc. Chicago, IL USA. n/p. [ Links ]
Tada, A. 1987. Bearing capacity. In: Physical measurement in flooded rice soils: The Japanese methodologies. Chapter9 . International Rice Research Institute. Manila, Philippines. pp. 54-61. [ Links ]
Volke S., T., J. A. Velasco T. y D. A. de la Rosa P. 2005. Suelos contaminados por metales y metaloides: muestreo y alternativas para su remediación. Secretaria de Medio Ambiente y Recursos Naturales. Instituto Nacional de Ecología. México, D. F., México. 144 p. [ Links ]
Yüksek T., O. Kurdoglu and F. Yüksek. 2010. The effects of land use changes and management types on surface soil properties in Kafkasör protected area in Artvin, Turkey. Land Degradation & Development 21: 582-590. [ Links ]
Woerner, M. 1989. Métodos químicos para el análisis de suelos calizos de zonas áridas y semiáridas. Departamento Agroforestal, Facultad Ciencias Forestales. Universidad Autónoma de Nuevo León. Linares, NL, México.105 p. [ Links ]
Received: December 11, 2017; Accepted: July 24, 2018
 Este es un artículo publicado en acceso abierto bajo una licencia Creative Commons
