


Serviços Personalizados
Journal
Artigo
 texto em
  Inglês (pdf)
 Artigo em XML
 Referências do artigo
 Enviar este artigo por email
Indicadores
-
 Citado por SciELO
 -
 Acessos
Links relacionados
-
 Similares em
SciELO
Similares em
SciELO
Compartilhar

 Permalink
Revista mexicana de ciencias forestales
versão impressa ISSN 2007-1132
Rev. mex. de cienc. forestales vol.9 no.49 México Set./Out. 2018
https://doi.org/10.29298/rmcf.v9i49.185
Articles
Dynamic site index models for four pine species in Oaxaca
1Doctorado Institucional en Ciencias Agropecuarias y Forestales, Universidad Juárez del Estado de Durango. México.
2Instituto de Estudios Ambientales-División de Estudios de Postgrado. Universidad de la Sierra Juárez. México.
3Instituto Tecnológico de El Salto. México.
4Campo Experimental Valle del Guadiana. Instituto Nacional de Investigaciones Forestales Agrícolas y Pecuarias. México.
5Facultad de Ciencias Forestales. Universidad Juárez del Estado de Durango. México.
Los modelos de índice de sitio representan una herramienta silvícola muy importante para clasificar la productividad de los bosques. El objetivo de este trabajo fue desarrollar ecuaciones dinámicas de índice de sitio derivadas, mediante el método de Diferencias Algebraicas Generalizadas (GADA), para cuatro especies de pino en la Sierra Norte del estado de Oaxaca, México. Para el ajuste de las ecuaciones se utilizaron datos de análisis de tronco de árboles de Pinus oaxacana, P. douglasiana, P. patula y P. pseudostrobus. Los árboles se seleccionaron en rodales mixtos e irregulares, intentando cubrir las diferentes calidades de estación presentes en las áreas sujetas a manejo forestal en los bosques de la Unidad de Manejo Forestal Regional 2001. Los ajustes se realizaron con el método iterativo y una estructura de error autoregresiva de tiempo continuo de segundo orden (CAR2), para corregir la autocorrelación del término del error. Los resultados indicaron que la formulación GADA del modelo de Bertalanffy-Richards puede ser utilizada para describir con precisión el índice de sitio de las cuatro especies estudiadas. La función desarrollada es polimórfica, dinámica, invariable con la edad de referencia y tiene múltiples asíntotas. El modelo genera, para las cuatro especies, estimaciones compatibles de índice de sitio y de altura dominante.
Palabras clave: Altura dominante; curvas de índice de sitio; ecuación dinámica; edad de referencia; GADA; modelo de Bertalanffy-Richards
Site index models represent an important tool to classify forest productivity. The goal of this research was to develop dynamic site equations derived with the Generalized Algebraic Difference approach (GADA) for four pine species growing in the Northern Sierra of Oaxaca, Mexico. Data from stem analyses of Pinus oaxacana, P. douglasiana, P. patula and P. pseudostrobus trees were used to fit the equations. The trees were selected in mixed and irregular stands, trying to cover the different sites qualities present in the areas subject to forest management in the forests of the Unidad de Manejo Forestal Regional 2001(Regional Forest Management Unit 2001).The models were fitted through the iterative procedure, utilizing a second-order autoregressive error structure (CAR2) to correct for the serial correlation of term of error. The results indicated that the GADA formulation from the Bertalanffy-Richards equation can be used for accurately describing the site index for the four species studied. This function is polymorphic, dynamic and invariant with the reference age, with multiple asymptotes. It provides compatible site index and dominant height growth estimates for the four species.
Key words: Dominant height; site index curves; dynamic equation; reference age; GADA; Bertalanffy-Richards equation
Introduction
The productive capacity of a forest stand is defined by the tree species or group of species and by the biotic and abiotic factors that interact with the environment; therefore, the growth and production of timber in forest stands are determined by age distribution, the innate productive capacity supported by a given area, and its degree of utilization, as well as by the forestry treatments applied (Clutter et al., 1983; Torres and Magaña, 2001; Diéguez-Aranda et al., 2009).
The modern quantitative tools can be utilized to optimize the planning, follow-up and control of sustainable forest management, as they contribute to determine the rotation age, the silvicultural interventions and the timber harvest as accurately as possible. Thus, mathematical models make it possible to infer the biological behavior of individual trees or stands for the planning of forest management scenarios based on prediction and projection models (Quiñonez-Barraza et al., 2015).
The ratio of dominant height to age makes it possible to implicitly estimate the site index (SI), defined as the value of the dominant height of a given species at a reference base age (Clutter et al., 1983); the latter is generally related to biological rotation ages in stands under forest management. A family of site index curves (also called site quality curves or productivity curves) is a set of curves that shows the dominant height growth pattern that will be followed through time by the stands of a particular species and a particular geographical area (Rennolls, 1978; Bengoa, 1999), each of which is associated to an Arabic number that identifies it (site index value), or, simply, to the SI value. In turn, the intermediate lines between quality curves delimit strips called quality classes.
The curves are anamorphic or polymorphic, and their equations are generated using the algebraic difference approach (ADA) (Baily and Clutter, 1974), or else, the families of curves with asymptotic polymorphism combining the growth rates with the potentiality of the site and obtained using the generalized algebraic difference approach (GADA) (Cieszewski and Bailey, 2000; Cieszewski, 2002; Cieszewski, 2003). This dynamic equations fitting method makes it possible for the variation in the instant growth rates of each curve and the potentiality of the site to be considered in a base equation; this is ideal for prescribing forestry treatments in stands, according to their productive potential (Santiago-García et al., 2013).
In the forests of the Unidad de Manejo Forestal Regional 2001 (Regional Forest Management Unit 2001) (Umafor) in Oaxaca, Mexico, there are few site index equations for the species of the Pinus genus that can be used as biometric tools for planning and implementing sustainable forest management. The objective of this work was to develop dynamic site index models for Pinus oaxacana Mirov, P. douglasiana Martínez, P. patula Schiede ex Schltdl. & Cham. and P. pseudostrobus Lindl. in the Northern Sierra of Oaxaca, using the GADA methodology.
Materials and Methods
Study area
The study was carried out in the stands under forest management at Umafor 2001, in the northeast of the state of Oaxaca, Mexico, which cover an area of 195 397 ha. The study area is located at the coordinates 17°22’58” N and 96°22’29” W (Figure 1). The altitude of the sampling areas varies from 1 800 to 3 361 m. The annual temperature ranges between -3 °C and 28 °C, with a mean annual precipitation of 3 797 mm (Granados-Sánchez, 2009). The predominant vegetation type corresponds to pine-oak forests, with Pinus oaxacana, P. douglasiana, P. patula, P. pseudostrobus, P. leiophylla Schiede ex Schltdl. & Cham., P. pringlei Shaw., P. rudis Endl., P. teocote Schiede ex Schltdl. & Cham., Quercus crassifolia Bonpl., Q. laurina Bonpl. and Q. rugosa Née as the main dominant species.

Data
The dynamic SI and dominant height equations were fitted using a database of 206 tree stem analyses of 44 specimens of Pinus oaxacana, 45 of P. douglasiana, 58 of P. patula, and 59 of P. pseudostrobus. The individuals were felled at a stump height that ranged from 0.1 m to 0.25 m, so that the first section corresponded to the stump height, the second to a height of 1.3 m, and subsequently, every 2.54 m, up to the tip of the tree. The specimens were selected from mixed stands, and an attempt was made to cover the various site qualities, as well as the diameter categories present in the areas under forest management. Although the concept of site index is designed for coetaneous and pure stands (Daniel et al., 1979), the dominant character for a tree implies that these individuals have little sensitivity to the effect of the density, the competition and the mix of species, as its height remains constant within a broad interval of densities and degrees of mingling, which reflects the productive potential of a particular site throughout its life, and therefore the concept has been extended to mixed pine stands (Corral et al., 2004; Vargas-Larreta, 2010; Castillo et al., 2013).
Table 1 shows the descriptive statistics of the database; as it may be observed, the sample covers a broad interval of age-dominant height combinations, and therefore it is regarded as adequate for the fitting of the dynamic growth equations.
Table 1 Descriptive statistics of the age and dominant height data, by species, of the sample utilized to fitting the dynamic site index equations.
| Code | Species | Trees | n | Age (years) |
Dominant height (m) |
||||||
|---|---|---|---|---|---|---|---|---|---|---|---|
| Min. | Max. | Mean | SD. | Min. | Max. | Mean | SD | ||||
| Po | Pinus oaxacana Mirov | 44 | 563 | 2 | 66 | 21.8 | 13.7 | 0.1 | 36.1 | 13.5 | 9.2 |
| Pd | Pinus douglasiana Martínez | 45 | 638 | 2 | 126 | 36.2 | 24.1 | 0.1 | 38.8 | 15.3 | 9.9 |
| Pp | Pinus patula Schiede ex Schltdl. & Cham. | 58 | 804 | 2 | 87 | 27.3 | 19.1 | 0.1 | 43.7 | 15.4 | 10.6 |
| Pps | Pinus pseudostrobus Lindl. | 59 | 811 | 2 | 90 | 29.0 | 20.5 | 0.1 | 39.5 | 15.2 | 10.3 |
| Total | 206 | 2816 | 2 | 126 | 28.7 | 20.4 | 0.1 | 43.7 | 15.0 | 10.1 | |
n = Number of pairs of dominant height - age; Min. = Minimum value; Max. = Maximum value; SD = Standard deviation.
The true heights of the sections were estimated using Carmean’s method (1972) modified by Newberry (1991), as it has exhibited good results in other researches (Dyer and Bailey, 1987; Fabbio et al., 1994; Castillo et al., 2013). The method is based on two assumptions: i) between two sections, the tree grows at a constant rate, and ii) in average, the tree is cut at the growth core, at a one-year height (Dyer and Bailey, 1987; Amaral et al., 2010). The equations used to estimate the true height vary according to the tree section (equations 1-3).
Where:
H 1 and H 2 = Heights of the lower and upper sections of the log
N 1 and N 2 = Number of rings of the lower and upper sections of the log
N 0 = Age of the tree, i.e. number of rings of the stump (in stump N 0 = N 1 )
T 0 = Age of the tree when it reached the height H1; i.e. N 0 - N 1
T = Whole number from 1 to N 1 - N 2
Dynamic site index equations
The GADA method was used to fit three equations, which have been documented in various studies in order to describe the growth in dominant height and site index: Korf (4), Hossfeld (5) and Bertalanffy-Richards (6) (Cieszewski, 2002; Castillo et al., 2013; Quiñonez-Barraza et al., 2015; González et al., 2016). Table 2 shows the expression of the base model, as well as their GADA formulation.
Table 2 Dynamic site index equations assessed in this study.
| Baseequation | Site parameters | Solution for |
GADA´s formulation | Equation |
|---|---|---|---|---|
|
|
|
|
|
(4) |
|
|
|
|
|
(5) |
|
|
|
Donde: |
|
(6) |
H = Dominant height; t = Age in years;
Description of the GADA method
The development of any dynamic equation using the GADA formulation considers: i) selecting a base equation and identifying the number of parameters that will be dependent on the productivity of the site; ii) the selected parameters are expressed as functions of the site quality defined by variable X 0 (unobservable, independent variable describing the productivity of the site, as a result of the sum of the ecological and climatic factors, management regimes, soil conditions and the new parameters; iii) the selected bi-dimensional base equation (H=f(t)) is expanded to a tri-dimensional site index equation (H=f(t, X 0 )), and iv) the value of X 0 is solved in terms of the baseline conditions of the site, i.e. of the baseline dominant height values - age (t 0 , H 0 ), so that the model can be implicitly defined and applied in practice (H=f(t, t 0 , H 0 )) (Cieszewski and Bailey, 2000; Cieszewski, 2001; Cieszewski, 2002; Cieszewski, 2003). In the course of the process, redundant parameters are often eliminated, and a model with an equal or lower number of parameters to that of the original base equation is obtained.
Fitting method and statistics for the comparison between models
The global and site-specific parameters were estimated using the nested iterative procedure (Tait et al., 1988; Cieszewski, 2003; Krumland and Eng, 2005), which is utilized with databases derived from tree stem analyses or permanent sampling plots. The models were fitted with a continuous-time autoregressive error structure (CARi), in order to correct potential autocorrelation problems of the term of error (Zimmerman et al., 2001; Nord-Larsen, 2006; Crecente-Campo et al., 2009) and obtain unbiased, efficient parameter estimators (Parresol and Vissage, 1998).
Where:
The goodness-of-fit of the models was determined based on the results of quantitative analyses, such as the root mean square error (RMSE), the adjusted coefficient of determination (R 2 adj ), the mean bias (e) and the residuals graphs for comparing the following aspects: i) the biological behavior of the predictions of the various fitted models; ii) the representation of the residuals versus the values predicted by the model, and iii) the representation of the residuals versus residuals with various lags, in order to verify the correction of the autocorrelation of the errors by modeling the error structure (Goelz and Burk, 1992; Sharma et al., 2011). The presence of autocorrelation in the utilized data was calculated with the Durbin-Watson statistic (Durbin and Watson, 1951). The expressions of these statistics are:
Where:
n = Number of observations
p = Number of parameters of the model
e = Residual value of the fitted model
The simultaneous fitting of growth and error structure equations (CAR2) was carried out with the MODEL procedure of the SAS/ETSTM statistical package (SAS, 2004), which allows a dynamic updating of the residuals in the fitting procedure.
Results and Discussion
GADA equations generated without considering the error structure
The estimated parameters, the standard errors and the fitting statistics of the dynamic equations analyzed for Pinus oaxacana, P. douglasiana, P. patula and P. pseudostrobus were obtained for all the pairs of dominant height - age, with the fit of equations 4, 5 and 6, without considering the modeling of the error structure (Table 3). The results evidence autocorrelation problems of the residues, due to height measurements in the same tree (Figure 4).
Table 3 Estimated parameters and fitting statistics of the equations fitted without considering the modeling of the autocorrelation.
| Species | Equation | Parameter | Estimated value |
SE | T-value | P-value |
RMSE (m) |
R 2 adj | DW |
|---|---|---|---|---|---|---|---|---|---|
| Po | 4 | b 1 | -9.9723 | 6.2560 | -1.59 | 0.1115 | 1.23 | 0.98 | 0.73 |
| b 2 | 107.1878 | 27.0767 | 3.96 | <0.0001 | |||||
| b 3 | 0.7720 | 0.0268 | 28.76 | <0.0001 | |||||
| 5 | b 1 | 10.3192 | 4.3182 | 2.39 | 0.0172 | 1.22 | 0.98 | 0.70 | |
| b 2 | 19 712.5600 | 3 295.9000 | 5.98 | <0.0001 | |||||
| b 3 | 1.9817 | 0.0357 | 55.56 | <0.0001 | |||||
| 6 | b 1 | 0.0546 | 0.0016 | 33.54 | <0.0001 | 1.24 | 0.98 | 0.71 | |
| b 2 | -1.0411 | 0.5854 | -1.78 | 0.0759 | |||||
| b 3 | 11.9310 | 2.1632 | 5.52 | <0.0001 | |||||
| Pd | 4 | b 1 | -24.6624 | 4.8423 | -5.09 | <0.0001 | 1.24 | 0.98 | 0.62 |
| b 2 | 165.1131 | 21.2032 | 7.79 | <0.0001 | |||||
| b 3 | 0.6067 | 0.0246 | 24.64 | <0.0001 | |||||
| 5 | b 1 | 20.4518 | 2.3387 | 8.74 | <0.0001 | 1.19 | 0.98 | 0.64 | |
| b 2 | 11 664.3400 | 1 459.4000 | 7.99 | <0.0001 | |||||
| b 3 | 1.6595 | 0.0292 | 56.74 | <0.0001 | |||||
| 6 | b 1 | 0.0300 | 0.0010 | 29.98 | <0.0001 | 1.18 | 0.99 | 0.65 | |
| b 2 | -1.8106 | 0.2727 | -6.64 | <0.0001 | |||||
| b 3 | 12.8909 | 1.0198 | 12.64 | <0.0001 | |||||
| Pp | 4 | b 1 | -762.5240 | 289.6000 | -2.63 | 0.0086 | 1.77 | 0.97 | 0.61 |
| b 2 | 3 227.2260 | 1 191.2000 | 2.71 | 0.0069 | |||||
| b 3 | 0.8459 | 0.0268 | 31.52 | <0.0001 | |||||
| 5 | b 1 | 40.5627 | 0.8353 | 48.56 | <0.0001 | 1.74 | 0.97 | 0.59 | |
| b 2 | 718.3985 | 491.1000 | 1.46 | 0.1439 | |||||
| b 3 | 2.0036 | 0.0329 | 60.96 | <0.0001 | |||||
| 6 | b 1 | 0.0447 | 0.0014 | 30.95 | <0.0001 | 1.85 | 0.97 | 0.56 | |
| b 2 | -9.4612 | 1.0574 | -8.95 | <0.0001 | |||||
| b 3 | 42.7925 | 3.9189 | 10.92 | <0.0001 | |||||
| Pps | 4 | b 1 | -23.2364 | 5.8717 | -3.96 | <0.0001 | 1.49 | 0.98 | 0.61 |
| b 2 | 163.9336 | 25.7222 | 6.37 | <0.0001 | |||||
| b 3 | 0.6937 | 0.0228 | 30.38 | <0.0001 | |||||
| 5 | b 1 | 26.7838 | 2.0150 | 13.29 | <0.0001 | 1.47 | 0.98 | 0.62 | |
| b 2 | 10 535.2800 | 1 554.6000 | 6.78 | <0.0001 | |||||
| b 3 | 1.8045 | 0.0297 | 60.82 | <0.0001 | |||||
| 6 | b 1 | 0.0368 | 0.0011 | 32.21 | <0.0001 | 1.51 | 0.98 | 0.60 | |
| b 2 | -0.7945 | 0.3176 | -2.50 | 0.0126 | |||||
| b 3 | 10.0448 | 1.2201 | 8.23 | <0.0001 |
SE = Standard error of the parameter estimator; RMSE = Root mean square error; R 2 adj = Adjusted coefficient of determination; DW = Durbin-Watson statistic; Po= Pinus oaxacana; Pd = Pinus douglasiana; Pp = Pinus patula; Pps = Pinus pseudostrobus.
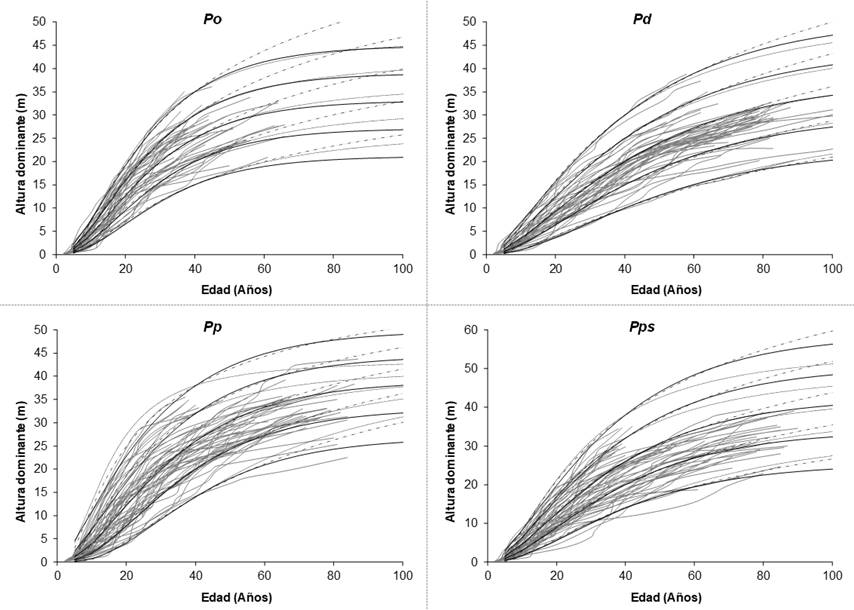
Altura dominante = Dominant height; Edad(años) = Age(years).
Figure 2 Overlapping of SI curves generated using the Korf (discontinuous line), Hosffeld (dotted line) and Bertalanffy-Richards (continuous line) models.
Altura dominante = Dominant height; Edad(años) = Age(years).
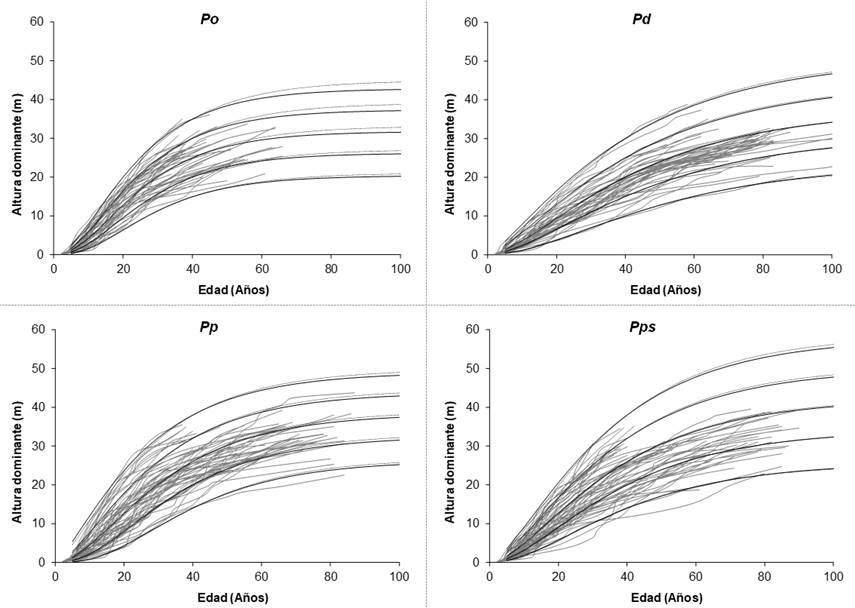
The curves were generated with the dynamic model of Bertalanffy-Richards, with (continuous line) and without (dotted line) correction of the autocorrelation using a CAR2 autoregressive structure.
Figure 3 Site index curves at the base age of 40 years for Pinus oaxacana Mirov (Po), P. douglasiana Martínez (Pd), P. patula Schiede ex Schltdl. & Cham. (Pp) and P. pseudostrobus Lindl. (Pps).
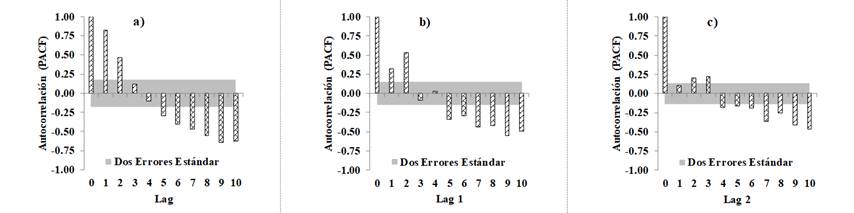
Autocorrelación = Autocorelation; Dos errores estándar = Two standard errors.
Figure 4 Graphs of the Partial Autocorrelation Function of the Bertalanffy-Richards equation (Equation 6): a) fitting without correction of the autocorrelation, b) considering a CAR1 model, and c) considering a CAR2 model.
The coefficients of determination (R 2 adj ) adjusted by the number of parameters of the models of Korf, Hossfeld and Bertalanffy-Richards for the different species show that it is possible to account for more than 96 % of the variance observed in the dominant height growth, in terms of the of the age, with estimations of significant parameters for most combinations of equations and species (p<0.01). The mean errors in the three models range between 1.18 m (Pd) and 1.85 m (Pp) (Table 3).
In general, the three fitted equations show satisfactory fitting statistics for predicting the dominant height growth in terms of age, without expanding the terms of error in order to correct the autocorrelation. On the other hand, the graphic analysis shows a realistic biological behavior (similar predictions to the observed data). However, in Pinus oaxacana the parameter b 1 was not statiscally significant in the Korf (4) and Hossfeld (5) models; therefore, the null hypothesis that the parameter estimations are equal to zero is accepted; this scenario also occurred for the Bertalanffy-Rihards model (6) in parameter b 2 . Parameter b 2 was not significant in the Hossfeld model (5) for Pinus patula Scheide ex. Schltdl. & Cham.; this situation occurred for the same parameter in the Bertalanffy-Richards model (6) for Pinus pseudostrobus, all at a significance level of 5 %.
The results show that the differences between the statistics of goodness-of-fit were minimal between the evaluated models; therefore, the selection of the most appropriate model was based on the graphic analysis of families of dominant height growth curves superimposed to the growth trajectories of the observed data; SI categories of 15 m to 35 m were considered for Pinus oaxacana, of 10 m to 30 m for Pinus douglasiana, with 5 m intervals, and of 14 m to 38 m for Pinus patula and Pinus pseudostrobus, with 6 m intervals, at a reference base age for all cases (Figure 2). This results from the fact that different models can exhibit the same goodness-of-fit or comparison statistics, but a different response to the trajectories of the observed data; thus, some underestimate these at the earlier ages and overestimate them at the later ages, or vice versa (Diéguez-Aranda et al., 2006).
The Betalanffy-Richards model (6) was selected as the most adequate for describing the growth trajectories of the trees included in the database, and in order to compare the growth estimations versus the same model, based on the modeling of the error structure, with CAR1 and CAR2 type continuous-time autoregressive error structures, as this model provides a slightly better description of the individual tendencies in dominant height growth, mainly at ages above 50 years (Figure 2).
The Bertalanffy-Richards equation, which considers a CAR2 structure, was able to model the growth tendencies of the experimental data for the studied species and describe variation patterns in the growth of the developed curves, as well as different site potentialities. This result is consistent with other studies which also recommend this model for the construction of site index curves for other species of commercial interest (Kiviste et al., 2002; Rodríguez-Carrillo et al., 2015; Castillo et al., 2013).
Error structure modeling
Table 4 shows the fitting statistics of the Bertalanffy-Richards model; this incorporates a continuous-time autoregressive model of order 2 (CAR2), which adequately corrected the autocorrelation of the database errors (DW value near 2).
Table 4 Parameter estimations and goodness-of-fit statistics of the Bertalanffy-Richards equation, incorporating the continuous-time autoregressive model CAR2.
| Equation | Species | Parameter | Estimated value | SE | T-value | P-value |
RMSE (m) |
R 2 adj | DW |
|---|---|---|---|---|---|---|---|---|---|
| 6 | Po | b 1 | 0.059830 | 0.00214 | 27.98 | <0.0001 | 0.87 | 0.99 | 1.82 |
| b 2 | -2.475350 | 0.94550 | -2.62 | 0.0091 | |||||
| b 3 | 17.211490 | 3.42410 | 5.03 | <0.0001 | |||||
| p 1 | 0.977894 | 0.00973 | 100.45 | <0.0001 | |||||
| p 2 | 0.906721 | 0.01090 | 83.15 | <0.0001 | |||||
| 6 | Pd | b 1 | 0.027946 | 0.00127 | 22.00 | <0.0001 | 0.79 | 0.99 | 1.81 |
| b 2 | -2.135910 | 0.40310 | -5.30 | <0.0001 | |||||
| b 3 | 13.592790 | 1.49220 | 9.11 | <0.0001 | |||||
| p 1 | 0.997808 | 0.00469 | 212.85 | <0.0001 | |||||
| p 2 | 0.935772 | 0.00681 | 137.36 | <0.0001 | |||||
| 6 | Pp | b 1 | 0.044495 | 0.00170 | 26.15 | <0.0001 | 1.18 | 0.99 | 1.66 |
| b 2 | -9.225630 | 1.31600 | -7.01 | <0.0001 | |||||
| b 3 | 41.266710 | 4.85080 | 8.51 | <0.0001 | |||||
| p 1 | 1.001470 | 0.00474 | 211.28 | <0.0001 | |||||
| p 2 | 0.898239 | 0.00906 | 99.17 | <0.0001 | |||||
| 6 | Pps | b 1 | 0.035901 | 0.00138 | 26.01 | <0.0001 | 1.00 | 0.99 | 1.73 |
| b 2 | -1.304410 | 0.41420 | -3.15 | 0.0017 | |||||
| b 3 | 11.565630 | 1.57430 | 7.35 | <0.0001 | |||||
| p 1 | 0.978021 | 0.00671 | 145.79 | <0.0001 | |||||
| p 2 | 0.917932 | 0.00803 | 114.28 | <0.0001 |
SE = Standard error of the parameter estimator; RMSE = Root mean square error, R 2 adj = Adjusted coefficient of determination; DW = Durbin-Watson statistic; Po= Pinus oaxacana; Pd = Pinus douglasiana; Pp = Pinus patula; Pps = Pinus pseudostrobus.
The average RMSE errors of model 6, with the error structure, ranged between 0.79 m (Pd) and 1.18 m (Pp) (Table 4), and accounted for more than 98 % of the variance in the dominant height growth. The continuous-time autoregressive model of order 2 (CAR2) ensured the independence of the residuals in the fitting process.
Figure 3 shows the SI statistics calculated with the Bertalanffy-Richards equation, without taking into account the error structure (dotted line), as well as those that do consider the CAR2 error structure (continuous line) at a base age of 40 years, overlapped on the experimental data utilized for fitting it. The SI curves cover various ages and describe the relationship of dominant height growth and age with a logical and biological behavior (complex polymorphism) at ages above 50 years (Cieszewski, 2003; Álvarez-González et al., 2010). This figure shows, graphically, that the studied species exhibit various dominant height growth patterns, indicating that stands with dominance of one of the four pine species require to be managed with different forestry schemes (Attis et al., 2015).
In the graphs below, the partial autocorrelation function (PACF) resulting from the fitting of the Bertalanffy-Richards equation with 10 lags of the residuals for each tree (Figure 4), is observed to change from a correlogram with a positive autocorrelation of order 2 to a correlogram without evidence of autocorrelation, estimated through the fit of the dynamic equation with a CAR2 type continuous-time autoregressive error structure; the results are similar to those registered by Vargas-Larreta et al. (2010), Vargas-Larreta (2013) and Quiñonez-Barraza et al. (2015) for forest tree species in various regions of Mexico.
When correcting the autocorrelation, the random pattern of the residuals is defined around the zero line, with a homogeneous variance and without detecting a particular tendency (Figure 5). Also shown are the evolution of the bias and the RSME, as well as a considerable increase in the predicted dispersion and heights above the age of 50 years, due mainly to the lack of height-age data pairs for these age classes.
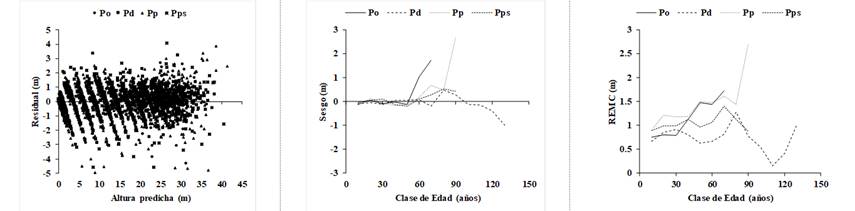
Residual = Residual; Altura predicha = Predicted height; Sesgo = Bias; Clase de edad (años) = Age category (years); REMC) RSME.
Figure 5 Residuals vs predicted heights and evolution of the bias and root mean square error (RSME) by age category in the Bertalanffy-Richards model, using the CAR2 autoregressive model.
Conclusions
The Bertalanffy-Richards dynamic equation is an adequate option for modeling the dominant height growth and site index for the four pine species studied at Umafor 2001. The obtained equations are polymorphic, with multiple asymptotes and invariants in relation to the reference base age; furthermore, they allow estimating the dominant height and the site index directly at any height or reference base age. The use of these equations will contribute to improve the estimation of the productive potential of those management units where P. oaxacana, P. douglasiana, P. patula and P. pseudostrobus are dominant, and their incorporation into forest management programs will allow selecting management regimes geared at increasing productivity.
Acknowledgments
The authors wish to express their gratitude to the Conafor-Conacyt sectorial fund for financing the project “Biometric system for planning a sustainable forest management of ecosystems with a timber potential in Mexico”, and to Conacyt for the grant that enabled the first author to study the Doctorado Institucional en Ciencias Agropecuarias y Forestales, DICAF-UJED (Institutional PhD in Agricultural and Livestock Sciences and Forestry).
REFERENCES
Álvarez-González, J. G., A. Zingg and K. V. Gadow. 2010. Estimating growth in beech forests: a study based on long term experiments in Switzerland. Annals of forest science 67(3): 307. [ Links ]
Amaral M., S., L. C. Rodrigues S., M. A. Figura, S. J. Téo and R. G. Mendes N. 2010. Comparison of methods for estimating heights from complete stem analysis data for Pinus taeda. Ciência Florestal 20(1): 45-55. [ Links ]
Attis B., H., L. M. Chauchard y G. Martínez P. 2015. Curvas preliminares de índice de sitio para bosques puros y mixtos de Nothofagus alpina y Nothofagus obliqua en la Patagonia Argentina. Bosque 36(2): 275-285. [ Links ]
Bailey, R. L. and J. L. Clutter. 1974. Base-age invariant polymorphic site curves. Forest Science 20(2): 155-159. [ Links ]
Bengoa M., J. L. 1999. Análisis de un modelo de crecimiento en altura de masas forestales: aplicación a las masas de Quercus pyrenaica de La Rioja. Tesis doctoral. Escuela Técnica Superior de Ingenieros de Montes. Universidad Politécnica de Madrid. Madrid, España. 317 p. [ Links ]
Carmean, W. H. 1972. Site index curves for upland oaks in the Central States. Forest Science 18(2): 109-120. [ Links ]
Castillo L., A., B. Vargas-Larreta, J. J. Corral R., J. A. Nájera L., F. Cruz C. y F. J. Hernández. 2013. Modelo compatible altura-índice de sitio para cuatro especies de pino en Santiago Papasquiaro, Durango. Revista Mexicana de Ciencias Forestales 4(18): 86-103. [ Links ]
Cieszewski, C. J. 2001. Three methods of deriving advanced dynamic site equations demonstrated on inland Douglas-fir site curves. Canadian Journal of Forest Research 31(1): 165-173. [ Links ]
Cieszewski, C. J. 2002. Comparing fixed-and variable-base-age site equations having single versus multiple asymptotes. Forest Science 48(1): 7-23. [ Links ]
Cieszewski, C. J. 2003. Developing a Well-Behaved Dynamic Site Equation Using a Modified Hossfeld IV Function Y 3=(axm)/(c+ x m-1), a Simplified Mixed-Model and Scant Subalpine Fir Data. Forest Science 49(4): 539-554. [ Links ]
Cieszewski, C. J. and R. L. Bailey. 2000. Generalized algebraic difference approach: theory based derivation of dynamic site equations with polymorphism and variable asymptotes. Forest Science 46(1): 116-126. [ Links ]
Corral R., J. J., J. G. Álvarez G., A. D. Ruíz G. and K. V. Gadow. 2004. Compatible height and site index models for five pine species in El Salto, Durango (Mexico). Forest Ecology and Management 201(2-3): 145-160. [ Links ]
Clutter, J. L., J. C. Fortson, L. V. Pienaar, G. H. Brister and R. L. Bailey. 1983. Timber management: a quantitative approach. John Wiley & Sons. New York, NY USA. 333 p. [ Links ]
Crecente-Campo, F., A. R. Alboreca and U. Diéguez-Aranda. 2009. A merchantable volume system for Pinus sylvestris L. in the major mountain ranges of Spain. Annals of forest science 66(8): 808. [ Links ]
Daniel, T. W., J. A. Helms and F. S. Baker. 1979. Principles of Silviculture. 2nd edition. McGraw-Hill. New York, NY USA. 500 p. [ Links ]
Diéguez-Aranda, U., H. E. Burkhart and R. L. Amateis. 2006. Dynamic site model for loblolly pine (Pinus taeda L.) plantations in the United States. Forest Science 52(3): 262-272. [ Links ]
Diéguez-Aranda, U, A. Rojo A., F Castedo-Dorado, J. G. Álvarez-González., M Barrio-Anta, F. Crecente-Campo, J. M. González G., C. Pérez-Cruzado, R. Rodríguez S., C. A. López-Sánchez, M. A. Balboa-Murias, J. J. Gorgoso V. y F. Sánchez R. 2009. Herramientas selvícolas para la gestión forestal sostenible en Galicia. Consellería do Medio Rural. Xunta de Galicia. Galicia, España. 268 p. [ Links ]
Durbin, J. and G. S. Watson. 1951. Testing for serial correlation in least squares regression. II. Biometrika 38(1-2): 159-178. [ Links ]
Dyer, M. E. and R. L. Bailey. 1987. A test of six methods for estimating true heights from stem analysis data. Forest Science 33(1): 3-13. [ Links ]
Fabbio, G., M. Frattegiani and M. C. Manetti. 1994. Height estimation in stem analysis using second differences. Forest science 40(2): 329-340. [ Links ]
Goelz, J. C. G. and T. E. Burk. 1992. Development of a well-behaved site index equation: jack pine in north central Ontario. Canadian Journal of Forest Research 22(6): 776-784. [ Links ]
González M., M., F. Cruz C., G Quiñones B., B. Vargas L. y J. A. Nájera L. 2016. Modelo de crecimiento en altura dominante para Pinus pseudostrobus Lindl. en el estado de Guerrero. Revista Mexicana de Ciencias Forestales 7(37): 7-20. [ Links ]
Granados-Sánchez, D. 2009. Estudio regional forestal de la UMAFOR SIERRA NORTE DE OAXACA (clave: 2001). División de Ciencias Forestales, Universidad Autónoma Chapingo. Texcoco, Edo. de Méx., México. 143 p [ Links ]
Kiviste, A., J. G. Álvarez-González, A. Rojo-Alboreca y A. D. Ruiz-Gonzáles.2002. Funciones de crecimiento de aplicación en el ámbito forestal. Monografías INIA: Serie Forestal Núm. 4. Instituto Nacional de Investigación y Tecnología Agraria y Alimentaria (INIA). Madrid, España. 190 p. [ Links ]
Krumland, B. and H. Eng. 2005. Site index systems for major young-growth forest and woodland species in northern California (No. 4). California Department of Forestry & Fire Protection. Pebble Beach, CA, USA. 218 p. [ Links ]
Newberry, J. D. 1991. A Note on Carmean's Estimate of Height from Stem Analysis Data. Forest Science 37(1): 368-369. [ Links ]
Nord-Larsen, T. 2006. Developing dynamic site index curves for European beech (Fagus sylvatica L.) in Denmark. Forest Science 52(2): 173-181. [ Links ]
Parresol, B. R. and J. S. Vissage. 1998. White pine site index for the southern forest survey. Res. Pap. SRS-10. Forest Service, Southern Research Station. US Department of Agriculture. Asheville, NC USA. 8 p. [ Links ]
Quiñonez-Barraza, G., H. M. De los Santos-Posadas, F. Cruz-Cobos, A. Velázquez-Martínez, G. Ángeles-Pérez y G. Ramírez-Valverde. 2015. Índice de sitio con polimorfismo complejo para masas forestales de Durango, México. Agrociencia 49(4): 439-454. [ Links ]
Rennolls, K. 1978. "Top Height": Its definition and estimation. The Commonwealth Forestry Review 57(3): 215-219. [ Links ]
Rodríguez-Carrillo, A., F. Cruz-Cobos, B. Vargas-Larreta y F. J. Hernández. 2015. Compatible dominant height-site index model for juniper (Juniperus deppeana Steud.). Revista Chapingo. Serie Ciencias Forestales y del Ambiente 21(1): 97-108. [ Links ]
Statistical Analysis System (SAS). 2004. SAS/ETS™ User’s Guide, Relase 8.2. SAS Institute, INC. Cary, NC USA. n/p. [ Links ]
Sharma, R. P., A. Brunner, T. Eid and B-H. Øyen. 2011. Modelling dominant height growth from national forest inventory individual tree data with short time series and large age errors. Forest Ecology and Management 262(12): 2162-2175. [ Links ]
Tait, D. E., C. J. Cieszewski and I. E. Bella. 1988. The stand dynamics of lodgepole pine. Canadian Journal of Forest Research 18(10): 1255-1260. [ Links ]
Torres R., J. M. y O. S. Magaña T. 2001. Evaluación de plantaciones forestales. Limusa. México, D.F., México. 472 p. [ Links ]
Vargas-Larreta, B., J. G. Álvarez-González, J. J. Corral-Rivas y Ó. A. Aguirre C. 2010. Construcción de curvas dinámicas de índice de sitio para Pinus cooperi Blanco. Revista Fitotecnia Mexicana 33(4): 343-350. [ Links ]
Vargas-Larreta, B., O. A. Aguirre-Calderón, J. J. Corral-Rivas, F. Crecente-Campo y U. Diéguez-Aranda. 2013. Modelo de crecimiento en altura dominante e índice de sitio para Pinus pseudostrobus Lindl. en el noreste de México. Agrociencia 47(1): 91-106. [ Links ]
Santiago-García, W., H. M. de los Santos-Posadas, G. Ángeles-Pérez, J. R. Valdez-Lazalde y G. Ramírez-Valverde. 2013. Sistema compatible de crecimiento y rendimiento para rodales coetáneos de Pinus patula. Revista Fitotecnia Mexicana 36(2): 163-172. [ Links ]
Zimmerman, D. L. y V. Núñez-Antón. 2001. Parametric modelling of growth curve data: an overview. Test 10(1): 1-73. [ Links ]
Received: January 31, 2018; Accepted: July 16, 2018
 Este es un artículo publicado en acceso abierto bajo una licencia Creative Commons
