


Serviços Personalizados
Journal
Artigo
 texto em
  Inglês (pdf)
 Artigo em XML
 Referências do artigo
 Enviar este artigo por email
Indicadores
-
 Citado por SciELO
 -
 Acessos
Links relacionados
-
 Similares em
SciELO
Similares em
SciELO
Compartilhar

 Permalink
Revista mexicana de ciencias forestales
versão impressa ISSN 2007-1132
Rev. mex. de cienc. forestales vol.9 no.48 México Jul./Ago. 2018
https://doi.org/10.29298/rmcf.v8i48.184
Articles
Carbon storage potential in forest areas within a livestock system
1Facultad de Ciencias Agronómicas, Universidad Autónoma de Chiapas. México.
The rapid increase in livestock production has generated environmental impacts, such as deforestation, loss of biodiversity, soil degradation and greenhouse gas (GHG) emissions. In Chiapas, GHG emissions have increased especially due to the conversion of forest lands to pastures and livestock enteric fermentation. The removal of atmospheric CO2 by forestry and agroforestry activities within the livestock production units can significantly reduce the net GHG emissions. The main objective of this research was to evaluate the carbon storage potential in forest areas within a livestock production unit in Villaflores, Chiapas, in order to know their contribution to GHG mitigation. Twelve sampling plots were established in forest areas and pasturelands to evaluate the carbon stocks in aboveground living biomass, root biomass, litter, dead wood and soil organic carbon. The average carbon storage in forest areas was 144.45 Mg C ha-1 compared to 75.95 Mg C ha-1 in the pasture areas. The carbon storage in living biomass was higher in forest areas than in pasturelands as expected but there was no significant differences in the soil organic carbon pool. The farm has 24.7 hectares of forest area (40 % of the total land surface) with a high diversity of tree species and if it is decided to deforest for pasture establishment, it would contribute to 6 353.95 Mg of CO2 emissions. The results will serve as a baseline for estimating annual carbon removal with future re-measurements.
Key words: Forest biomass; soil organic carbon; livestock production; greenhouse gases; mitigation; pasture
El rápido aumento de la producción ganadera ha provocado impactos ambientales, como la deforestación, la pérdida de biodiversidad, la degradación del suelo y las emisiones de gases de efecto invernadero (GEI). En el estado de Chiapas, dichas emisiones han aumentado especialmente por la conversión de tierras forestales a pastizales y la fermentación entérica del ganado. La remoción de CO2 atmosférico por actividades forestales y agroforestales dentro de las unidades de producción ganadera puede reducirlas significativamente. El principal objetivo de esta investigación fue conocer el potencial de almacenamiento de carbono en áreas forestales, para conocer su contribución en la mitigación de GEI dentro de una unidad de producción ganadera en Villaflores, Chiapas. Se establecieron 12 parcelas de muestreo en áreas forestales y potreros para evaluar el carbono en biomasa viva aérea, biomasa de raíces, hojarasca, madera muerta y carbono orgánico del suelo. El promedio de almacenamiento de carbono en áreas forestales fue 144.45 Mg C ha-1 comparado con 75.95 Mg C ha-1 en los potreros. El almacén de carbono en biomasa viva, como se esperaba fue más alto en áreas forestales que en potreros, pero no hubo diferencia significativa en el reservorio de carbono orgánico del suelo. El rancho en estudio posee 24.7 ha (40 % de la superficie) de áreas forestales con alta diversidad de especies arbóreas, y si se decidiera deforestar para establecer pasturas contribuiría con 6 353.95 Mg de emisiones de CO2. Los resultados permitirán estimar la remoción anual de carbono con futuras remediciones.
Palabras clave: Biomasa forestal; carbono orgánico del suelo; ganadería; gases de efecto invernadero; mitigación; potrero
Introduction
The livestock sector is growing very fast in the tropics with deforestation, loss of biodiversity, soil degradation and greenhouse gas emissions as negative environmental consequences (Miles and Kapos, 2008; Liu et al., 2015). From 1960 to 2010, global emissions of greenhouse gases (GHGs) from the livestock sector increased by 51 % globally and by 117 in developing countries (Caro et al., 2014). CH4 emissions from enteric fermentation and CO2 emissions derived from the conversion of forest lands to grazing land have been considered as the main sources of GHG in the livestock sector (O'Mara et al., 2011; Gerber et al., 2013; Opio et al., 2013).
The main change in land use in Mexico has been the deforestation of forests to establish pastures for livestock, and, at present, these areas continue to increase (De Jong et al., 2010). Chiapas is one of the states with the greatest biodiversity and natural resources; however, the latter have experienced a huge reduction and degradation in recent years (González-Espinosa et al., 2009). The severe land use change and fragmentation of the original vegetation has caused the loss of more than 50 % of the forest area in the past decades (De Jong et al., 1999; Ochoa-Gaona et al., 2004; Flamenco-Sandoval et al., 2007; Rocha-Loreda et al., 2010; Nahed-Toral et al. 2013). According to the state GHG inventory, 77 % of the total emissions come from this type of land use, agriculture and livestock. Most of these emissions are attributed to the livestock activities of the state (PACCCH, 2007).
This makes it urgent to take measures at the local and regional level, to look for mitigation strategies of GHG emissions in livestock production systems and to restore the functioning of ecosystems in the long term. Forested areas and silvopastoral systems within the ranches have the ability to store carbon and can serve as alternatives for greenhouse gas mitigation and biodiversity conservation (Lamb et al., 2016; Pompa-García et al., 2017a).
The sustainability of an agricultural and forestry production system depends to a large extent on its ability to provide ecosystem services (Chazdon, 2008; Balvanera, 2012; Casanova et al., 2016). In the current context of land use change, livestock production, and greenhouse gas emissions (Torres-Rivera et al., 2011; Trilleras et al., 2015; Kauffman et al., 2016) it is imperative to find alternatives that could contribute to mitigate emissions and improve capacities for the provision of ecosystem services at the level of the production units (Lamb et al., 2016). The capture of atmospheric CO2, the recycling of nutrients, the regulation of the hydrological cycle and the conservation of biodiversity are some of the ecosystem services that producers could appreciate from forest and agroforestry areas within a livestock production unit (Balvanera, 2012).
However, the potential for carbon storage and tree diversity of forest areas present within a livestock production system has not been studied more thoroughly in Mexico. There are no specific data on the contribution of forestry activities in the mitigation of GHG at the scale of the livestock production unit. It is of great importance to know the carbon stocks, the floristic diversity that these systems bring together and the potential for CO2 capture of forest lands to reduce the environmental impacts of the livestock sector.
The objective of this study was to evaluate tree diversity and carbon storage potential in living area biomass, live underground biomass, mulch, dead wood and soil organic carbon in forest areas, in a cattle ranch in Villaflores municipality, Chiapas, Mexico. The following hypotheses were proposed: the carbon stored in biomass and in soil is greater in forest areas than in paddocks; the forest areas present within the livestock production unit contribute positively to the conservation of biodiversity.
Materials and Methods
Study area
The study was conducted in a livestock production system in the Villaflores municipality, Chiapas (Figure 1). The dominant climate of the region is warm sub-humid, with rains in summer and average humidity. The sampling sites are located between 16°23'57.63" N and 93°11'50.91" W, at 847 m, 1 200 - 1 500 mm of rainfall in a five month - rainy period. The predominant type of soil is Leptosol. The main type of vegetation in the region is the sub-deciduous tropical forest, with a greater abundance of species such as Quercus rugosa Née, Acacia collinsii Saff., Bursera simaruba (L.) Sarg., Enterolobium cyclocarpus (Jacq.) Griseb. and Guazuma ulmifolia Lam.

Source: Own elaboration with maps of INEGI (2012) and Google Earth (2015).
The sites from F1 to F6 represent forest areas and from P7 to P12, pasture areas.
Leyenda = Legend; Forestal = Forestal; Potrero = Paddocks
Figure 1 Location of the sampling points within the Villaflores municipality, Chiapas, Mexico.
The study area has a total area of 62.5 ha, of which the forest area covers 39.5 % (24.54 ha), 40 % to paddocks areas and the rest has other uses such as seasonal agriculture, fruit orchards and urban infrastructure (buildings). In Figure 1, the distribution of carbon sampling plots in forest areas and paddocks is shown.
Establishment of plots and quantification of live biomass
The samples were collected in the forest and grazing areas of the Los Flamboyanes cattle ranch. Field trips were made in the forest areas of the ranch through which twelve plots were defined in total, six of forest that did not have road crossings or human disturbance, and six other plots of pastures with or without trees. Subsequently, another systematic data capture was made, adapted to the methodology of the Inventario Nacional Forestal y de Suelo (National Forest and Soil Inventory) (INFyS) (Conafor, 2005).
Rectangular plots of 40 × 25 m (1 000 m2) were established and with a minimum distance of 200 m between them. Under the principle of nested plots, all trees were recorded with a DBH (1.30 m from ground level) of at least 2.5 cm on a surface area of 500 m2, and trees with a DBH of 10 cm onwards on 1 000 m2.
The total height of the trees was measured with a graduated bamboo stick and the measurements were corroborated with the inclinometer. To determine the dominance of the main species identified in the sampling area, the sum of the basimetric area in m2 of each of the species per hectare was calculated.
The following formula was used for the basimetric area:
Where:
AB = Basimetric area of the tree
ϖ = Constant (pi)
DAP = DBH
The biomass area of the trees was quantified by the equation proposed by Cairns et al. (2003) with the wood density correction of each species. In order to evaluate the fit with the data and make the comparison in the amount of biomass between two equations, the equation of Chave et al. (2015).
Where:
BA = Aerial biomass
DAP = DBH
AT = Total height of the tree
P = Wood density
Pm = Wood density of the species used for the model
For the calculation of root biomass, the following formula (Cairns et al., 1997) was used:
Where:
BR = Root biomass
BA = Aerial biomass
In order to quantify the biomass of the associated vegetation (herbs, shrubs and trees <2.5 cm DBH), four random samples were taken in a quadrant of 1 × 1 m in each plot. The samples were dried in the oven (RIOSSA HCF-125) at 70 oC for up to 72 hours to obtain the dry weight of the biomass. Once the above was achieved, carbon was quantified, by means of the carbon fraction in the biomass (47 %) and, subsequently, extrapolated to Mg C ha-1 (Aryal et al., 2014; Fonseca et al., 2011; Pompa-García and Sigala, 2017). To calculate Mg of C ha-1 with the carbon data per tree, the following formula was used:
Mulch and dead wood
Four samples were taken, completely at random, with a 50 × 50 cm quadrant in each plot. The mulch samples were collected separately in three states of decomposition: fresh (Oi), fragmented and in the process of decomposition (Oe) and decomposed or humus (Oa). The samples were processed in the laboratory of the School of Agronomic Sciences Campus V, of the UNACH, where the dry weight of the samples g m-2 was determined. Then the amount of carbon (Mg ha-1) was obtained by multiplying it by the carbon fraction according to its state of decomposition: Oi (39 %), Oe (36 %), Oa (27 %), proposed by Orihuela-Belmonte et al. (2013).
The dead wood was measured in four 25 m transects in each plot, where the diameters of 2.5 cm onwards were taken in the first 10 m and 5 cm onwards in the remaining 15 m. They were classified into three decomposition states - strong, intermediate and decomposed - since the density of wood varies according to its state of decomposition. The wood volume of each of them was calculated with the following formula:
Where:
V = Dead wood volume (m3 ha-1)
L = Length of the sampling line (m)
di = Dead wood diameters at the intersection (cm)
The volume of wood was multiplied by the density of wood according to its state of decomposition: strong (78 %), intermediate (62 %) and decomposed (27 %) to quantify the dry weight of wood (Eaton and Lawrence, 2006). The carbon content of dead wood biomass was calculated with the carbon fraction (47 %) proposed by Fonseca et al. (2011).
Organic soil carbon
Four soil samples were taken at random to a depth of 15 cm in each plot, with a nucleator (AMS) of 5 cm of internal diameter to quantify the apparent density of soil and another four samples for chemical analysis of soil. The samples for bulk density were processed in the laboratory, where the dry weight was obtained (105 °C, 72 h), and then with the cylinder volume data, the apparent soil density (g cm-3) was calculated. The content of organic matter, pH and electrical conductivity of the soil were analyzed in the laboratory of the Facultad de Ciencias Agronómicas Campus V, de la Universidad Autónoma de Chiapas (School of Agronomic Sciences Campus V, of the Autonomous University of Chiapas). With the data of carbon content (%), bulk density (g cm-3) and coarse fraction (% of rocks and roots), the storage of organic carbon in soil (Mg C ha-1) was calculated, with the following equation:
Where:
CC = Carbon content in soil samples (%)
DA = Apparent soil density (Mg m-3 or g cm-3), fitted for coarse fractions
PS = Depth of sampled soil (m)
Data analysis
In order to calculate the abundance of each tree species, the number of individuals registered within the sampling area was used and then extrapolated to individuals per hectare by two diametric classes (<10 cm DAP and ≥10 cm DAP). The species with the highest relative abundance (%) were considered as more abundant species. The dominance of forest species was determined considering the sum of the basal areas per hectare (m2 ha-1) and their relative contribution in total basal area. The comparison of carbon content in each reservoir between forest area and paddock area was analyzed by using the one-way ANOVA (p <0.05). Subsequently, the Tukey test was used (p <0.05) if necessary. Basic statistics were determined as mean, standard error and frequencies for each of the reservoirs and systems. The non-linear regression analysis was performed to compare the goodness of fit of two allometric equations (Cairns et al., 2003; Chave et al., 2015) in their ability to estimate live biomass with tree DBH data. The analyzes were carried out with the statistical package Statistica 7.0 (Statsoft, 2007).
Results and Discussion
Abundance of trees
In the forest plots 46 different tree species were found, the main 20 species with the highest abundance per hectare are shown in Figure 2. Quercus rugosa Née, Acacia collinsii Saff., Guazuma ulmifolia Lam., Bursera simaruba (L.) Sarg. and Daphnopsis americana (Mill.) J. R. Johnst. were the most abundant in the study area.

Dominance of trees
It can be seen in Figure 3 that the species with the highest dominance was Quercus rugosa, with a total AB of 11.07 m2 ha-1, followed by Enterolobium cyclocarpum (Jacq.) Griseb. with 1.62 m2 ha-1. The species of least dominance were Diphysa robinoides Benth. & Oerst., Albizia nipoides (Benth.) Burkart and Coccoloba cozumelensis Hemsl., with a basimetric area equal to or less than 0.01 m2 per hectare.

Área basal = Basal area
Figure 3 Dominance of the main forest species identified in the forest areas.
The role of the remaining vegetation in fragmented landscapes is appreciated not only for its capacity for carbon accumulation and mitigation of climate change, but also for its contribution to natural regeneration and conservation of biodiversity (Chazdon, 2008, Martínez-Sánchez et al., 2015; Mora et al., 2018). Fragments of forest areas (about 40 % of the total area of the ranch) are home to more than 40 species of forest trees with different levels of abundance and dominance within the arboreal community.
Of the tree species recorded in the study area, few are the most abundant, which may be due to species such as Quercus rugosa, Guazuma ulmifolia and Bursera simaruba, which are the most numerous in surrounding patches of the landscape, produce fruits and seeds, which are food for wild animal species, which scatter seeds easily throughout the forest (Chazdon et al., 2010). In the same way, these species can adapt to forest ecosystems with low and medium levels of human disturbance.
In a review of 161 studies conducted in Mexican territory, Pompa-García et al. (2017a) demonstrated the importance of forest ecosystems in the conservation of diversity and of ecologically important forest species. The authors concluded that the most focused ecosystem is the low deciduous forest and the predominant species correspond to the genera Quercus, Pinus, Acacia and Bursera, which are of great importance for the resilience effects of disturbed ecosystems.
When comparing these systems with other forest systems, it was found that the values of both the number of species (46) and the total number of trees per hectare (1 081) were higher than the results of Basáñez et al. (2008) with 30 species and 810 individuals ha-1, in total, in the middle sub-perennial forest. Taylor (2016) records a greater number of species (95 in total), but fewer individuals (303 ha-1) in pine-oak forest, than those recorded in this work. In forests of Quercus rugosa, the values obtained by Hernández (2015), of 983 individuals ha-1 of which 820 individuals had a DAP of 0-10 cm, are similar to those consigned here (1 081 individuals ha-1, of 663 with DBH <10 cm), in sub-deciduous forests; this suggests that the forest under study the existence of natural regeneration processes.
The dominance of the main species identified in this work, expressed in the basimetric area, is lower than the values of Basáñez et al. (2008) in Papantla, Veracruz, in the middle subcaducifolia forest, with 76.77 m2 ha-1. In Los Altos de Chiapas, Taylor (2016) calculated 49 m2 ha-1, in pine-oak forests. In San José, State of Mexico, Hernández (2015) recorded 12.31 m2 ha-1 in Quercus rugosa forests.
Carbon reservoirs
The highest accumulation of carbon is concentrated in the living aerial biomass of the trees with 46.71 ± 9.00 Mg C ha-1 (average ± standard error) for the forest area and 0.30 ± 0.13 Mg C ha-1 in the paddock area (Table 1). There was a significant difference between the forest area and the pasture area in aerial biomass and root biomass (P = 0.00012). The associated vegetation collected more carbon in the pasture area 1.14 ± 0.09 Mg C ha-1 than in the forest area 0.33 ± 0.05 Mg C ha-1, with a significant difference (P = 0.0000) between the two systems.
Table 1 Carbon content in living aerial biomass in forest and paddock area.
| Forest area Mg C ha -1 |
Paddock area Mg C ha -1 |
|||
|---|---|---|---|---|
| Mean | Standard Error | Mean | Standard Error | |
| Tree aerial biomass | 46.71 (65.07) a | 9.00 (6.53) | 0.30 (0.51) b | 0.13 (0.21) |
| Tree root biomass | 16.46 (23.08) a | 2.69 (3.09) | 0.14 (0.24) b | 0.06 (0.09) |
| Associated vegetation | 0.33 b | 0.05 | 1.14 a | 0.09 |
| Total carbon in live biomass | 63.5 (88.48) a | 9.69 (8.60) | 1.58 (1.90) b | 0.22 (0.31) |
The initial values were calculated with the allometric equation of Cairns et al. (2003) and the values in parentheses were calculated with the equation of Chave et al. (2015). Means followed by different letters between columns are statistically different (Tukey, p <0.05).
The proper selection of allometric equations to quantify the living biomass of the trees can reduce the uncertainty in the estimation of carbon storage. In a comparative analysis, it turned out that the amount of carbon quantified with the equation of Cairns et al. (2003) was 28.2 % lower than with the equation of Chave et al. (2015). The first one was developed with the forest species of the medium sub-evergreen tropical forest of the Yucatán Peninsula, while the second one using data collected from several regions of the tropics. In a non-linear regression analysis with the data of the study of interest, Chave's equation had greater goodness of fit (R2 = 0.96) than that of Cairns (R2 = 0.78), which supposes its best applicability (Figure 4).
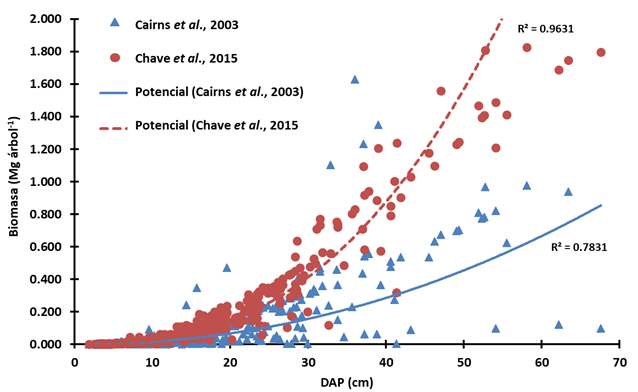
Biomasa = Biomass; DAP = DBH
Figure 4 Non-linear regressions between DBH and live biomass estimated by two allometric equations.
The amount of carbon stored in the mulch of forest areas varied according to the state of decomposition (Figure 5). A greater amount of carbon stored in the horizon Oa (decomposed material) was recorded compared to the horizons Oi (fresh) and Oe (partially decomposed). There is no reservoir of mulch in the paddock area.

Organic carbon and soil properties
In the organic carbon content of the soil between forest areas and paddocks (p = 0.268, one-way ANOVA) no significant difference was found. The organic carbon accumulated in forest land was 72.57 Mg C ha-1 with a standard error of 2.89, very similar to the carbon content in paddock soil 74.37 Mg C ha-1 with a standard error of 3.30. When comparing the two systems, forestry and paddocks in apparent density, pH, electrical conductivity and percentage carbon content, no significant differences were observed (Table 2).
Table 2 Stored carbon, pH and electric conductivity in the soil of the forest and paddock systems at 15 cm deep.
| Physico-chemical properties of soil | Forest area | Paddock area | ||
|---|---|---|---|---|
| Mean | S.E. | Mean | S.E. | |
| Organic carbon of soil (Mg C ha-1) | 72.57 a | 2.89 | 74.37 a | 3.30 |
| Apparent density (g cm-3) | 1.39 a | 0.038 | 1.34 a | 0.022 |
| pH | 5.23 a | 0.11 | 5.21 a | 0.18 |
| Electric conductivity (mS m-1) | 119.18 a | 7.20 | 119.65 a | 10.60 |
| Carbon content (%) | 3.50 a | 0.14 | 3.71 a | 0.18 |
S.E. =Standard error. Means followed by the same letter between columns, are statistically equal (Tukey, p<0.05).
A comparison of the soils of paddocks, good and eroded, there was no significant difference in carbon content, 73.81 Mg C ha-1, figure similar to that of the degraded paddock, 74.92 Mg C ha-1, apparent density and carbon in percent (P> 0.05, one-way ANOVA). The pH presented a significant difference (P = 0.030), of 5.56 in the soils of good paddocks and 4.87 in the eroded ones (Table 3). In a similary way, there is a significant difference in electrical conductivity (P = 0.042), since it was lower in good paddocks (100.01 mS m-1) than in eroded paddocks (139.29 mS m-1). The higher values of electrical conductivity in the latter could be attributed to the high concentrations of salts.
Table 3 Stored carbon, pH and electric conductivity in the soils of good and eroded paddocks at 15 cm deep.
| Physico-chemical properties of soil | Non-eroded paddock | Eroded paddock | ||
|---|---|---|---|---|
| Mean | S.E. | Mean | S.E. | |
| Carbon storage (Mg ha-1) | 73.81a | 3.91 | 74.92a | 2.69 |
| Apparent density (g cm-3) | 1.33a | 0.04 | 1.35a | 0.01 |
| pH | 5.56a | 0.12 | 4.87b | 0.23 |
| Electric conductivity (mS m-1) | 100.01a | 7.23 | 139.29b | 13.96 |
| Organic carbon (%) | 3.74a | 0.23 | 3.68a | 0.13 |
Means followed by the same letter between columns, are statistically equal (Tukey, p<0.05). S.E. = Standard error.
When comparing the total carbon stored between the two different study areas, the forest area registered a greater amount of carbon (144.45 Mg C ha-1) than the pasture area (75.95 Mg C ha-1). Organic soil carbon (SOC) was the main reservoir in the two study systems (Table 4). In forest systems, COS contributes 50.2 % of total carbon and in pasture areas, with 97.9 % (Table 4).
Table 4 Storage of total carbon Mg C ha-1, in forest area and paddocks.
| Carbon reservoirs | Forest area (Mg C ha -1 ) |
Paddock area (Mg C ha -1 ) |
|---|---|---|
| Aerial biomass | 46.71 a (32.3 %) | 0.30 b (0.4 %) |
| Root biomass | 16.46 a (11.4 %) | 0.14 b (0.2 %) |
| Associated vegetation | 0.33 b (0.2 %) | 1.14 a (1.5 %) |
| Soil | 72.57 a (50.2 %) | 74.37 a (97.9 %) |
| Mulch | 4.89 a (3.4 %) | 00 b (0.0 %) |
| Dead wood | 3.49 a (2.4 %) | 00 b (0.0 %) |
| Total carbon | 144.45 (100 %) | 75.95 (100 %) |
Means followed by the same letter between columns, are statistically equal (Tukey, p<0.05).
Separating certain conservation areas within a livestock production unit is not a common practice in the Mexican southeast. However, some producers, consciously or unconsciously, maintain a forest area that accumulates atmospheric carbon and contributes to reducing the net emissions of greenhouse gases (CO2 equivalent) from their ranches. The accumulation of carbon in biomass and soil within these production units also significantly supports the control of avoided deforestation emissions (García-Oliva et al., 2006; De Jong et al., 2010; Soto-Pinto et al., 2010; Nahed-Toral et al., 2013). In this sense, the ranch forest area of this study helps in an ecological way to the storage of carbon in living area biomass, underground living biomass, dead wood, leaf litter and organic soil carbon.
As expected, the amount of carbon stored in reservoirs such as live tree biomass, dead wood and litter were higher in forest areas than in pasture areas. However, the hypothesis that organic soil carbon in the first areas is higher than in the second was rejected because no significant differences were found.
This can be attributed to the following factors: i) the organic carbon in the soil is a more stable reservoir and can be affected slowly by the change in land use. These patterns have also been observed in other studies in south-southeast Mexico (Orihuela-Belmonte et al., 2013; Aryal et al., 2015, Villanueva-López et al., 2016; Aryal et al., 2017); ii) the contribution of organic matter by the replacement of roots of pasture areas can contribute in a significant way to maintain the organic carbon of the soil in pastures. This is consistent with the present result that the carbon accumulated in the associated vegetation (pastures, shrubs and trees <2.5 cm of DBH) was greater in pasture areas than in forest areas. However, studies on the production, turnover and decomposition of roots between forest areas and pastures are required to understand well the organic carbon dynamics of soil in these ecosystems. In addition, pasture management in terms of: grazing rotation, number of animals per unit area, addition of organic matter and synthetic fertilizers can explain the variations and trends of organic carbon accumulation in pasture areas, which were not considered in this study.
The average values of carbon stored in the arboreal component of this research are lower than those calculated by Hernández (2015) who recorded 109 Mg C ha-1 in tree biomass. As for the biomass components of roots and associated vegetation, the same author calculated 19.88 and 1.44 Mg C ha-1, which are very similar to those of this work. Ibrahim et al. (2006) reported an average of 90.78 and 4.83 Mg C ha-1 of carbon in live aerial biomass in secondary forests and pastures in monoculture respectively in Esparza, Costa Rica. Aguilar (2007) obtained 1.99 Mg C ha-1 in aerial biomass in the paddocks of monoculture systems in Marqués de Comilla, Chiapas; similar to those in this work.
In the biomass component of the associated vegetation, higher carbon content was found in the paddock system than in the forestry system, possibly because they receive greater solar radiation and due to little competition among the members of the herbaceous stratum in the second. This difference can be a function of the density of trees, type of species, age of the ecosystem and number of strata present (Aguilar, 2007). In addition, it has recently been reported that the carbon stored in living biomass varies not only from one system to another, but also from one species to another, to which we should add the ecological conditions derived from the difference in carbon concentrations in the tissues (Pompa-García et al., 2017b).
The results of carbon stored in dead wood in this investigation (3.49 Mg C ha-1) were lower than Bolaños et al. (2017) and Aryal et al. (2014) who calculated 16 and 35.87 Mg C ha-1, respectively, for pine forests and secondary sub-evergreen forests. The value obtained from carbon in mulch of the present research (4.89 Mg C ha-1) in sub-deciduous forests is lower than those of Bolaños et al. (2017) of 11 Mg C ha-1. Hernández (2015) recorded 17.09 Mg C ha-1 for mulch in Quercus rugosa forests.
The organic carbon data of the soil in the work described here are similar to those calculated by Ruíz (2002), who reported an average of 84.3 Mg C ha-1 at a sampling depth of 20 cm, in paddocks without trees. Bolaños et al. (2017) obtained 68 Mg C ha-1 at a sampling depth of 30 cm, similar to those of this investigation. Céspedes et al. (2012) determined 29.05 Mg C ha-1 at a sampling depth of 10 cm and 23.58 Mg C ha-1 at 20 cm in pastures, which is lower than the current figures (74.37 Mg C ha-1 at 15 cm depth of sampling). García-Olivia et al. (2006) calculated 3.6 % of C in dry forest soils of Chamela, Jalisco, a percentage close to the data gathered here. The variation of these C contents in the soil may be attributed to the management of grazing, type of soil, physiological state of the grass and the content of nutrients (Aguilar, 2007).
The total carbon obtained in the present investigation in sub-deciduous forests and paddocks (144.45 and 75.95 Mg C ha-1) is lower than that reported by Aryal et al. (2014) which is 231.67 Mg C ha-1 in secondary forests of the Yucatán Peninsula. Hernández (2015) reached 302.50 M g C ha-1 of total carbon in the temperate forest of the State of Mexico. Bolaños et al. (2017) calculated 376 Mg C ha-1 of total carbon in pine forests. Ruiz et al (2004) reported a total value of carbon stored in native grasses in Matíguas, Nicaragua of 151.4 Mg C ha-1, similar to that of this work. Aguilar (2007) determined 64.62 Mg C ha-1 in monoculture pastures in Chiapas, Mexico, which is below the results generated here.
The ranch where this research was carried out includes 24.7 ha (40 % of the total area) of forest areas, in which each hectare stores an average of 144.45 Mg C ha-1; therefore, this extension of felled forest to be used for pasture releases 257.76 Mg of CO2 ha-1. If it were decided to fell 24.65 ha of forest to plant pastures and give them the same use, it would provide 6 353.95 Mg CO2 of GHG emissions.
By means of a GHG estimate with energy equivalences, Molina (2014) quantified 93.15 Mg CO2eq. of emissions during six months during the dry season in the study ranch. Based on this contribution, 23 % of these emissions can be reduced through agroecological technologies such as the use of biodigesters, composts and silvopastoral systems. It is expected that the removal of carbon by forestry and agroforestry activities will contribute significantly to the mitigation of the remaining emissions.
Conclusions
The results here described confirm that forests have a large carbon storage capacity in their different reservoirs. Greater carbon storage was found in live aerial biomass and tree roots in the forest system than in the paddock system, due to the shortage of trees in the latter. The carbon content in the associated vegetation behaved in an inverse manner. The results show that forest ecosystems harbor a high diversity of tree species according to ecological conditions and undergo a process of natural recovery, due to the high number of individuals with DBH<10 cm.
Despite having confirmed a difference between forest areas and pastures, the organic carbon of the soil is the main reservoir of carbon, contributing more than 60 % in the former and more than 90 % in the pasture area with respect to the total carbon of the ecosystem. It is suggested to carry out carbon remeasurements in the same plots to know the removal rate of atmospheric CO2.
Acknowledgements
The authors wish to express their gratitude to the Consejo Nacional de Ciencia y Tecnología (National Council of Science and Technology) (Conacyt) for their support to the project “Estrategias de mitigación de impactos ambientales del sector agropecuario en Chiapas (381-2015)” ("Mitigation Strategies for Environmental Impacts of the Agricultural Sector in Chiapas (381-2015)". To Noé Alejandro Ruiz Orantes for the support in the laboratory work. To two anonymous reviewers for their critical observations and suggestions that significantly improved the document.
REFERENCES
Aguilar A., V. H. 2007. Almacenamiento de carbono en sistemas de pasturas en monocultivo y silvopastoriles, en dos comunidades de la Selva Lacandona, Chiapas, México. Tesis de Maestría. Universidad Autónoma Chapingo. Texcoco, Edo. de Méx., México. pp. 47-51. [ Links ]
Aryal, D. R., B. H. J. De Jong, S. Ochoa-Gaona, L. Esparza-Olguín and J. Mendoza-Vega. 2014. Carbon stocks and changes in tropical secondary forests of southern Mexico. Agriculture ecosystems and Environment 195:220-230. [ Links ]
Aryal, D. R., B. H. J. De Jong, S. Ochoa-Gaona, J. Mendoza-Vega and L. Esparza-Olguín. 2015. Successional and seasonal variation in litterfall and associated nutrient transfer in semi-evergreen tropical forests of SE Mexico. Nutrient Cycling in Agroecosystems 103(1):45-60. [ Links ]
Aryal D.R., B. H. J. de Jong, J. Mendoza-Vega, S. Ochoa-Gaona and L. Esparza-Olguín. 2017. Soil organic carbon stocks and soil respiration in tropical secondary forests in Southern Mexico. In: Damien, D. J., C. Field, L. S. Morgan and A. B. McBratney. (eds.). Global soil security. Springer. Cham, Switzerland. pp. 153-165. doi 10.1007/978-3-319-43394-3_14. [ Links ]
Balvanera, P. 2012. Los servicios ecosistémicos que ofrecen los bosques tropicales. Ecosistemas 21(1-2):136-147. [ Links ]
Basáñez A., J., J. L. Alanís y E. Badillo. 2008. Composición florística y estructura arbórea de la selva mediana subperennifolia del ejido "El Remolino", Papantla, Veracruz. Avances en Investigación Agropecuaria 12(2): 3-21. [ Links ]
Bolaños G., Y., M. A Bolaños G., F. Paz P. y J. I. Ponce P. 2017. Estimación de carbono almacenado en bosques de oyamel y ciprés en Texcoco, Estado de México. Terra Latinoamericana 35(1):73-86. [ Links ]
Cairns, M. A., S. Brown, E. H. Helmer and G. A. Baumgardner. 1997. Root biomass allocation in the world’s upland forests. Oecologia 111:1-11. [ Links ]
Cairns, M. A., I. Olmsted, J. Granados and J. Argaez. 2003. Composition and aboveground tree biomass of a dry semi-evergreen forest on Mexico´s Yucatan Peninsula. Forest Ecology and Management 186(1-3):125-132. [ Links ]
Caro D., S. J. Davis, S. Bastianoni and K. Caldeira. 2014. Global and regional trends in greenhouse gas emissions from livestock. Climatic Change 126(1-2):203-216. [ Links ]
Casanova L., F., L. Ramírez A., D. Parsons, A. Caamal M., A. T. Piñeiro V. and V. Díaz E. 2016. Environmental services from tropical agroforestry systems. Revista Chapingo Serie Ciencias Forestales y del Ambiente 22(3):269-284. doi: 10.5154/r.rchscfa.2015.06.029. [ Links ]
Céspedes F., F. E., J. A. Fernández, J. A. Gobbi y A. C. Bernardis. 2012. Reservorio de carbono en suelo y raíces de un pastizal y una pradera bajo pastoreo. Revista Fitotecnia Mexicana 35(1):79-86. [ Links ]
Chave, J., M. Réjou-Méchain, A. Búrquez, E. Chidumayo, M. S. Colgan, W. B. C. Delitti, A. Duque, T. Eid, P. M. Fearnside, R. C. Goodman, M. Henry, A. Martínez-Yrízar, W. Mugasha, H. Muller-Landau, M. Mencuccini, B. W. Nelson, A. Ngomanda, E. M. Nogueira, E. Ortiz-Malavassi, R. Pélissier, P. Ploton, C. M. Ryan, J. G. Saldarriaga and G. Vieilledent. 2015. Improved allometric models to estimate the aboveground biomass of tropical trees. Global Change Biology 20(10):3177-3190. [ Links ]
Chazdon R. L. 2008. Beyond deforestation: restoring forests and ecosystem services on degraded lands. Science 320(5882):1458-1460. doi: 10.1126/science.1155365. [ Links ]
Chazdon R. L., B. Finegan, R. S. Capers, B. Salgado-Negret. F. Casanoves, V. Boukili and N. Norden. 2010. Composition and dynamics of functional groups of trees during tropical forest succession in northeastern Costa Rica. Biotropica 42(1):31-40. [ Links ]
Comisión Nacional Forestal (Conafor). 2015. Inventario Nacional Forestal y de Suelos. Procedimientos de muestreo. Comisión Nacional Forestal. Guadalajara, Jal., México. 261 p. [ Links ]
De Jong, B. H., M. A. Cairns, P. K. Haggerty, N. Ramírez-Marcial, S. Ochoa-Gaona, J. Mendoza-Vega, M. González-Espinosa and I. March-Mifsut. 1999. Land-use change and carbon flux between 1970s and 1990s in central highlands of Chiapas, Mexico. Environmental Management 23(3):373-285. [ Links ]
De Jong, B., C. Anaya, O. Masera, M. Olguín, F. Paz, J. Etchevers, R. D. Martínez, G. Guerrero and C. Balbontín. 2010. Greenhouse gas emissions between 1993 and 2002 from land-use change and forestry in Mexico. Forest Ecology and Management 260(10):1689-1701. doi.org/10.1016/j.foreco.2010.08.011. [ Links ]
Eaton, J. M. and D. Lawrence. 2006. Woody debris stocks and fluxes during succession in a dry tropical forest. Forest Ecology and Management 232(1-3):46-55. [ Links ]
Flamenco-Saldoval, A., M. Martínez R. and O. R. Masera. 2007. Assessing implications of land-use and land-cover change dynamics for conservation of a highly diverse tropical rain forest. Biological Conservation 138(1-2):131-145. [ Links ]
Fonseca, W., J. M. Rey B. and F. E. Alice. 2011. Carbon accumulation in biomass and soil of different aged secondary forests in the humid tropics of Costa Rica. Forest Ecology and Management 262(8):1400-1408. [ Links ]
García-Oliva, F., J. F. Gallardo L., N. M. Montaño and P. Islas. 2006. Soil carbon and nitrogen dynamics followed by a forest-to-pasture conversion in western Mexico. Agroforestry Systems 66(2):93-100. [ Links ]
Gerber, P. J., H. Steinfeld, B. Henderson, A. Mottet, C. Opio, J. Dijkman, A. Falcucci and G. Tempio. 2013. Tackling climate change through livestock: A global assessment of emissions and mitigation opportunities. Food and Agriculture Organization of the United Nations (FAO). Rome, Italy. 115 p. [ Links ]
González-Espinosa, M., N. Ramírez-Marcial, L. Galindo-Jaimes, A. Camacho-Cruz, D. Golicher, L. Cayuela y J. M. Rey-Benayas. 2009. Tendencias y proyecciones del uso del suelo y la diversidad florística en Los Altos de Chiapas, México. Investigación Ambiental Ciencia y Políticas Públicas 1(1):40-53. [ Links ]
Google Earth. 2015. El Sabino Villaflores, Rancho Flamboyanes.16o23’51’’ N, 93o11’45’’ O. Capa de lugares y relieve. Digital Globe Images. http://www.earth.google.com . (1 de abril de 2018). [ Links ]
Hernández M., O. E. 2015. Estimación de los almacenes de carbono en bosque templado, caso de estudio predio particular “CEBATI” municipio de San José del Rincón, Estado de México. Conacyt-Semarnat 107956. México, D.F., México. pp. 66-72. [ Links ]
Ibrahim, M., M. Chacón, C. Cuartas, J. Naranjo, G. Ponce, P. Vega, F. Casasola y J. Rojas. 2006. Almacenamiento de carbono en el suelo y la biomasa arbórea en sistemas de usos de la tierra en paisajes ganaderos de Colombia, Costa Rica y Nicaragua. Agroforestería en las Américas 45:27-37. [ Links ]
Instituto Nacional de Estadística y Geografía (INEGI). 2012. Inventario Nacional de Viviendas 2012, Marco geoestadístico, datos vectoriales. Instituto Nacional de Estadística y Geografía. http://www.inegi.org.mx/geo/contenidos/geoestadistica/m_geoestadistico.aspx (1 de abril de 2018). [ Links ]
Kauffman, J. B., H. Hernández T., M. Jesús G., C. Heider and W. M. Contreras. 2016. Carbon stocks of mangrove and losses arising from their conversion to cattle pastures in the Pantanos de Centla, Mexico. Wetlands Ecology and Management 24(2):203-216. [ Links ]
Lamb, A., R. Green, I. Bateman, M. Broadmeadow, T. Bruce, J. Burney, P. Carey, D. Chadwick, E. Crane, R. Field, K. Goulding, H. Griffiths, A. Hastings, T. Kasoar, D. Kindred, B. Phalan, J. Pickett, P. Smith, E. Wall, E. Ermgassen and A. Balmford. 2016. The potential for land sparing to offset greenhouse gas emissions from agriculture. Nature Climate Change 6:488-492. [ Links ]
Liu, Y. Y., A. I. M. van Dijk, R. A. M. de Jeu, J. G. Canadell, M. F. McCabe, J. P. Evans and G. Wang. 2015. Recent reversal in loss of global terrestrial biomass. Nature Climate Change 5:470-474. [ Links ]
Martínez-Sánchez, J. L., B. J. Tiger, L. Cámara and O. Castillo. 2015. Relationship between structural diversity and carbon stocks in humid and sub-humid tropical forest of Mexico. Écoscience 22(2-4):125-131. [ Links ]
Miles, L. and V. Kapos. 2008. Reducing greenhouse gas emissions from deforestation and forest degradation: global land-use implications. Science 320(5882):1454-1455. [ Links ]
Molina P., L. F. 2014. Impacto de tecnologías agroecológicas sobre la eficiencia energética y emisión de gases de efecto invernadero en un sistema ganadero. Villaflores, Chiapas. Tesis de Maestría. Facultad de Ciencias Agropecuarias, Universidad Autónoma de Chiapas. Tuxtla Gutiérrez, Chis., México. 62 p. [ Links ]
Mora, F., V. J. Jaramillo, R. Bhaskar, M. Gavito, I. Siddique, J. E. K. Byrnes and P. Balvanera. 2018. Carbon accumulation in Neotropical dry secondary forests: The roles of forest age and tree dominance and diversity. Ecosystems 21(1):536-550. [ Links ]
Nahed-Toral, J., A. Valdivieso-Pérez, R. Aguilar-Jiménez, J. Cámara-Cordova and D. Grande-Cano. 2013. Silvopastoral systems with traditional management in southeastern Mexico: a prototype of livestock agroforestry for cleaner production. Journal of Cleaner Production 57:266-279. [ Links ]
O’Mara, F. P. 2011. The significance of livestock as a contributor to global greenhouse gas emissions today and in the near future. Animal Feed Science and Technology 166-167:7-15. [ Links ]
Ochoa-Gaona, S., M. González-Espinosa, J. A. Meave and V. Sorani-Dal B. 2004. Effect of forest fragmentation on the woody flora of the highlands of Chiapas, Mexico. Biodiversity and Conservation 13:867-884. [ Links ]
Opio, C., P. Gerber, A. Mottet, A. Falcucci, G. Tempio, M. MacLeod, T. Vellinga and B. S. Henderson. 2013. Greenhouse gas emissions from ruminant supply chains - A global life cycle assessment. Food Agriculture Organization of the United Nations (FAO). Rome, Italy. 191 p. [ Links ]
Orihuela-Belmonte, D. E., B. H. J. De Jong, J. Mendoza-Vega, J. Van der Wal, F. Paz-Pellat, L. Soto-Pinto and A. Flamenco-Sandoval. 2013. Carbon stocks and accumulation rates in tropical secondary forests at the scale of community, landscape and forest type. Agriculture ecosystems and Environment 171:72-84. [ Links ]
Pompa-García, M., J. Á. Sigala R. and E. Jurado. 2017a. Some tree species of ecological importance in Mexico: a documentary review. Revista Chapingo Serie Ciencias Forestales y del Ambiente 23(2):185-219. [ Links ]
Pompa-García, M., J. A. Sigala-Rodríguez, E. Jurado and J. Flores. 2017b. Tissue carbon concentration of 175 Mexican forest species. Forest 10:754-758. doi: 10.3832/ifor2421-010. [ Links ]
Pompa-García, M. y J. A. Sigala R. 2017. Variación de la captura de carbono de especies forestales en México: una revisión. Madera y Bosques 23(2):225-235. [ Links ]
Programa de Acción ante el Cambio Climático del Estado de Chiapas (PACCCH). 2007. Inventario estatal de gases de efecto invernadero., México. Secretaría de Medio Ambiente e Historia Natural. Tuxtla Gutiérrez, Chis., México. 137 p. [ Links ]
Ruíz G., A. 2002. Fijación y almacenamiento de carbono en sistemas silvopastoriles y competitividad económica en Matiguás, Nicaragua. CATIE. Turialba, Costa Rica. 105 p. [ Links ]
Ruiz, A., M. Ibrahim, B. Locatelli, H. J. Andrade y J. Beer. 2004. Fijación y almacenamiento de carbono en sistemas silvopastoriles y competitividad económica de fincas ganaderas en Matiguás, Nicaragua. Agroforestería en las Américas 41-42: 16-21. [ Links ]
Rocha-Loredo, A. G., N. Ramírez-Marcial y M. González-Espinosa. 2010. Riqueza y diversidad de árboles del bosque tropical caducifolio en la depresión central de Chiapas. Boletín de la Sociedad Botánica de México 87:89-103. [ Links ]
Statsoft. 2007. Statistica 7.0. Statsoft Inc. http://www.statsoft.com/Products/STATISTICA-Features (12 de febrero de 2017) [ Links ]
Soto-Pinto L., M. Anzueto, J. Mendoza, G. Jimenez-Ferrer and B. de Jong. 2010. Carbon sequestration through agroforestry in indigenous communities of Chiapas, Mexico. Agroforestry Systems 78:39-51. [ Links ]
Taylor A., N. E. 2016. Estructura y composición de bosques en paisajes manejados de Los Altos de Chiapas. Tesis de Maestría en Ciencias en Recursos Naturales y Desarrollo Rural. El Colegio de la Frontera Sur. San Cristóbal, Chis., México. pp. 14-19. [ Links ]
Torres-Rivera, J. A., W. Espinoza-Domínguez, L. Reddiar-Krishnamurthy y A. Vázquez-Alarcón. 2011. Secuestro de carbono en potreros arbolados, potreros sin árboles y bosque caducifolio de Huatusco, Veracruz. Tropical and Subtropical Agroecosystems 13(3):543-549. [ Links ]
Trilleras, J. M., V. J. Jaramillo, E. Vega and P. Balvanera. 2015. Effects of livestock management on the supply of ecosystem services in pastures in a tropical dry region of Western Mexico. Agriculture ecosystems and Environment 211:133-144. [ Links ]
Villanueva-López, G., P. Martínez-Zurimendi, L. Ramírez-Avilés, D. R. Aryal and F. Casanova-Lugo. 2016. Live fences reduce the diurnal and seasonal fluctuations of soil CO2 emissions in livestock systems. Agronomy for Sustainable Development 36:23-30. doi 10.1007/s13593-016-0358-x. [ Links ]
Received: January 31, 2018; Accepted: June 08, 2018
 Este es un artículo publicado en acceso abierto bajo una licencia Creative Commons
