


Serviços Personalizados
Journal
Artigo
 texto em
  Inglês (pdf)
 Artigo em XML
 Referências do artigo
 Enviar este artigo por email
Indicadores
-
 Citado por SciELO
 -
 Acessos
Links relacionados
-
 Similares em
SciELO
Similares em
SciELO
Compartilhar

 Permalink
Revista mexicana de ciencias forestales
versão impressa ISSN 2007-1132
Rev. mex. de cienc. forestales vol.9 no.48 México Jul./Ago. 2018
https://doi.org/10.29298/rmcf.v8i48.123
Articles
Nutritional status and growth of a Pinus cooperi Blanco plantation fertilized with N-P-K
1División de Ingeniería Forestal, Instituto Superior de Zacapoaxtla. México.
2Posgrado en Ciencias Forestales, Colegio de Postgraduados. México.
Timber production in Mexico has decreased dramatically, while demand has increased in recent years. The productivity of the forest depends on various environmental factors, including solar radiation, temperature, water and nutrient availability. The present research studied the effect of chemical fertilization (N, P and K) on the growth of seedlings of Pinus cooperi two years after its establishment in field. We included three doses of urea (N: 0.0, 4.0, 8.0), three of simple calcium superphosphate (P: 0.0, 3.5, 7.0), and three of potassium sulphate (K: 0.0, 3.28, 6.5) grams tree-1. The combination of the levels of the three tested nutrients corresponded to 27 treatments, which were applied to the seedlings with an average height of 80 cm. It was determined that the nitrogen probably limits the growth of Pinus cooperi in the plantation site. The application of phosphorus generated the largest increase in basal diameter, indicating that it is the most deficient nutrient in the area. It was determined that potassium has no positive effect on the diameter or the height of the trees, which suggests a satisfactory level of availability.
Key words: Nutritional diagnosis; basal diameter; nutritional status; chemical fertilization; nutrient; pine
La producción de madera en México ha disminuido drásticamente, mientras la demanda se ha incrementado en los últimos años. La productividad del bosque depende de varios factores ambientales, como la radiación solar, temperatura, agua y disponibilidad de nutrimentos, entre otros. En la presente investigación se estudió el efecto de la fertilización química (N, P y K) sobre el crecimiento de brinzales de Pinus cooperi, a dos años de su establecimiento en campo. Se incluyeron tres dosis de urea (N: 0.0, 4.0, 8.0); tres de superfosfato simple de calcio (P: 0.0, 3.5, 7.0); y tres de sulfato de potasio (K: 0.0, 3.28, 6.5) gramos árbol-1. La combinación de los niveles de los tres nutrimentos probados produjo 27 tratamientos, mismos que se aplicaron a los brinzales, con una altura promedio de 80 cm. Se determinó que el nitrógeno, probablemente, limita el crecimiento de Pinus cooperi en el sitio de plantación. La aplicación de fósforo generó el mayor incremento de diámetro basal, lo que indica que es el nutrimento más deficiente en el área de estudio. Se determinó que el potasio no tiene efecto positivo en el diámetro ni en la altura de los árboles, lo cual implica que este presenta un nivel satisfactorio de disponibilidad.
Palabras claves: Diagnóstico nutrimental; diámetro basal; estado nutrimental; fertilización química; nutrimento; pino
Introduction
In recent years, the timber production in Mexico has decreased dramatically due, at least in part, to extremely long rotation periods currently adopted, as well as to failures in the management of forests (Semarnat, 2010). There are several options to improve this situation; one of them is chemical fertilization.
An appriopriate fertilization system produces positive effects, since a better nutrition of the plants will increase their growth and yield (Kozlowski and Pallardi, 1997; Lambers et al., 1998). In recent years, tree planters have adopted chemical fertilization of the plantations because this practice makes it possible to reduce rotation periods in species of both slow and fast growth, and therefore higher timber and financial yields can be obtained (Fox et al., 2007).
The availability of nutrients can be directly modified by implementing treatments like fertilization, or indirectly changed by means of silvicultural practices (Binkley, 1993). The fertilization not only has an impact on productivity or on the growth rates; but also when well-balanced programs are designed, the nutritional status of the trees gets improved, and trees become more vigorous and resistant to pests (López-López and Estañol-Botello, 2007; Pérez-Camacho et al., 2013; Calixto et al., 2015). In order to attain high growth rates, trees need macronutrients especially; however, micronutrients are essential too.
Pinus cooperi Blanco is a tree with a height of 20 to 30 meters and a diameter of 40 to 75 cm (Perry, 1991). It is widely distributed in the state of Durango and the southwestern region of Chihuahua (Martínez, 1992). Its absolute rotation cycles range between 30 and 50 years (Vargas-Larreta et al., 2010). A balanced fertilization regime makes it possible to reduce rotation periods and increase growth rates (Pérez-Camacho et al., 2013).
The present study was conducted in order to determine the effects of chemical fertilization on the growth of seedlings of Pinus cooperi two years after the plantation was established. The effects of N, P and K on the growth in height and diameter were evaluated, and the most limiting nutrient, i.e. the one whose application improves the growth of the trees, was identified.
Materials and Methods
The experiment was conducted from October 2012 to January 2014, in Molinillos, Durango, Dgo., within a two year-old P. cooperi plantation. The study site is located at the coordinates 23°38'10.75" N and 105°3'1.07" W.
A complete randomized experimental design was used, with a 33 factorial design. N, P and K were the three tested factors and they were applied in three doses (levels), the combination of which resulted in a total of 27 treatments (Table 1) that were replicated ten times. The tested nutrients and doses were nitrogen (N: 0, 4, 8 g of urea), phosphorus (P: 0, 3.5, 7 g of simple calcium superphosphate), and potassium (K: 0, 3.28, 6.5 g of potassium sulphate) per tree. The doses of N, P and K were established by using the rational method of Rodríguez-Suppo (Opazo et al., 2008), adapted for leaf concentrations.
Table 1 Treatments applied in the chemical fertilization experiment in Molinillos, Durango, Dgo.
| Treatment | Urea (g tree -1 ) |
SCS (g tree -1 ) |
Potassium sulphate (g tree -1 ) |
|---|---|---|---|
| 1 | 0.0 | 0.0 | 0.00 |
| 2 | 0.0 | 0.0 | 3.28 |
| 3 | 0.0 | 0.0 | 6.50 |
| 4 | 0.0 | 3.5 | 0.00 |
| 5 | 0.0 | 3.5 | 3.28 |
| 6 | 0.0 | 3.5 | 6.50 |
| 7 | 0.0 | 7.0 | 0.00 |
| 8 | 0.0 | 7.0 | 3.28 |
| 9 | 0.0 | 7.0 | 6.50 |
| 10 | 4.0 | 0.0 | 0.00 |
| 11 | 4.0 | 0.0 | 3.28 |
| 12 | 4.0 | 0.0 | 6.50 |
| 13 | 4.0 | 3.5 | 0.00 |
| 14 | 4.0 | 3.5 | 3.28 |
| 15 | 4.0 | 3.5 | 6.50 |
| 16 | 4.0 | 7.0 | 0.00 |
| 17 | 4.0 | 7.0 | 3.28 |
| 18 | 4.0 | 7.0 | 6.50 |
| 19 | 8.0 | 0.0 | 0.00 |
| 20 | 8.0 | 0.0 | 3.28 |
| 21 | 8.0 | 0.0 | 6.50 |
| 22 | 8.0 | 3.5 | 0.00 |
| 23 | 8.0 | 3.5 | 3.28 |
| 24 | 8.0 | 3.5 | 6.50 |
| 25 | 8.0 | 7.0 | 0.00 |
| 26 | 8.0 | 7.0 | 3.28 |
| 27 | 8.0 | 7.0 | 6.50 |
SCS = Single calcium superphosphate.
Granulated fertilizing materials were applied in a localized pattern on the dropping zone of the seedlings. The evaluated variables included the basal diameter (BD) and the total height (TH) of the trees. The basal diameter was measured at the beginning and at the end of the experimental period at the base of the stem, at a height of less than four centimeters, with a TruperTM digital caliper, on a mark made previously with a permanent marker. Total height was obtained on the same dates as the basal diameter with a calibrated ruler (Tlefix MT751), from the soil surface to the tip of the main shoot. The increases in basal diameter (IBD) and total height (ITH) attained between the years 2012 and 2014 were estimated using the above variables as a reference. A graphical vector analysis was used to study the nutrient status of the seedlings in response to the treatments (Timmer and Stone, 1978). For this purpose, we determined the dry weight of 100 needles (DW 100), which we collected on January 15, 2004, from the middle part of the fully expanded, non-senescent twigs located in the upper third of the crown of the seedlings of each sample (Wells and Allen, 1985).
100 groups of needles were dried during 48 hours in a FELISA forced circulation oven at 70 oC, and subsequently sent to the “Salvador Alcalde Blanco” Laboratory of the Colegio de Postgraduados (College of Postgraduates), in order to determine the nitrogen (N) content with the micro-Kjeldahl method, as well as the phosphorus (P) and potassium contents (K), using diacid digestion, and an inductively coupled plasma spectrophotometer (ICP).
For data analysis, the diameter and total height variables and their respective increases, as well as the dry weight of 100 needles, were interpreted using a variance analysis (ANOVA) and Tukey tests. The concentrations of nitrogen, phosphorus and potassium were subjected to an ANOVA and a vector analysis (Timmer and Stone, 1978).
Results and Discussion
Basal diameter (2014 BD)
The variance analysis (ANOVA) for the 2014 basal diameter showed significant effects of P and the P*K interaction (Table 2). This was confirmed by the Tukey test (α =0.05), which, in addition, indicated that the application of N and K caused no significant effects (Figure 1). The above leads to the conclusion that the P is a nutrient that determines the growth of the species in the study area (Garrison-Jhonston et al., 2005).
Table 2 Variance analysis for the 2014 Basal Diameter (BD) in the Pinus cooperi Blanco fertilization experiment in Molinillos, Durango, Dgo.
| Treatment | Degrees of freedom |
Sum of squares |
Mean squares |
Tabulated F value |
Pr > F |
|---|---|---|---|---|---|
| Model | 26 | 5 455.415 | 209.82365 | 1.89 | 0.0076 |
| N | 2 | 325.03462 | 162.51731 | 1.46 | 0.2334 |
| P | 2 | 720.6114 | 360.3057 | 3.25 | 0.0408 |
| K | 2 | 189.45361 | 94.726804 | 0.85 | 0.4272 |
| N*P | 4 | 478.3622 | 119.59055 | 1.08 | 0.3683 |
| N*K | 4 | 969.09733 | 242.27433 | 2.18 | 0.0718 |
| P*K | 4 | 1 695.9106 | 423.97765 | 3.82 | 0.005 |
| N*P*K | 8 | 1 076.9453 | 134.61816 | 1.21 | 0.2922 |
| Error | 218 | 24 185.966 | 110.9448 | ||
| Total | 244 | 29 641.381 |

2014 Total Height (TH 2014)
In the case of the total height of 2014, the analysis showed that the tested factors produce no significant effects (Table 3, Figure 1). This may be due to a high variability of the height of the seedlings between experimental units, which in turn were a result of the system of reproduction of the species in the nursery (from seeds), since the germplasm used in the local nurseries generally lacks a strict quality control (Gülcü and Bilir, 2017). Even when there were no significant effects, the Tukey test for the variable total height 2014 exhibited a trend which indicates (Figure 1) that the average dose of N generated the greatest height, i.e., that N is a deficient nutrient, at least partially in this area, as the height of seedlings responded favorably, though not significantly, to its application.
Table 3 Variance analysis for the Total Height (TH) 2014 in the fertilization experiment of Pinus cooperi Blanco in Molinillos, Durango, Dgo.
| Treatment | Degrees of freedom |
Sum of squares |
Mean squares |
Tabulated F value |
Pr > F |
|---|---|---|---|---|---|
| Model | 26 | 20 314.299 | 781.3192 | 1.17 | 0.2706 |
| N | 2 | 419.30035 | 209.65018 | 0.31 | 0.7316 |
| P | 2 | 939.50653 | 469.75326 | 0.7 | 0.497 |
| K | 2 | 103.67143 | 51.835714 | 0.08 | 0.9256 |
| N*P | 4 | 1 840.8895 | 460.22238 | 0.69 | 0.6016 |
| N*K | 4 | 5 142.222 | 1 285.5555 | 1.92 | 0.1082 |
| P*K | 4 | 5 426.4853 | 1 356.6213 | 2.03 | 0.0919 |
| N*P*K | 8 | 6 442.224 | 805.278 | 1.2 | 0.2987 |
| Error | 218 | 146 008.9 | 669.7656 | ||
| Total | 244 | 166 323.2 |
Dry weight of 100 needles (DW 100)
The dry weight of 100 needles (DW 100) was not significantly affected by the application of fertilizers, except in the case of K (Table 4). An increase in the weight of the needles was expected with the application of some of the fertilization treatments, because a tree with an adequate nutrition tends to grow more quickly than those trees that are deficient in nutrients. In such case, the increase in the growth is reflected mainly in the basal diameter and total height or in the diameter at breast height, although, in general, there is an increase in the size of the needles (Weetman, 1989).
Table 4 Variance analysis for the dry weight (DW) of the 2014 needles in the Pinus cooperi Blanco chemical fertilization experiment in Molinillos, Durango, Dgo.
| Treatment | Degrees of freedom |
Sum of squares |
Mean squares |
Tabulated F value |
Pr > F |
|---|---|---|---|---|---|
| Model | 26 | 83.200989 | 3.200038 | 1.58 | 0.079 |
| N | 2 | 1.9018056 | 0.9509028 | 0.47 | 0.6278 |
| P | 2 | 0.7640489 | 0.3820245 | 0.19 | 0.8286 |
| K | 2 | 14.381933 | 7.1909666 | 3.55 | 0.0357 |
| N*P | 4 | 15.709195 | 3.9272988 | 1.94 | 0.1173 |
| N*K | 4 | 11.868496 | 2.9671239 | 1.47 | 0.2258 |
| P*K | 4 | 15.508375 | 3.8770938 | 1.92 | 0.1215 |
| N*P*K | 8 | 23.067135 | 2.8833919 | 1.42 | 0.2082 |
| Error | 53 | 107.30225 | 2.0245707 | ||
| Total | 79 | 190.50324 |
The Tukey test (α=0.05) indicates that the doses of N and P did not have a significant effect on the dry weight of 100 needles (Figure 2). On the other hand, there were differences between doses zero and one of K; of these, the first proved to be the better, i.e. the application of potassium had a negative impact on the growth of needles. This means that potassium is a nutrient found in sufficient quantities in the study site, and its application probably generates an imbalance (excess) with respect to the most deficient nutrients (López-López and Alvarado-López, 2010).

Increments in basal diameter (IBD) and total height (ITH)
The analysis for the increment in basal diameter between the assessment dates (2012-2014) showed significant effects of the tested nutrients on this variable, especially of N and the N*P and P*K interactions (Table 5). N promoted significant differences in the IBDs between levels zero and one. P had no significant effect on any of the three tested levels; this was also the case with K (Figure 3), which probably had a negative effect on the increment in the basal diameter.
Table 5 Variance analysis for the increment in the 2014 basal diameter (IBD) in the Pinus cooperi Blanco chemical fertilization experiment in Molinillos, Durango, Dgo.
| Treatment | Dregrees of freedom |
Sum of squares |
Mean squares |
Tabulated F values |
Pr > F |
|---|---|---|---|---|---|
| Model | 26 | 317.53597 | 12.212922 | 3.21 | 0.0001 |
| N | 2 | 58.402417 | 29.201208 | 7.67 | 0.0011 |
| P | 2 | 21.318751 | 10.659376 | 2.8 | 0.0688 |
| K | 2 | 0.8707197 | 0.4353598 | 0.11 | 0.8921 |
| N*P | 4 | 66.933676 | 16.733419 | 4.4 | 0.0035 |
| N*K | 4 | 33.625564 | 8.4063911 | 2.21 | 0.0788 |
| P*K | 4 | 81.482436 | 20.370609 | 5.35 | 0.0009 |
| N*P*K | 8 | 54.902402 | 6.8628003 | 1.8 | 0.0942 |
| Error | 60 | 228.39283 | 3.8065472 | ||
| Total | 86 | 545.9288 |

For a nutrient, equal letters signify statistically equal means.
Figure 3 Tukey tests (α =0.05) for the increments registered between 2012 and 2014, in the Pinus cooperi Blanco fertilization experiment in Molinillos, Durango, Dgo.
The increment in total height did not significantly differ between the tested factors (nutrients), except in their interactions (Table 6). Only N with dose one exceeded the zero level. The height of the trees is largely variable, and this feature may have been the reason for the confused effects between of the tested treatments. López-López and Flores-Nieves (2016) reported similar results with regard to the increment in height.
Table 6 Variance analysis for the increment in total height (ITH) 2014 in the Pinus cooperi Blanco fertilization experiment in Molinillos, Durango, Dgo.
| Treatment | Degrees of freedom |
Sum of squares |
Mean squares |
Tabulated F value |
Pr > F |
|---|---|---|---|---|---|
| Model | 26 | 4 437.7514 | 170.68275 | 4.48 | <.0001 |
| N | 2 | 81.773058 | 40.886529 | 1.07 | 0.3486 |
| P | 2 | 41.959632 | 20.979816 | 0.55 | 0.5794 |
| K | 2 | 130.32988 | 65.164941 | 1.71 | 0.1898 |
| N*P | 4 | 725.21243 | 181.30311 | 4.76 | 0.0022 |
| N*K | 4 | 1 140.5218 | 285.13046 | 7.49 | <.0001 |
| P*K | 4 | 909.61082 | 227.40271 | 5.97 | 0.0004 |
| N*P*K | 8 | 1 408.3437 | 176.04297 | 4.62 | 0.0002 |
| Error | 56 | 2 131.7667 | 38.067262 | ||
| Total | 82 | 6 569.5181 |
Foliar analyses
Most of the applied treatments (except three of them) generated a lower dry weight of needles than the control (Figure 4). This highlights the importance of carefully defining the fertilization nutrients and doses before applying them, since not all treatments generate positive results (Sumner, 1977; Moreno et al., 2002).
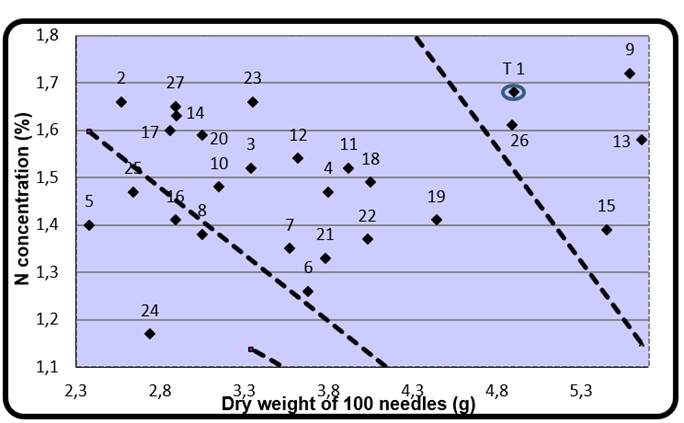
Figure 4 Timmer diagram for the analysis of N in the Pinus cooperi Blanco chemical fertilization experiment in Molinillos, Durango, Dgo.
The critical concentrations in Pinus cooperi are unknown, but Figure 4 shows higher concentrations of N (which in the control treatment are approximately 1.7 %) than the mean concentrations in nursery-grown conifers (0.87 %), according to the data presented by Hernández and Torres (2009). This is the case even when the nutrient concentrations in the tissues of the nursery-grown plants are higher than those of individuals grown in the final sites, due to the intensive management provided in the nursery.
This means that N is probably not a deficient nutrient in the study area, or that its deficiency is rather slight. It is worth noting that even with the application of N, its concentrations in the foliage remained at levels similar to or lower than those of the control plants. The above indicates that there was loss of soil N, possibly due to vaporization or leaching. The nitrogen fertilizing material utilized was urea, which in the soil is converted into ammonium —a radical prone to vaporization (Binkley, 1993; Schlesinger, 1997). As for phosphorus (Figure 5), leaf concentrations in most of the treatments were lower (0.096 %) than the average critical concentrations registered by Hernández and Torres (2009) for nursery-grown Mexican conifers (0.16 %).
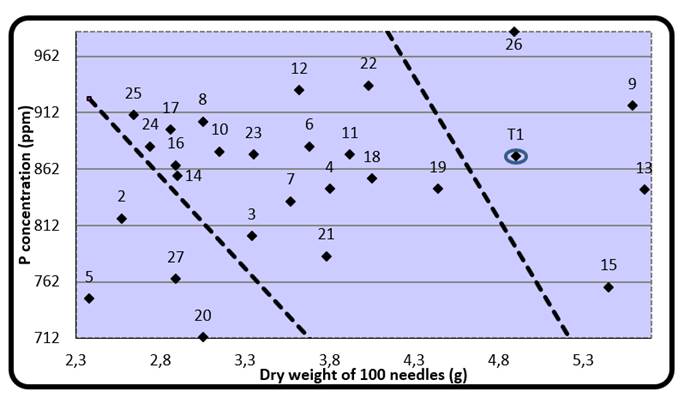
Figure 5 Timmer diagram for the analysis of P in the chemical fertilization experiment of Pinus cooperi Blanco in Molinillos, Durango, Dgo.
Therefore, the P is a nutrient that determines growth in the study site. This matches the positive effect described for the application of P on basal diameter grwth. Consistent with this finding, all treatments that produced higher dry weights of needles than those of the control saplings included a dosis of P (Figure 5), which, according to López-López and Alvarado-López (2010), corresponds to Timmer’s vectors (Timmer and Stone, 1978 ) such as +,+,+, or +,-,+. López-López and Alvarado-López (2010) point out that this type of vectors is indicative of deficiency of the nutrient before its application.
However, the concentrations of K were lower (<0.2237 %) than the mean concentrations of K in the foliage of conifers (0.55 %) (Hernández and Torres, 2009). In general, leaf concentrations of K in the present experiment was increased by applying this nutrient (Figure 6). This implies that K is not limiting the growth and that there is another factor that favors an effect of K concentration in the foliage (López-López and Alvarado-López, 2010). This diagnose agrees with the significant negative impact of K on the dry weight of 100 needles (Figure 2).
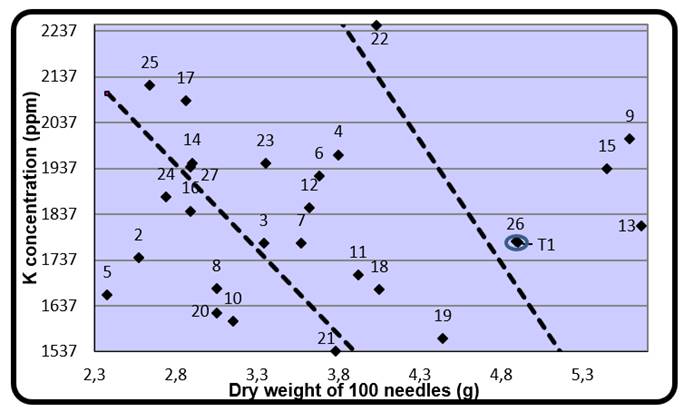
Figure 6 Timmer diagram for the analysis of K in the Pinus cooperi Blanco chemical fertilization experiment in Molinillos, Durango, Dgo.
The fact that K, still present in low concentrations in the foliage, had no positive effects on growth when applied means that the nutrient status of the trees must be based on a comprehensive analysis of several nutrients. An individual analysis of the concentrations of K in the foliage of Pinus cooperi would have led to the conclusion that it is deficient in the study site, and that its application would result in increment in growth; however, due to the presence of another deficiency, probably more severe than that of K, probably that of P, such a recommendation would be incorrect.
According to the results of this research, the application of a high dose of P, an intermediate dose of N and a low dose of potassium K can be recommended for the study site. This strategy would amend the most limiting nutrient deficiency (P), increase the availability of the slightly deficient nutrient (N) and increase the availability of the least deficient one (K), while the application of P alone might cause both N and K to become deficient, according to Liebig’s law of the minimum.
Conclusions
The nutrient that most increased basal diameter was phosphorus, in the high dose. The study site presents P deficiency, since the basal diameter increases with higher doses. The application of the intermediate dose of nitrogen (4 g tree-1) generates a greater increase in height in Pinus cooperi seedlings. Potassium has no positive effect on the evaluated variables. The deficient nutrients are nitrogen and phosphorus. Fertilization does not always guarantee an improvement in the rates of growth of the trees; on the contrary, this practice can reduce yields when the non-limiting nutrients are applied.
Referencias
Binkley, D. 1993. Nutrición forestal: Prácticas de manejo. Editorial Limusa. Grupo Noriega Editores. México, D.F., México. 340 p. [ Links ]
Calixto, C. G., M. Á. López, A. Equihua, D. E. Lira y V. M. Cetina. 2015. Crecimiento de Cedrela odorata e incidencia de Hypsipyla grandella en respuesta al manejo nutrimental. Bosque 36(2): 265-273. doi: 10.4067/50717-92002015000200012. [ Links ]
Fox, T. R., H. L. Allen, T. J. Albaugh, R. Rubilar and C. A. Carlson. 2007. Tree nutrition and forest fertilization of pine plantations in the Southern United States. Southern Journal of Applied Forestry 31(1): 5-11. [ Links ]
Garrison-Johnston, M. T., T. M. Shaw, P. G. Mika and L. R. Johnson. 2005. Management of ponderosa pine nutrition through fertilization. USDA Forest Service Gen. Tech. Rep. PSW-GTR-198.Albany, CA USA. pp. 123-143. [ Links ]
Gülcü, S. and N. Bilir. 2017. Growth and survival variation among scots pine (Pinus sylvestris L.) provenances. Intrnational Journal of Genomics (1):1-7. [ Links ]
Hernández, P. F. y Torres, L. S. (2009). Niveles críticos nutrimentales preliminares para especies forestales de México a nivel de vivero. Tesis Profesional, DICIFO, Universidad Autónoma Chapingo. 151 p. [ Links ]
Kozlowski, T. T. and S. G. Pallardi. 1997. Physiology of woody plants. 2nd ed. Academic Press. San Diego, CA USA. 411 p. [ Links ]
Lambers, H., F. S. Chapin III and T. L. Pons. 1998. Physiological Plant Ecology. Springer. New York, NY USA. 540 p. [ Links ]
López-López, M. Á. y J. Alvarado-López. 2010. Interpretación de nomogramas de análisis de vectores para diagnóstico nutrimental de especies forestales. Madera y Bosques 16(1): 99-108. http://www.scielo.org.mx/scielo.php?script=sci_arttext&pid=S1405-04712010000100007&lng=es&nrm=iso >. ISSN 1405-0471 (20 de octubre de 2016). [ Links ]
López-López, M. Á. y E. Estañol-Botello. 2007. Detección de deficiencias de hierro en Pinus leiophylla a partir de los efectos de dilución y concentración nutrimental. Terra Latinoamericana 25(1): 9-15. https://www.researchgate.net/publication/262560735_ (17 de septiembre de 2017). [ Links ]
López-López, M. A. y P. Flores-Nieves. 2016. Captura de carbono en bosques, en relación con la densidad de arbolado y fertilización química. In: Paz, P. F. y A. R. Torres (eds.). Estado actual del conocimiento del ciclo del carbono y sus interacciones en México: Síntesis a 2016. Programa Mexicano del Carbono-Universidad Autónoma del Estado de Hidalgo. Texcoco, Edo. de Méx., México. pp. 716-723. [ Links ]
Martínez, M. 1992. Los Pinos Mexicanos. 3a ed. Ediciones Botas. México, D.F., México. 361 p. [ Links ]
Moreno Ch., L. R., M. Á. López L., E. Estañol B. y A. Velázquez M. 2002. Diagnóstico de necesidades de fertilización de Abies religiosa (H. B. K.) Schl. et Cham. en vivero mediante el DRIS. Madera y Bosques 8(1): 51-60. http://www.redalyc.org/pdf/617/61789904.pdf (24 de mayo de 2017). [ Links ]
Opazo A., J. D., A. Luchsinger L. y O. Neira V. 2008. Factores de suelo y planta para determinar la fertilización nitrogenada en maíz dulce en la zona central de Chile. IDESIA (Chile) 26(2): 53-58. http://www.scielo.cl/pdf/idesia/v26n2/art07.pdf (24 de mayo de 2017). [ Links ]
Pérez-Camacho, M., M. Á. López-López, A. Equihua-Martínez, V. M. Cetina-Alcalá and J. T. Méndez-Montiel. 2013. Relationships between site factors and bark beetle attack on pine trees. Journal of Biological Sciences 13(7): 621-627. doi: 10.3923/jbs.2013.621.627. [ Links ]
Perry, P. J. 1991. The Pines of Mexico and Central America. Timber Press. Portland, OR USA. 107 p. [ Links ]
Schlesinger, W. H. 1997. Biogeochemistry: An analysis of global change. 2nd ed. Academic Press. San Diego, CA, USA. 588 p. [ Links ]
Secretaría del Medio Ambiente y Recursos Naturales (Semarnat). 2010. Anuario estadístico de la producción forestal 2010. http://www.semarnat.gob.mx/archivosanteriores/temas/gestionambiental/forestalsuelos/Anuarios/ANUARIO_2010.pdf (15 de octubre de 2014). [ Links ]
Sumner, M. E. 1977. Preliminary N P K foliar diagnostic norms for wheat. Communications in Soil Science and Plant Analysis 8(2): 148-167. doi: 10.1080/00103627709366709. [ Links ]
Timmer, V. R. and E. L. Stone. 1978. Comparative foliar analysis of young balsam fir fertilized with nitrogen, phosphorus, potassium, and lime. Soil Science Society of America Journal 42: 125-130. [ Links ]
Vargas-Larreta, B., J. G. Álvarez-González, J. J. Corral-Rivas y O. A. Aguirre-Calderón. 2010. Construcción de curvas dinámicas de índice de sitio para Pinus cooperi Blanco. Revista Fitotecnia Mexicana 33(4): 343-351. http://www.redalyc.org/articulo.oa?id=61015520008 (17 de octubre de 2016). [ Links ]
Weetman, G. F. 1989. Graphical vector analysis technique for testing stand nutritional status. In: Dyck, W. J. and C. A. Mees (eds.). Research Strategies for Long-term Site Productivity. Research Institute, New Zealand Bulletin. Proceedings, IEA/BE A3 Workshop. IEA/BE A3 Report No. 8. Forest. Seattle, WA USA. pp. 93-109. [ Links ]
Wells, C. and L. Allen. 1985. When and where apply fertilizer? A loblolly pine management guide. USDA Forest Service. Gen. Tech. Rep. SE-36. http://www.srs.fs.usda.gov/pubs/gtr/gtr_se036.pdf (17 de octubre de 2016). [ Links ]
Received: October 18, 2017; Accepted: May 31, 2018
 Este es un artículo publicado en acceso abierto bajo una licencia Creative Commons
