


Services on Demand
Journal
Article
 text in
  English (pdf)
 Article in xml format
 Article references
 Send this article by e-mail
Indicators
-
 Cited by SciELO
 -
 Access statistics
Related links
-
 Similars in
SciELO
Similars in
SciELO
Share

 Permalink
Revista mexicana de ciencias forestales
Print version ISSN 2007-1132
Rev. mex. de cienc. forestales vol.9 n.48 México Jul./Aug. 2018
https://doi.org/10.29298/rmcf.v8i48.188
Articles
Bursera simplex Rzed. & Calderón fruits and seeds in different sites and tree structure
1Instituto Tecnológico del Valle de Oaxaca. México
The territory of Oaxaca State has the greatest biodiversity in Mexico; the most abundant vegetation is the low deciduous forest with Bursera species of economic and biological importance. In the present study, the structural composition and phenotype of Bursera simplex seed trees and the characteristics of the site in which they grow were evaluated; their production of fruits and seeds were described according to the tree from which they were harvested. During 2015, a sampling of 23 sample units was conducted towards the best phenotypes with high production of fruits and seeds and their inventory was made. The data were analyzed through structural indexes and analysis of variance to compare the production of fruits and seeds, in relation to the tree from which they were taken, as well as the characteristics of the site, altitude, slope and position of the place where the specimens grew. Those of greater size are associated with slopes ≤ 25 % and altitudes ≤ 1 278 m, where they produce 29 259 seeds kg -1 .The population structure is of irregular type, with important densities of Bursera simplex associated with the western exposure; the forest value index, the importance value index and the complexity index affect the morphological characteristics of fruits and seeds.
Key words: Altitude; Bursera simplex Rzed. & Calderón; orientation; Oaxaca; slope; structural indexes
El territorio del estado de Oaxaca reúne la mayor biodiversidad de México; la vegetación más abundante es la selva baja caducifolia con especies de Bursera de importancia económica y biológica. En el presente estudio se evaluó la composición estructural y el fenotipo de árboles semilleros de Bursera simplex y las características del sitio en que crecen; su producción de frutos y de semillas se describió en función del individuo del cual se recolectaron. Durante 2015, se realizó un muestreo dirigido de 23 unidades muestrales hacia los mejores fenotipos con alta producción de frutos y semillas, ademas se hizo su inventario. Los datos se analizaron mediante índices estructurales y análisis de varianza para comparar la producción de frutos y semillas, en relación al árbol del que se obtuvieron, así como las características del sitio, altitud, pendiente y posición del lugar en el que crecieron los ejemplares. Los de tamaño mayor se asocian a pendientes ≤ 25 % y altitudes ≤ 1 278 m, donde producen 29 259 semillas kg-1. La estructura poblacional es de tipo irregular, con importantes densidades de Bursera simplex asociadas a la exposición oeste; el índice de valor forestal, el índice de valor de importancia y el índice de complejidad afectan las características morfológicas de frutos y semillas.
Palabras clave: Altitud; Bursera simplex Rzed. & Calderón; exposición; índices estructurales; Oaxaca; pendiente
Introduction
Most vegetation types registered worldwide are present in Mexico. In addition, there is a wide range of climates, which condition the processes of soil formation, as well as the diversity and interaction between species (Villaseñor, 2003; Hernández et al., 2011; Dzib-Castillo et al., 2014).
The Oaxaca state has the highest biodiversity in the country, and much of the territory predominates the type of vegetation of low deciduous forest (SBC) (López et al., 2005); these ecosystems have been modified mainly by anthropogenic activities, which affect the populations of Bursera spp. which are important in the biological and economic field, being used as a raw material for obtaining aromatic resins and essential oils.
Natural resources, soil, water, flora and fauna are not used sustainably in many parts of the country. In the particular case of the low spiny forest and of Bursera species in particular, their populations are decreasing, since the natural regeneration by seeds does not counteract the levels of use. It has been documented that the trees of Bursera simplex Rzed. & Calderón have high percentages of vain seeds, a condition resulting from possible crosses with B. biflora Rzed. & Calderón; to this fact it should be added the clear reduction in the number of trees in the reproductive stage, that induces inbreeding, which negatively affects plants by reducing their viability (Cuevas and Abarca, 2006; Rzedowski and Calderón, 2006; Nora et al., 2011).
Bursera simplex is endemic of Oaxaca state, and is found only in the middle portion of the Tehuantepec river basin (Rzedowski and Calderón, 2006); where it is an important component of the tropical deciduous forest and it is used, daily, to extract aromatic resin for ceremonial purposes. It has potential for other uses based on the findings of Gigliarelli et al. (2015) who identified their content of moric acid and 3-epi-lupeol, lupane and olanean skeletons, which according to Cano (2013) are components used as anti-tumor, anti-inflammatory, anti-HIV, anti- microbial, hepa and cardioprotective, analgesic, anti-mycotic, anti-chemopreventive, among others.
The structural diversity of plant communities is one of its most relevant aspects since it is related to the habitat of various animals and plants; in the same way does the stability against different biotic and abiotic factors, as well as with the direct (products) and indirect benefits (carbon fixation, landscape, soil protection, among others) (Del Río et al., 2003). It is therefore important to know the structure of the ecosystem, which is influenced, mainly, by the type, number, spatial arrangement and temporal ordering of its constituting elements (Corral et al., 2005; Ledo et al., 2012), that can be measured by structural indexes and morphological variables (diameter, height, basal area, density among others). The ratio of sizes between trees is important because the species will show morphological differences that give rise to structural contrasts (Castellanos et al., 2008; Jiménez et al., 2009).
The morphological variability of trees results from intraspecific differences but also from the effect of biological and physical factors, which have a close correlation with reproduction because any environmental factor that influences growth will do so in the same way with reproductive performance (Enríquez et al., 2004).
In addition, the seeds in a species can vary in size among individuals and populations, either because of genetic differences or because of differences in the life history of each plant. From this point of view, Alba and Márquez (2006) mention that the seed production potential of a forest species is influenced by the environmental conditions of a given site, as well as by its phenotypic characteristics, which allows to evaluate and weigh the potential for its management; or select outstanding individuals within a given population (Balcorta and Vargas, 2004; Cerón and Sahagún, 2005); when it is intended to propagate an arboreal species for reforestation purposes, it is important to manage rigorous criteria of the selection of trees in which seeds will be collected, which can have a genetic gain in the next generation of trees (Vallejos et al., 2010). Therefore, the objective of this study was to evaluate the effect of tree structure and site variables on the weight and morphological characteristics of fruits and seeds of Bursera simplex.
Materials and Methods
Study area
The study was carried out during 2016 in Santa María Zoquitlán, municipality of the same name, which is a community of the Central Valleys of Oaxaca, located at 16°34 'N and 96°21' W, at an average altitude of 1 080 m. The predominant vegetation is the low deciduous forest, where B. simplex, an endemic species of the Tehuantepec River basin, is distributed. The genera that share the habitat are Cephalocereus, Cercidium, Lysiloma, Ceiba, Neobuxbaumia, Escontria, Acacia, Beaucarnea, among others. The predominant climate is the type BSo (h ') w "(w) i' g (Acosta et al., 2003).
Sampling method and data collection
Selected samplings were carried out with the aim of identifying trees of the species of interest with outstanding phenotypic characteristics, of healthy appearance and that also had fruits, taking this as the main criterion for their selection. During October-December 2015, 27 trees were identified in the area called El Paredón, located in an altitudinal interval of 1 078-1 406 m; the trees were marked with progressive numbers and were taken as a reference point to establish 23 sample units (SU) of 100 m2.
At each sampling site all the present species were counted and with the support of a Fiber-glass measuring tape of 1.52 m and a 5 m measuring tape (Chain brand, MGA 5020 model) the morphological variables corresponding to the collar diameter were measured and recorded (DP, cm), total height (AT, m) and crown diameter (DC, m) with which the crown area was calculated (AC= 1/4 × πDC2, m2).
In the sample units established with a Garmin DriveTM GPS, the site variables (exposure, altitude (m) and slope (%) were recorded with a Suunto Finland clinometer Pm5/36pc.
From each of the selected Bursera specimens, part of the fruits presented was collected, which were placed in paper bags and moved to the facilities of the Instituto Tecnológico del Valle de Oaxaca (ITVO) (Technological Institute of the Valley of Oaxaca) (ITVO).
A random sample of 50 fruits of each tree was taken, in which they were measured with a Pretul vernier of 0.1 cm of precision, their polar diameter (Dp, mm) and their equatorial diameter (DE, mm); the form coefficient (FC = DE / Dp) was obtained and weighed (g) individually with an Ohaus Adventurer™ analytical balance with a maximum capacity of 210 g and precision of 0.1 g. to obtain the number of fruits kg-1. Subsequently, for drying, they were placed under solar radiation for four days; next, the seed was separated from the tissues of the fruit, to then measure its polar and equatorial diameter; finally, they were weighed to obtain the number of seeds kg-1.
With the morphological variables obtained, structural indexes were calculated and frequency histograms were made, using commercial diameter categories of 5 cm and height categories at intervals ≤1.5, (1.5 to 3), (3.1 to 4.5) and (4.6 to 6), > 6 in meters. Three structural assessment indices were determined (Zarco et al., 2010; Santiago, 2013):
Where:
IVI = importance value index
DMr = Relative dominance or relative basal area (ABr)
Dr = Relative density
Fr = Relative frequency
IVF= Forest value index
DPr = Relative collar diameter (cm)
Ar = Relative height (m)
ACr = Relative crown area (m2)
IC= Complexity index
s = Number of species
d = Density of trees larger than 2.5 cm DP
b = Basal area (m2)
h = Height (m) of the three dominant trees
A= Sampling area (m2)
Data handling and analysis
In the fruits, seeds and trees data, the assumptions of normality and homogeneity of variances were verified by the Shapiro-Wilk and Bartlett tests. The variables that did meet the assumptions of normality and homogeneity of variances were subjected to analysis of variance by a completely randomized design and comparisons of means were made by the Duncan test (α = 0.05), in which the classification variable was used tree of origin, exposure, altitude and slope; for these last two, three categories were formed individually.
For the analysis routine, the SAS computer program (2004) was used, with the GLM procedure. In the case of the variables that did not comply with the assumptions of normality and homogeneity of variances, they were analyzed by means of the Kruskal Wallis test with the NPAR1WAY Wilcoxon procedure, by using SAS statistical package (SAS, 2004).
Results and Discussion
Vertical and horizontal structure
The differences in the size of trees of the same species located in different exposure sites can be attributed to the fact that the magnitude of growth is a function of the potentials defined by the genotype, the environment and the interaction of both. Ramírez and Rodríguez (2004), comment that the difference in the growth of trees is attributed to the fact that in the northern hemisphere the southern exposure receives the greatest amount of solar radiation. In this sense, Ortiz-Pulido and Pavón (2010) mention that the exposure of the site and the amount of solar radiation that affects influences the sexual differentiation of the trees of Bursera, since the trees in sites facing east, have more frequency those of male sex and in the groups of trees facing west, female sex is more frequent.
Sánchez and López-Mata (2003) state that altitude is a physical factor that influences climatic conditions through variables such as temperature and precipitation, which, in turn, have a direct effect on plant growth and are correlated specifically in each site. Martínez et al. (2013) mention that relationships have been found between the growth of conifers and the factors of soil depth, altitude, slope and exposure. Rubio et al. (2011), when studying Quercus vegetation, attributed the observed differences to the plant successional state and that the early successional species produce smaller seeds.
The maximum heights in the different sample units (SU) were 6.60 m; for descriptive purposes of the vegetation, two strata were identified: inferior and superior. The lower stratum is constituted, mainly, by individuals ≤1.5 m, reunited, in its majority, in the western exposure (1 057 trees ha-1) and 326 individuals ha-1 greater than 1.5 m. The lowest density of arboreal specimens in the lower stratum was counted (209 individuals ha-1), in the sites located in the southwest exposure. The trees of B. simplex make up the upper layer with heights ≥ 2 m (Figure 1a).
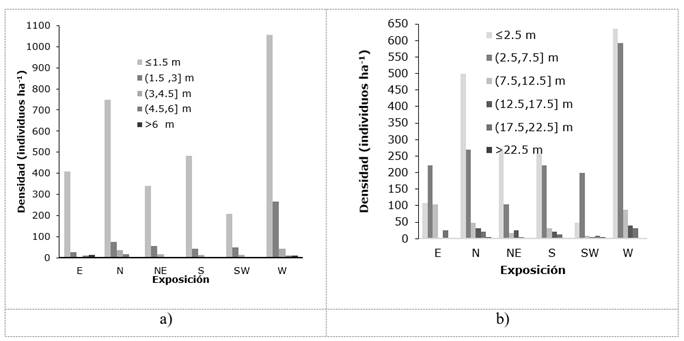
Densidad (individuos ha -1 ) = Density (individuals ha-1); Exposición = Exposure
Figure 1 Frequency of individuals according to their categories of height (a) and diameter (b) at different exposures.
Gutiérrez et al. (2011), in the vegetation of low deciduous forest in three localities of the state of Yucatán, recorded similar data, which they obtained from groupings with individuals of 1.5 to 4.4 m. Dzib-Castillo et al. (2014), when referring to the vegetation in the communities of Pomuch and San José Carpizo in the state of Campeche, calculated heights of 6.3 m in low deciduous forest and diameters of 6.9 cm. On the other hand, in a low deciduous forest in Xmatkuil, Yucatán State. Gutiérrez and Zamora (2012) measured individuals from 4 to 12 m in height and Castillo et al. (2007), in the vegetation of Veracruz State, described three arboreal strata from 1 to 7 m.
In the present work, a greater density of individuals with diameters <2.5 cm in the horizontal structure was quantified in all exposures, followed by diameters greater than 2.5 and less than 7.5 cm, very related to the heights that were more pronounced in the west exposure (Figure 1b); this is explained by the frequency of individuals with higher diameters, which decreases as they reach greater dimensions, which means that the smaller diameter classes will always be more abundant.
The structural indexes (IVI, IVF, IC) showed significant statistical differences (p≤ 0.0001), in their effect on the morphological features of the fruits (Table 1). These differences are mainly due to the fact that the structure is determined by morphological characteristics of trees located in a specific area, as well as by density and competition, which implies dynamic relationships between individuals either to compete for nutrients or to obtain better development of its structures. Therefore, not always greater complexity will represent greater stability of the ecosystem; in addition, the spatial arrangement of individuals determines the particular morphology of the plant (Del Río et al., 2003; Perreta y Vegetti, 2005). Alvis (2009) and Zarco et al. (2010) indicate that the IVI reveals the ecological weight of a species within a population.
Table 1 Fruit-seed morphological variables related to the structural indexes.
| Index | Variable | |||||
|---|---|---|---|---|---|---|
| Fruit weight (g) |
Fruit FC | Fruits kg -1 |
Seed weight (g) |
Seed FC | Seed kg -1 | |
| IVF | 673.04** | 585.16** | 637.04** | 656.56** | 259.56** | 256.56** |
| IVI | 695.86** | 690.44** | 695.86** | 802.1** | 282.65** | 802.1** |
| IC | 644.34** | 588.37** | 644.34** | 650.17** | 241.52** | 650.17** |
IVF = Forest Value Index; IVI = Importance Value Index; IC = Complexity Index; FC = Form coefficient; **Highly significant (Duncan, 0.05).
Fruits and seeds characteristics
The fruits and seeds collected from 27 Bursera simplex trees showed significant statistical differences in weight, form coefficient (FC) and number of seeds kg-1 (p ≤ 0.0001), depending on the tree of origin. The greatest heterogeneity (VC> 65 %) was shown in the weight of the seed and number of seeds kg-1; the lowest variation was recorded by the FC of the fruit and the FC of the seeds (VC = 7.42 and 13.36 %, respectively) (Table 2).
Table 2 Summary of the analysis of variance of morphological variables of fruits and seeds of Bursera simplex Rzed. & Calderón.
| Variable | Variation source | Degrees of freedom | Mean squares | Variation coefficient (%) | Standard deviation |
|---|---|---|---|---|---|
| Fruit weight | Tree | 26 | 0.209** | 18.72 | 0.05 |
| Rep | 49 | 0.014** | |||
| Error | 1 274 | 0.003 | |||
| Total | 1 349 | ||||
| Fruit form coefficient | Tree | 26 | 0.181** | 7.92 | 0.05 |
| Rep | 49 | 0.008ns | |||
| Error | 1 274 | 0.003 | |||
| Total | 1 349 | ||||
| Seed weight | Tree | 26 | 0.009** | 65.13 | 0.03 |
| Rep | 49 | 0.001** | |||
| Error | 1 274 | 0.0009 | |||
| Total | 1 349 | ||||
| Seed form coefficient | Tree | 26 | 0.129** | 13.36 | 0.09 |
| Rep | 49 | 0.008ns | |||
| Error | 1 274 | 0.008 | |||
| Total | 1 349 | ||||
| Number of fruits (kg-1) | Tree | 26 | 40062159 | 20.55 | 724.24 |
| Rep | 49 | 2527007 | |||
| Error | 1 274 | 524537 | |||
| Total | 1 349 | ||||
| Number of seeds kg-1 | Tree | 26 | 1955037863** | 22.21 | 5354.54 |
| Rep | 49 | 103220988** | |||
| Error | 1 274 | 28671108 | |||
| Total | 1 349 |
Rep. = Repetition; **High significant (Duncan, 0.05).
From tree 5, fruits of larger size and weight were selected (0.42 ± 0.09 g), so that the number of fruits kg-1 is low (2456 ± 571.46); these magnitudes were significantly different (Duncan, 0.05) from the sizes and weights of the fruits from trees 3, 9 and 16, which weighed 0.18 ± 0.03 g and the number of fruits kg-1 was 5 743.7 ± 1 138.21, 5 566 ± 998.51 and 5 743.7 ± 1 138.21, respectively.
Given the relation equatorial diameter-polar diameter, the FC in fruit in trees 1, 15, 19 and 23 was higher (0.81 ± 0.06 cm) as in tree 10 (0.81 ± 0.05 cm); this implies fruits of almost spherical shape.
The highest FC in the seeds was recorded in the fruits of tree 25 (0.79 ± 0.01 cm), which was statistically different (p = 0.0001). The tree 21 presented the seeds of greater weight (0.08 ± 0.13), which produce 16 179 ± 5 036 seeds kg-1, while those of tree 3 were smaller, which would have 35 489 ± 10 209 seeds kg-1 (Table 3).
Table 3 Fruits and seeds from 27 Bursera simplex Rzed. & Calderón trees from Santa María Zoquitlán, Oaxaca.
| Tree | Variable and significance | |||||
|---|---|---|---|---|---|---|
| Fruit weight (g) (0.0001) |
Fruit form coefficient (cm) (0.0001) |
Fruits kg -1
(0.0001) |
Seed weight (g) (0.0001) |
Seed form coefficient (0.0001) |
Seeds kg -1 (0.0001) |
|
| 1 | 0.30±0.05 d | 0.81±0.06 a | 3 439.3±791.20 c | 0.03±0.007 ghi | 0.74±0.12 abc | 29 328±6 694 c |
| 2 | 0.25±0.05 e | 0.70±0.06 e | 4 142.4±991.18 b | 0.04±0.008 defgh | 0.70±0.09 bcd | 22 318± 4 441 ghi |
| 3 | 0.18±0.03 f | 0.78±0.07 bc | 5 743.7±1138.21 a | 0.03±0.030 ghi | 0.68±0.07 ghi | 35 489±10 209 a |
| 4 | 0.30±0.05 d | 0.68±0.04 ef | 3 438.4±704.60 c | 0.03±0.006 hi | 0.67±0.09 ghi | 32 712±7 347 b |
| 5 | 0.42±0.09 a | 0.77±0.04 cd | 2 456.0±571.46 e | 0.06±0.010 bc | 0.75±0.08 abc | 17 283±4 157 klm |
| 6 | 0.35±0.06 c | 0.76±0.05 cd | 2 878.1±544.05 d | 0.05±0.070 bcde | 0.76±0.08 abc | 22 065± 5 000 hi |
| 7 | 0.38±0.06 b | 0.64±0.06 g | 2 678.6±539.12 de | 0.04±0.009 defgh | 0.68±0.13 fgh | 22 585±5 521 ghi |
| 8 | 0.30±0.05 d | 0.80±0.06 ab | 3 430.5±821.21 c | 0.03±0.005 fghi | 0.72±0.08 cdef | 25 476±3 648 ef |
| 9 | 0.18±0.03 f | 0.69±0.09 e | 5 566.4±998.51 a | 0.02±0.005 i | 0.63±0.08 jkl | 36 983±7 395 a |
| 10 | 0.40±0.04 ab | 0.81±0.05a | 2 512.8±292.90 e | 0.03±0.007 fghi | 0.73±0.09 bcde | 26 947±5 694 ed |
| 11 | 0.29±0.07 d | 0.75±0.05 d | 3 615.2±1003.62 c | 0.03±0.007 hi | 0.69±0.09 efg | 32 719±6 556 b |
| 12 | 0.32±0.08 d | 0.66±0.04 fg | 3 279.4±757.19 c | 0.03±0.006 ghi | 0.64±0.09 hijk | 28 658±5 709 cd |
| 13 | 0.30±0.05 d | 0.68±0.05 ef | 3 427.7±686.91 c | 0.04±0.005 fghi | 0.69±0.09 efgh | 24 671±3 465 fg |
| 14 | 0.40±0.05 ab | 0.80±0.06 ab | 2 492.5±376.73 e | 0.04±0.009 efgh | 0.74±0.06 bc | 23 198±5 262 gh |
| 15 | 0.30±0.05 d | 0.81±0.06 a | 3 438.4±704.60 c | 0.03±0.005 ghi | 0.73±0.09 bcde | 28 966±5 515 cd |
| 16 | 0.18±0.03 f | 0.78±0.07 bc | 5 743.7±1138.21 a | 0.07±0.010 b | 0.66±0.07 ghij | 14 964±4 020 m |
| 17 | 0.30±0.05 d | 0.80±0.06 ab | 3 430.5±821.21 c | 0.03±0.005 hi | 0.72±0.07 cde | 31 849±4 752 b |
| 18 | 0.25±0.05 e | 0.70±0.06 e | 4 142.4±991.18 c | 0.06±0.010 bc | 0.63±0.08 ijk | 17 046±4 198 lm |
| 19 | 0.30±0.05 d | 0.81±0.06 a | 3 438.4±704.60 c | 0.06±0.006 bcd | 0.61±0.08 kl | 16 790±2 022 lm |
| 20 | 0.30±0.05 d | 0.68±0.04 ef | 3 438.4±704.60 c | 0.04±0.010 cdefg | 0.59 ±0.08 l | 22 709±6 809 ghi |
| 21 | 0.35±0.06 c | 0.76±0.05 cd | 2 887.1±544.05 d | 0.08±0.13 a | 0.67±0.08 ghi | 16 179±5 036 lm |
| 22 | 0.30±0.05 d | 0.80±0.06 ab | 3 430.5±821.21 c | 0.04±0.007 defgh | 0.72±0.08 cdef | 21 982±3 572 hi |
| 23 | 0.30±0.05 d | 0.81±0.06 a | 3 439.3±791.20 c | 0.05±0.02 bcde | 0.67±0.09 ghi | 19 385±5 940 jk |
| 24 | 0.30±0.05 d | 0.80±0.06 ab | 3 430.5±821.21 c | 0.06±0.001 bcd | 0.69±0.09 defg | 17 512±4 748 kl |
| 25 | 0.32±0.08 d | 0.66±0.04 fg | 3 279.4±757.19 c | 0.04±0.008 defgh | 0.79±0.01 a | 22 127±4 279 hi |
| 26 | 0.30±0.05 d | 0.68±0.05 ef | 3 427.7±686.91 c | 0.05±0.02 bcde | 0.76±0.09 abc | 19 538±8 972 jk |
| 27 | 0.40±0.05 ab | 0.80±0.06 ab | 2 492.5± 376.73 e | 0.05±0.01 cdef | 0.77±0.08 ab | 20 606±5 160 ij |
Accompanied mean by ±standard deviation. Different letters in columns represent significant statistical differences (Duncan, 0.05).
Possibly the morphological variations in fruits and seeds of the different trees result from Bursera simplex's own reproduction type, since its dioic condition promotes cross-pollination, and, therefore, greater diversity in the offspring (Edwards y Sharitz 2000; Enríquez et al., 2004; Rzedowski y Calderón 2006; Magallán et al., 2009). The morphological variability observed in fruits and seeds could have a remarkable genetic component besides the environmental one (Gómez et al., 2010).
On the other hand, Guzmán and Cruz (2014) report that the growth of the fruit is related to the available humidity, since with high temperatures with little humidity, the fruits become smaller, which varies according to the position they have on the tree; the large fruits develop in the upper part of the crown due to the greater availability of sugars and proteins produced by the photosynthetic area, in comparison with those of the lower part of the crown. Based on the above, Rubio et al. (2011) mention that the variation in the size of the seeds is important because it provides diverse capacities to settle in sites with different conditions.
Gonzáles and Cruz (1995) establish that fruits with FC close to the unit have homogeneous diameters (polar and equatorial) and have a spherical shape, while values that diverge from it describe elongated fruits. Site conditions such as altitude, exposure and the slope of the terrain where the tree grows influence the magnitude of its growth and these in turn influence the morphological characteristics of fruits and seeds (p ≤ 0.01). Fruits of greater weight 0.34 ± 0.07 g were harvested from trees located in sites with southern exposure; seeds collected from trees growing in sites with southwestern exposure weighed 0.06 ± 0.07 g; in contrast, those of trees in north and northeast exposures weighed 0.03 g.
The FC of fruits and seeds reflects significant statistical differences (p ≤ 0.0002); therefore, it is confirmed that the fruits with the highest FC were those harvested from trees in sites with east exposure with 0.81 ± 0.06 cm, which contrasts with the seeds from trees in southern exposure whose CF was 0.72 ± 0.10 cm. On the other hand, the seeds collected from trees in sites in southwest exposure had a higher FC (p = 0.72 ± 0.09 cm). The amount of fruits and seeds kg-1 was statistically different (p = 0.0001), because the seeds collected from trees located in northeast exposure accumulated 4 235 ± 1 338 kg-1 fruits, higher than the southern exposure, 3 054 ± 787 kg-1 fruits; similar case occurs in tree seeds in northeast exposure, which gave a total of 30 124 ± 8 746 (Table 4).
Table 4 Assessed variables in regard to exposure, slope and altitude.
| Site variable | Fruit-seed variables (probability) | |||||
|---|---|---|---|---|---|---|
| FP (g) (0.0001) |
DPF (cm) (0.0001) |
Fruits kg
-1
(0.0001) |
PS (g) (0.0001) |
CFS (cm) v (0.0002) |
Seed kg
-1
(0.0001) |
|
| Exposure | ||||||
| South | 0.34±0.07 a | 0.72±0.10 c | 3 054.6±787.66 d | 0.05±0.01 b | 0.69±0.11 bcd | 20 048.4±5 722.6 d |
| West | 0.33±0.09 ab | 0.75±0.56 b | 3 236.6±1 111.22 dc | 0.05±0.02 b | 0.70±0.11 abc | 22 186.3±6 908.4 c |
| Southwest | 0.32±0.06 bc | 0.75±0.07 b | 3 248.4±734.85 dc | 0.06±0.07 a | 0.72±0.09 a | 19 233±6 686.4 d |
| East | 0.30±0.05 c | 0.81±0.06 a | 3 439.3±791.20 c | 0.05±0.02 ab | 0.67±0.09 d | 19 385.1±5 940.5d |
| North | 0.27±0.07 d | 0.75±0.09 b | 3 879.8±1 168.08 b | 0.03±0.01 c | 0.68±0.09 cd | 28 146.7±8 076.2 b |
| Northeast | 0.25±0.07 e | 0.76±0.07 b | 4 235.2±1 338.91 a | 0.03±0.01 c | 0.71±0.01 ab | 30 124.4±8 746.8 a |
| Slope (%) | ||||||
| ≤25 | 0.30±0.05 a | 0.81±0.06 a | 3 438.4±704.60 b | 0.06±0.006 a | 0.61±0.08 c | 16 789±2 022.8 c |
| (25,40] | 0.31±0.08a | 0.75±0.08 b | 3 421.4±1 131.96 b | 0.04±0.03 b | 0.71±0.10 a | 23 898.8±8 082.0 b |
| >40 | 0.26±0.08 b | 0.71±0.08 c | 4 104.7±1 271.68 a | 0.04±0.01 b | 0.66±0.09 b | 27 040±8 962 a |
| Altitude (m) | ||||||
| ≤1 178 | 0.24±0.07 c | 0.76±0.08 a | 4 441.81±1 375.15 a | 0.03±0.01 b | 0.72±0.10 a | 29 259.4±8 974.6 a |
| (1 178-1 278] | 0.36±0.08 a | 0.74± 0.07 b | 3 531.67±725.56 b | 0.04±0.03 a | 0.72±0.09 a | 23 985.7±7 212.7 b |
| >1 278 | 0.30±0.08 b | 0.75±0.08 ab | 2 940.33±1 128.83 c | 0.04±0.03 a | 0.69±0.10 b | 23 316.9±8 140.1 b |
Accompanied mean by ± standard deviation. Different letters in columns represent significant statistical differences (Duncan, 0.05); FP = Fruit weight; DPF = Polar fruit diameter; CFF = Fruit shape coefficient; PS = Seed weight; CFS = Seed shape coefficient.
The slopes of the evaluated sites showed significant differences (p ≤ 0.001); from trees in sites with 25 and 40 %, the fruits of greater size were collected, with an average of 0.31 g and the production of fruits kg-1 is favorable in slopes> 40 %, since they sum up an average of 4 104, with a FC equal to 0.71 ± 0.008 cm. From trees located in places with small slopes, fruits that tend to be rounded were taken, unlike the fruits of sites with steeper slopes, which outline an elongated shape.
The same behavior was not observed does with the seeds collected from trees located in slopes <25 %, since between the slopes 25 and 40 %, they reached a greater weight (0.06 g), with shape form of 0.71, while the seeds from trees located at slopes> 40 % were smaller but more abundant (27 040 seeds kg-1) in contrast to the seeds taken from trees located at sites on slopes <25 % that were larger, and that gave a total of 16 789 seeds kg-1 (Table 4).
The altitude of the sites in which the trees grow was also a factor with significant effect (p≤0.01), since in the altitudinal interval between 1 178 and 1 278 m, the weight of the fruits was 0.36 g, with the lowest FC (0.74); these data contrast with those occurring at altitudes ≤1 178 m, whose FC was 0.76, at this same altitude the fruit production was 4 441.
The seed had a similar response with 0.04 g at altitudes> 1 178 m; however, seed production was higher at altitudes ≤1 178 m (29 259.4) with form coefficients of 0.72 cm at altitudes ≤1 278 m (Table 4).
The morphological differences of the fruits and seeds in relation to the characteristics of the site (exposure, slope and altitude) can be understood as they are factors that influence the solar radiation that affects the plant, temperature and environmental humidity, conditions that affect the primary productivity of the species. In their study conducted in Quercus, Márquez et al. (2005) stated that the size differences are due to biological and physical factors, in addition to the size of the seeds in a species can vary between populations or between individuals, either for genetic reasons or for the life history of each plant (Griffiths et al., 2009; García et al., 2015).
Conclusions
The population structure of the trees selected as Bursera simplex seedbeds is characterized by an irregular shape, characteristic of the low deciduous forest; according to the evaluated indexes, the structure in which the trees of B. simplex develop affects the weight and morphological characteristics of fruits and seeds.
In the west exposure sites, the highest number of individuals was counted, where there is a greater density of shrub type species, mainly, with heights ≤ 1.5 m, as well as larger individuals such as the burseras with 265 ha-1 individuals. From tree 21, the best selected as a nursery, the highest seeds were collected (0.08 ± 0.13 g), with 16 179 ± 5 036 seeds kg-1; while the fruits of greater weight were associated to tree five (0.42 g) and 2 456 fruits kg-1 with low FC and elliptical shape. The slopes and altitudes of the sites influence the characteristics of the fruits and seeds, of the trees in sites with slopes ≤ 40 % heavier fruits were collected.
Acknowledgements
The authors wish to express their special gratitude to the authorities of Bienes Comunales of Santa María Zoquitlán, Oaxaca, México, for the facilities provided to accomplish the actual research.
REFERENCES
Acosta, S., A. Flores, A. Saynes, R. Aguilar y G. Manzanero. 2003. Vegetación y Flora de una zona semiárida de la cuenca alta del río Tehuantepec, Oaxaca, México. Polibotánica 16:125-152. http://www.redalyc.org/articulo.oa?id=62101607 (10 de octubre de 2017). [ Links ]
Alba, L. J. y R. J. Márquez. 2006. Potencial y eficiencia de producción de semillas de Pinus oaxacana Mirov de los Molinos, Perote, Veracruz. Foresta Veracruzana 8(1):31-36. http://www.redalyc.org/articulo.oa?id=49780106 (1 de octubre de 2017). [ Links ]
Alvis G., J. F. 2009. Análisis estructural de un bosque natural localizado en zona rural del municipio de Popayan. Facultad de Ciencias Agropecuarias 7(1):115-122. http://www.scielo.org.co/pdf/bsaa/v7n1/v7n1a13.pdf (2 de septiembre de 2017). [ Links ]
Balcorta M., H. C. y J. J. Vargas H. 2004. Variación fenotípica y selección de árboles en una plantación de melina (Gmelina arborea Linn., Roxb.) de tres años de edad. Revista Chapingo. Serie Ciencias Forestales y del Ambiente 10(1):13-19. http://www.redalyc.org/articulo.oa?id=62910102 (4 de agosto de 2017). [ Links ]
Cano F., A. 2013. Biotransformación de triterpenos con diferentes microorganismos. Revista Mexicana de Ciencias Farmacéuticas 44(2):7-16. http://www.redalyc.org/pdf/579/57929952002.pdf (18 de marzo de 2017). [ Links ]
Castellanos B., J. F., E. J. Treviño G., Ó. A. Aguirre C., J. Jiménez P., M. Musálem S. y R. López A. 2008. Estructura de bosques de pino patula bajo manejo en Ixtlán de Juárez, Oaxaca, México. Madera y Bosques 14(2):51-63. http://www.redalyc.org/articulo.oa?id=61711316005 (15 de febrero de 2017). [ Links ]
Castillo C., G., P. Dávila A. y J. A. Zavala H. 2007. La selva baja caducifolia en una corriente de lava volcánica en el centro de Veracruz: lista florística de la flora vascular. Boletín de la Sociedad Botánica de México 80:77-104. http://www.redalyc.org/pdf/577/57780008.pdf (28 de febrero de 2017). [ Links ]
Cerón R., J. J. y J. Sahagún C. 2005. Un índice de selección basado en componentes principales. Agrociencia 39(6):667-677. http://www.redalyc.org/articulo.oa?id=30239610 (29 de febrero de 2017). [ Links ]
Corral R., J. J., O. A. Aguirre C., J. Jiménez P. y S. Corral R. 2005. Un análisis del efecto del aprovechamiento forestal sobre la diversidad estructural en el bosque mesófilo de montaña “El Cielo”, Tamaulipas, México. Investigación Agraria: Sistemas y Recursos Forestales 14(2):217-228. http://www.inia.es/gcontrec/pub/217-228-(30_0S)-Un_analisis_1162281437750.pdf (30 de marzo de 2017). [ Links ]
Cuevas, G. E. y C. A. Abarca G. 2006. Origen, mantenimiento y evolución del ginodioicismo. Boletín de la Sociedad Botánica de México 78:33-42. http://www.redalyc.org/articulo.oa?id=57707804 (1 de enero de 2017). [ Links ]
Del Río, M., F. Montes, I. Cañellas y G. Montero. 2003. Revisión: Índices de diversidad estructural en masas forestales. Investigación Agraria: Sistemas y Recursos Forestales 12(1):159-176. https://www.researchgate.net/profile/Miren_Rio2/publication/28061992_Indices_de_diversidad_estructural_en_masas_forestales/links/0deec51c3fa0f63666000000/Indices-de-diversidad-estructural-en-masas-forestales.pdf (12 de marzo de 2017). [ Links ]
Dzib-Castillo, B., C. Chanatásig-Vaca y N. A. González-Valdivia. 2014. Estructura y composición en dos comunidades arbóreas de la selva baja caducifolia y mediana subcaducifolia en Campeche, México. Revista Mexicana de Biodiversidad 85:167-178. http://dx.doi.org/10.7550/rmb.38706 (24 de octubre de 2017). [ Links ]
Edwards, L. A. and R. R. Sharitz. 2000. Population genetics of two rare perennials in isolated wetlands: Sagitaria isoetiformis and S. teres (alismataceae). American Journal of Botany 87(8):1147-1158. http://www.amjbot.org/content/87/8/1147.full (23 de diciembre de 2017). [ Links ]
Enríquez P., E. G., H. Suzán A. y G. Malda B. 2004. Viabilidad y germinación de semillas de Taxodium mucronatum (Ten.) en el estado de Querétaro, México. Agrociencia 38(3):375-381. http://www.redalyc.org/articulo.oa?id=30238311 (18 de diciembre de 2017). [ Links ]
García A., J. Á., G. Rodríguez O. y J Martínez de la C. 2015. Influencia de variables fisiográficas en la productividad de biomasa aérea en bosques mixtos. Revista Mexicana de Agroecosistemas 2(2):87-98. http://www.itvalleoaxaca.edu.mx/posgradoitvo/RevistaPosgrado/docs/RMAE%20vol%202_2_2015/RMAE_2015-2(2)-pdf/4%20RMAE_2015-12%20Biomasa-resumen.pdf (2 de octubre de 2017). [ Links ]
Gigliarelli, G., J. X. Becerra, M. Curini and M. C. Marcotullio. 2015. Chemical composition and biological activities of fragrant Mexican copal (Bursera spp.). Molecules 20: 22383-22394. [ Links ]
Gómez J., D. M., C. Ramírez H., J. Jasso M. y J. López U. 2010. Variación en características reproductivas y germinación de semillas de Pinus leiophylla Schiede ex Schltdl. & Cham. Revista Fitotecnia Mexicana 33(4):297-304. http://www.scielo.org.mx/scielo.php?script=sci_arttext&pid=S0187-73802010000400007 (1 de mayo de 2017). [ Links ]
Gonzáles M., J. C. y J. P. Cruz H. 1995. Caracterización de frutos de pitaya Stenocereus griseus H., en la Mixteca. Revista Chapingo Serie horticultura 4:77-81. http://dx.doi.org/10.5154/r.rchsh.1994.08.053 (13 de octubre de 2017). [ Links ]
Griffiths, R. P., M. D. Madritch and A. K. Swanson. 2009. The effects of topography on forest soil characteristics in the Oregon Cascade Mountains (USA): Implications for the effects of climate change on soil properties. Forest Ecology and Management 257:1-7. http://www.sciencedirect.com/science/article/pii/S0378112708006282 (25 de abril de 2017). [ Links ]
Gutiérrez, B. C., J. J. Ortiz D., J. S. Flores G., P. Zamora C., M. R. Domínguez C. y P. Villegas. 2011. Estructura y composición florística de la selva mediana subcaducifolia de Nohalal-Sudzal Chico, Tekax, Yucatán, México. Foresta Veracruzana 13(1):7-14. http://www.redalyc.org/articulo.oa?id=49719786002 (18 de agosto de 2017). [ Links ]
Gutiérrez B., C. y P. Zamora C. 2012. Especies leñosas de la selva baja caducifolia de Xmatkuil, Yucatán, México. Foresta Veracruzana 14(2):9-14. http://www.redalyc.org/pdf/497/49728290002.pdf (11 de agosto de 2017). [ Links ]
Guzmán P., A. M. y E. Cruz C. 2014. Características físicas de frutos de cuachalalate (Amphipterygium adstringens (Schltdl.) Standl) de tres procedencias. Revista Fitotecnia Mexicana 37(39):255-260. http://www.scielo.org.mx/scielo.php?script=sci_arttext&pid=S0187-73802014000300012 (11 de agosto de 2017). [ Links ]
Hernández P., E., M. González E., I. Trejo y C. Bonfil. 2011. Distribución del género Bursera en el estado de Morelos, México y su relación con el clima. Revista Mexicana de Biodiversidad 82(3):964-976. http://www.scielo.org.mx/scielo.php?script=sci_arttext&pid=S1870-34532011000300021 (11 de agosto de 2017). [ Links ]
Jiménez P., J., E. Alanís R., O. Aguirre C., M. Pando M. y M. González T. 2009. Análisis sobre el efecto del uso del suelo en la diversidad estructural del matorral espinoso tamaulipeco. Madera y Bosques 15 (3): 5-20. http://www.scielo.org.mx/scielo.php?script=sci_arttext&pid=S1405-04712009000300001 (11 de agosto de 2017). [ Links ]
Ledo, A., S. Condes y F. Montes. 2012. Revisión de índices de distribución espacial usados en inventarios forestales y su aplicación en bosques tropicales. Revista Peruana de Biología 19(1):113-124. http://www.scielo.org.pe/scielo.php?pid=S1727-99332012000100017&script=sci_arttext (2 de febrero de 2017). [ Links ]
López, C., K. S. Chanfón y G. Segura W. 2005. La riqueza de los bosques mexicanos: más allá de la madera. Experiencias de comunidades rurales en Latinoamérica. Ed. Talleres de Servicios Aplicados de Impresión. México, D.F., México. pp. 86-87. http://www.cifor.org/publications/pdf_files/Books/BLopez0501S0.pdf (2 de diciembre de 2017). [ Links ]
Magallán H., F., M. Martínez, L. Hernández S. y K. Oyama. 2009. Estructura genética de poblaciones de Eriocaulon bilobatum (Eriocaulaceae): una especie amenazada de humedades temporales. Boletín de la Sociedad Botánica de México 85:81-88. http://www.scielo.org.mx/scielo.php?script=sci_arttext&pid=S0366-21282009000200008 (12 de abril de 2017). [ Links ]
Márquez R., J., L. C. Mendizábal H. y C. I. Flores R. 2005. Variación de semillas de Quercus oleoides Schl. et Cham. de tres poblaciones de centro de Veracruz, México. Foresta Veracruzana 7(1):31-36. http://www.redalyc.org/pdf/497/49770106.pdf (1 de diciembre de 2017). [ Links ]
Martínez S., M., R. D. Valdez C. y M. Pompa G. 2013. Influencia de variables físicas en la productividad de Pinus arizonica y Pinus engelmannii en el sur de Chihuahua, México. Madera y Bosques 19(3):35-49. http://www.scielo.org.mx/scielo.php?script=sci_arttext&pid=S1405-04712013000300004 (1 de mayo de 2017). [ Links ]
Nora, S., G. Albaladejo R., S. C. González M., J. J. Robledo A. y A. Aparicio. 2011. Movimiento de genes (polen y semillas) en poblaciones fragmentadas de plantas. Ecosistemas 20(2):35-45. http://www.redalyc.org/articulo.oa?id=54022121004 (18 de diciembre de 2017). [ Links ]
Ortiz-Pulido, R. and P. Pavón N. 2010. Influence of slope orientation on sex ratio and size distribution in a dioecious plant Bursera fagaroides var. purpusii (Brandeg.) McVaugh and Rzed. (Burseraceae). Plant Ecology 208(2):271-277. http://dx.doi.org/10.1007/s11258-009-9704-2 (1 de agosto de 2017). [ Links ]
Perreta, M. G y A. C. Vegetti. 2005. Patrones estructurales en las plantas vasculares: una revisión. Gayana Botánica 62(1):9-19. http://www.scielo.cl/scielo.php?script=sci_arttext&pid=S0717-66432005000100003 (2 de febrero de 2017). [ Links ]
Ramírez C., A. y D. A. Rodríguez T. 2004. Efecto de calidad de planta, exposición y micrositio en una plantación de Quercus rugosa. Revista Chapingo Serie Ciencias Forestales y del Ambiente 10(1):5-11. https://chapingo.mx/revistas/revistas/articulos/doc/rchscfaX403.pdf (2 de febrero de 2017). [ Links ]
Rubio L., L. E., S. Romero R., E. C. Rojas Z., A. Durán D. y J. C. Gutiérrez G. 2011. Variación del tamaño de frutos y semillas en siete especies de encino (Quercus, Fagaceae). Polibotánica 32:135-151. http://www.scielo.org.mx/scielo.php?script=sci_arttext&pid=S1405-27682011000200008 (2 de febrero de 2017). [ Links ]
Rzedowski, J. y G. Calderón. 2006. Dos especies de Bursera (Burseraceae) de México. Acta Botánica Mexicana 74:169-178. http://www.scielo.org.mx/scielo.php?script=sci_arttext&pid=S0187-71512006000100003 (12 de diciembre de 2017). [ Links ]
Sánchez G., A. y L. López-Mata. 2003. Clasificación y ordenación de la vegetación del norte de la sierra, a lo largo de un gradiente altitudinal. Anales del Instituto de Biología, Serie Botánica 74(1):47-71. http://www.journals.unam.mx/index.php/bot/article/view/1958 (12 de diciembre de 2017). [ Links ]
Statistical Analysis System Institute (SAS) 2004. SAS/STAT 9.1 User´s guide. SAS Institute Inc. Cary, NC, USA. 4979 p. [ Links ]
Santiago G., E. 2013. Evaluación de Litsea glaucescens Kunth en el área de conservación forestal de Analco, Ixtlán, Oaxaca. Tesis de Maestría en Ciencias en conservación de los recursos forestales. Universidad de la Sierra Juárez. Ixtlán de Juárez, Oax., México. 86p. [ Links ]
Vallejos, J., Y. Badilla, F. Picado y O. Murillo. 2010. Metodología para la selección e incorporación de árboles plus en programas de mejoramiento genético forestal. Agronomía Costarricense 34(1):105-119. http://revistas.ucr.ac.cr/index.php/agrocost/article/view/6704/6393 (12 de diciembre de 2017). [ Links ]
Villaseñor, J. L. 2003. Diversidad y distribución de las magnoliophyta de México. Interciencia 28 (3):160-167. http://www.redalyc.org/pdf/339/33907806.pdf (12 de diciembre de 2017). [ Links ]
Zarco E., V. M., J. I. Valdez H., G. Ángeles P. y O. Castillo A. 2010. Estructura y diversidad de la vegetación arbórea del parque estatal agua blanca, Macuspana, Tabasco. Universidad y Ciencia 26(1): 1-17. http://www.scielo.org.mx/pdf/uc/v26n1/v26n1a1.pdf (12 de diciembre de 2017). [ Links ]
Received: January 02, 2018; Accepted: May 30, 2018
 Este es un artículo publicado en acceso abierto bajo una licencia Creative Commons
