


Serviços Personalizados
Journal
Artigo
 texto em
  Inglês (pdf)
 Artigo em XML
 Referências do artigo
 Enviar este artigo por email
Indicadores
-
 Citado por SciELO
 -
 Acessos
Links relacionados
-
 Similares em
SciELO
Similares em
SciELO
Compartilhar

 Permalink
Revista mexicana de ciencias forestales
versão impressa ISSN 2007-1132
Rev. mex. de cienc. forestales vol.9 no.47 México Mai./Jun. 2018
https://doi.org/10.29298/rmcf.v9i47.158
Articles
Organic carbon and total nitrogen in Mexican forest soils through VIS-NIR spectroscopy
1Unidad Regional Universitaria de Zonas Áridas, Universidad Autónoma Chapingo. México.
2Campo Experimental La Laguna, Instituto Nacional de Investigaciones Forestales, Agrícolas y Pecuarias. México.
3Instituto Nacional de Estadística y Geografía. México.
4Colegio de Postgraduados Campus Tabasco. México.
5Colegio de la Frontera Sur Unidad Villahermosa. México.
The sustainable use of the soil resource, as well as the correct decision making regarding its management depends on the knowledge of its properties. Conventional soil analysis methods are laborious, costly and generate large amounts of chemical waste. Due to the need for methods that allow a rapid, reliable analysis of soil properties, the objective of this work was to develop a prediction model for the content of organic carbon (OC) and total nitrogen (TN) in the soil through Visible and Near Infrared regions (VIS-NIR) spectroscopy. The conventional analysis of TC and TN of 599 forest soils from different regions of Mexico was carried out by dry combustion, and the content of inorganic carbon (IC) was determined by Bernard's calcimeter method. The prediction models were developed in a FOSS NIR System 6500. The models generated in the calibration process presented R2 values of 0.93 and 0.88 for OC and TN, respectively. The values of the relationship between the standard error of prediction and the standard deviation of the samples (RPD, for its acronym in English) for both properties were higher than 2. In the case of the validation process, the values of R2 were higher than 0.9, and the RPD was also above 2 in both properties. The results of this study show that VIS-NIR spectroscopy is an alternative technique to the conventional analysis methods of organic carbon and total nitrogen of the soil.
Key words: Absorbance; spectral analysis; prediction models; chemometrics; reflectance; forest soils
La sostenibilidad del uso del recurso suelo y la correcta toma de decisiones sobre su manejo depende del conocimiento de las propiedades del mismo. Los métodos de análisis de suelo convencionales son laboriosos, con alto costo y generan gran cantidad de residuos químicos. Debido a la necesidad de tener métodos que permitan el rápido y confiable análisis de sus propiedades, el objetivo de este trabajo fue desarrollar un modelo de predicción para el contenido de carbono orgánico (CO) y nitrógeno total (NT), mediante espectroscopia en las regiones Visible e Infrarrojo Cercano (VIS-NIR). Se llevó a cabo el análisis convencional de carbono total (CT) y NT por combustión seca y del carbono inorgánico (CI) por el método del calcímetro de Bernard, de 599 muestras de suelos forestales de diversas regiones de México. Las ecuaciones de predicción fueron desarrolladas en un equipo FOSS NIR System 6500. Los modelos generados en el proceso de calibración presentaron valores de R2 = 0.93 y 0.88 para CO y NT, respectivamente. La relación entre el error estándar de predicción y la desviación estándar de las muestras (RPD, por sus siglas en inglés) para ambas propiedades fueron superiores a 2. En el proceso de validación, los valores de R2 fueron mayores a 0.9 y RPD a 2, en ambas propiedades. Los resultados muestran que la espectroscopia VIS-NIR es una técnica alternativa a los métodos de análisis convencionales de carbono orgánico y nitrógeno total del suelo.
Palabras clave: Absorbancia; análisis espectral; modelos de predicción; quimiometría; reflectancia; suelos forestales
Introduction
The sustainability of the agricultural and forest production, extensive livestock breeding and the environment in general is broadly related to the management and conservation of the soil. This sustainability can only be reached based on the scientific and technical knowledge of this resource (FAO, 2006). The soil is crucial for life, among other reasons, because of the role that it plays in the cycle of certain elements (Maestre et al., 2008). Knowledge of its physical, chemical and biological characteristics is considered essential for better decision-making regarding its management.
The properties of the soil are generally determined through laboratory methods, with wet or dry chemistry techniques, which in most cases are laborious, time-consuming and costly (Ge et al., 2011). Besides, they generate chemical waste which, when inadequately managed, can cause environmental pollution (Zornoza et al., 2008). Furthermore, certain chemical characteristics of the soil have a very dynamic cycle and a great spatial variability. This makes the obtainment of reliable information more difficult and costly, and therefore large amounts of samples must be analyzed in order to attain good knowledge of the behavior of these properties (Plant, 2001).
For this reason, there is a worldwide need to develop rapid, inexpensive, accurate and reliable methods for analyzing the edaphic properties (Shepherd and Walsh, 2007).
Many applications of infrared spectroscopy have been developed in the last few decades in both the agricultural and environmental sciences because of their high sensitivity in the detection of organic and inorganic soil components. This is based on the relationship of existing between intense fundamental molecular vibrations with the soil components in the mid-infrared region (2 500 to 25 000 nm). At the same time, in the near-infrared region (700 to 2 500 nm), overtones and combinations of these fundamental vibrations are generated, due to the lengthening and flexion of bonds N-H, C-H and O-H, as well as electronic transitions in the visible region (400 to 700 nm) of the electromagnetic spectrum (Viscarra et al., 2006).
Particularly, near-infrared spectroscopy (NIR, for its acronym in English) is a method that allows indirect quantification of certain properties of the soil based on the interaction of matter with an incidental beam of light in which a portion of photons is absorbed (absorbance) and the rest is reflected (reflectance) (Pérez et al., 2014). Radiation absorption has also been registered in the infrared region by several functional groups, such as C-H, N-H, S-H, C=O and O-H of molecules of the sample, present mainly in organic molecules (Viscarra et al., 2006).
VIS-NIR technology has many advantages compared to conventional analyses: it is quick, effective, non-destructive, low-cost, it requires a minimum analysis time per sample, it is simple and can be an ideal complement of the classic methods, or even replace them, once robust calibrations have been developed (Terhoeven et al., 2008; Xie et al., 2012). In addition, it has the ability to predict various properties based on a single spectrum.
In the field of agronomy, NIR or VIS-NIR spectroscopy encompasses several fields. One is the determination of soil properties, such as the content of nitrogen (Jarquín et al., 2011), carbon and total nitrogen (Fuentes et al., 2012), organic matter (Rodríguez et al., 2015), percentage of sand, silt and clay (Macías et al., 2015), basal respiration (Maestre et al., 2008), 13C (Fuentes et al., 2009) and soil classification (Bastidas and Carbonell, 2010). This technology is also used for the indirect detection of plant diseases (Pérez et al., 2014), as well as for the evaluation of the quality of certain fodders (Valenciaga and Oliveira, 2006).
In Mexico, the VIS-NIR technique has been little applied in forest soil analyses, to a large extent because of the difficulty of having access to a significant amount of samples in order to carry out the corresponding calibrations. This is particularly difficult in a country like Mexico, which is characterized by its great natural diversity of soil types, climates and vegetation types, and by the ways in which ecosystems have been managed through time. For example, according to INEGI (2007), 26 of the 32 groups recognized by the World Reference Base for Soil Resources of the International Union of Soil Sciences (IUSS, 2007) exist in the country. This requires the development of methods that allow a quick, accurate estimation of the spatial variability of the physical and chemical properties of large amounts of soil samples at low cost and with the least possible impact on the environment.
The purpose of this work was to create a model for predicting the content of organic carbon and total nitrogen in samples of forest soils of Mexico using spectroscopy in the VIS-NIR spectral region.
Materials and Methods
The present research was carried out between 2015 and 2016 at the soils laboratory of the Campo Experimental La Laguna (La Laguna Experimental Station) dependent on the Centro de Investigación Regional Norte-Centro (North-Central Regional Research Center) of the Instituto de Investigaciones Forestales, Agrícolas y Pecuarias (National Institute of Research on Forestry, Agriculture and Livestock), located in Matamoros, Coahuila, Mexico.
Samples
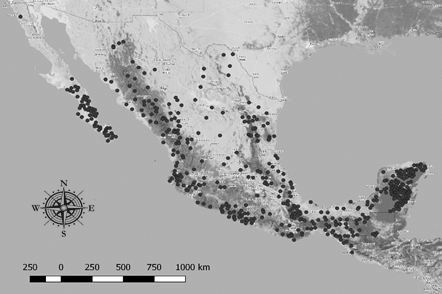
A total of 599 of forest soils from various regions of Mexico (Figure 1) were analyzed. The samples came from the 2014 National Inventory of Forest and Soils of the Comisión Nacional Forestal (National Commission of Forestry) (Conafor). The samples were dried at ambient temperature, ground and sifted using meshes with 2 and 0.5 mm pore openings, in order to obtain fine fractions (used in the conventional analyses) and coarse fractions (utilized to capture spectrums in VIS-NIR), respectively. The samples were subsequently stored at ambient temperature in hermetically closed plastic containers.
Conventional analyses
The samples were analyzed using conventional methods, based on the coarse fraction of the soil. The values for total carbon (TC) and total nitrogen (TN) were estimated using the Dumas method in a (ThermoScientific) Total Flash 2000 Total Elemental Analyzer. Between 20 and 50 mg of soil previously dried at ambient temperature and sifted 150 μm were weighed (OAHUS PA224C analytical scale). The samples were calcined (Thermo Scientific Flash 2000 elemental analyzer) at 950 °C, using oxygen as oxidizing agent (AOAC, 2005). The content of inorganic carbon (IC) was estimated based on the determination of total carbonates, using the Bernard calcimeter method, which measures the volume of CO2 emitted by the sample when reacting to the presence of HCl (Gaucher, 1971). The content of organic carbon (OC) was determined by the difference between the total carbon minus the inorganic carbon obtained from the total carbonates analysis.
Development of the NIR model
This consisted of four basic stages: analysis of all the samples using conventional methods, obtainment of the spectrum of each sample, calibration of the regression equations and validation of the model (Macías et al., 2015). The VIS-NIR model was developed using a (FOSS) NIR 6500 Feed and Forage analyzer. Previously to the capture of the spectrums, the performance tests were run in order to ensure that the equipment was working correctly. The average measured reflectance was 32 scans per simple in a wave-length interval of 400 to 2 500 nm (visible region and near-infrared region), with 2 nm between collected data points, for a total of 1 050 spectral points.
Calibration. 448 samples selected through a discriminative analysis based on Mahalanobis distances (H) were utilized, which allow reducing the number of spectral bands by means of the principal component analysis (PCA). Variables representing a large proportion of the variability of the initial bands are thereby obtained, and the extreme values are those with a distance of more than 3. This procedure is helpful for identifying and eliminating biased data (outliers), which, when incorporated to the model, reduce its reliability (Pell, 2000). The analyses mentioned above have been widely used for managing soil spectral responses (Guerrero et al., 2010; Gogé et al., 2012).
The calibration equation was obtained using the winISI v4.20 software (Infrasoft International, 2010), with modified partial least squares regression (MPLS) between the results of the conventional methods and spectral data generated in the region between 400 and 2 500 nm.
The following mathematical treatments were previously applied: SNV (Standard Normal Variate) and Detrend, for the correction of dispersion and particle size problems, and adjustments to the baseline and trend of the data, respectively, as well as a 2,4,4,1 array, where the first number indicates the derivative applied for improving the spectral solution, the second refers to the interval between the calculated derivatives, the third is the length of the segment that will be softened with the purpose of minimizing the spectral noise, and the fourth indicates that the second softened segment was not utilized.
Validation. The validation of the prediction model was carried out with 46 of the total samples received, which were not included in the calibration process. These were used to determine the accuracy and precision of the model developed for predicting the various parameters of interest, through a comparison between the predicted values and the values estimated using the traditional methods. The capture of spectrums was carried out with the ISIscan v3.1 software (Infrasoft International, 2010), with the same parameters that were utilized in the calibration process, while the chemometric operations were performed using the winISI v4.20 software (Infrasoft International, 2010).
The accuracy of the model was evaluated based on the determination coefficient (R2) and the relationship between the standard prediction error and the standard deviation of the samples (RPD) (Minasny and McBratney, 2013). An R2 value of 0.66 to 0.81 indicates a good model; an R2 of 0.82 to 0.90 reveals a good prediction, while an R2 of more than 0.91 is considered excellent (Williams, 2003). For the RPD values, this study utilized the criteria developed by Chang et al. (2001), who define three categories: A= RPD> 2.0: good; B= 1.4≤ RPD ≤ 2.0: acceptable, and C: RPD <1.4: unreliable.
Results
The values predicted by the developed VIS-NIR model for OC ranged between 0.02 % and 18.29 %, with a mean of 5.45 % (Table 1). The values for TN ranged between 0.002 % and 1.445 %, from very low (<0.05 %) to very high (>0.25 %), according to the NOM-021-SEMARNAT-2000, 73 % of the samples had a very high total nitrogen content, while only 3 % were classified as having a very low content.
Table 1 Descriptive statistics of the conventional analysis values and the values predicted with VIS-NIR for OC and TN.
| Organic Carbon (%) | Total Nitrogen (%) | |||||||
|---|---|---|---|---|---|---|---|---|
| Medium | Min | Max | SD | Medium | Min | Max | DS | |
| Reference | 5.42 | 0.23 | 21.02 | 3.90 | 0.48 | 0.005 | 2.004 | 0.38 |
| VIS-NIR | 5.45 | 0.02 | 18.29 | 3.48 | 0.46 | 0.002 | 1.445 | 0.29 |
SD = Standard deviation
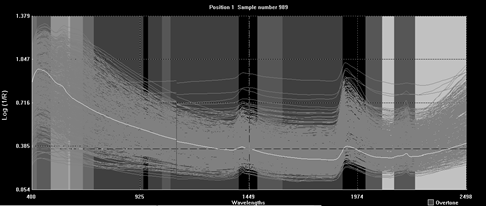
Figure 2 shows the spectrums generated in the VIS-NIR region. In the VIS region, peaks can be observed between 450 and 600 nm, which are partly related to the OC content of the soil (Viscarra et al., 2006). In the NIR interval, the spectrums had higher absorbance peaks, approximately at 1 400, 1 900 and 2 200 nm. The O-H and aliphatic C-H molecules are located in the 1400 nm band; the amide N-H and the O-H occur at 1 900 nm, while the 2 200 nm band is generally associated with phenolic O-H, amine N-H, and the aliphatic C-H group (Cozzolino and Morón, 2003).
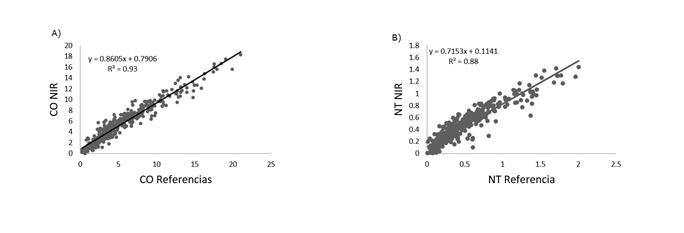
The R2 values obtained for the calibration models were 0.93 for OC and 0.88 for TN (Figure 3). In the case of the RPD, they were 2.69 for OC and 2.05 for TN; the models are therefore rated as having a good predictive capacity, within category A, as defined by Chang et al. (2001).
In the validation, the R2 values for OC and TN were 0.92 and 0.91, respectively, and those of RPD were above 2 for both.
Discussion
Today there are 3 999 million hectares of forests in the world (30.6 %) (MacDicken et al., 2016), whose carbon (C) is estimated in 861 Pg (1 Pg=1 × 1 015 g), 383 Pg of which are in the soil (44 %) (Pan et al., 2011). Moreover, edaphic N gives fertility to the soil, allowing the development of forest areas which, in turn, provide various environmental services to society (Ruiz et al., 2007).
While the development of NIR predictive models for OC have focused in forest areas, due to the importance of the carbon sequestration process, several studies on the TN content have been performed in agricultural areas (Wetterlind et al., 2008; Zhang et al., 2016), due to the importance of this element in the growth and development of the crops, with the purpose of developing optimal fertilization methodologies.
The models generated in this study exhibited a high level of correlation and a good predictive capacity. In the case of OC, the most robust had an R2 of more than 0.9 and an RPD above 2; these figures coincide with those obtained before (McCarty et al., 2002; Sarkhot et al., 2011; Kodaira and Shibusawa, 2013). The average R2 of various OC models with NIR, according to a study by Viscarra et al. (2006), was 0.81.
The models for TN have also exhibited good adjustments (Reeves and McCarty, 2001). The R2 intervals for TN ranged between 0.68 and 0.98 (Nduwamungu et al., 2009).
Figure 3 shows that the OC, which expressed a better fit than TN, has less data dispersion. This may be due to the low values of total soil nitrogen, for, although in the NIR region the radiation is absorbed by chemical bonds such as C-H, N-H, S-H, C = O and O-H of any chemical bond occurring in the sample, it is absorbed in proportion to the concentration of these compounds (Zornoza et al., 2008). Furthermore, as shown in Table 1, the TN values are very low, compared to those of OC, with a C/N ratio of 10:1 in the values of the mean, the maximum reference values and the values predicted by VIS-NIR.
Although the model developed for nitrogen is considered to have good predictive capacity, the statistical metrics can be improved by extending the number of samples, as well as by verifying the assumption of normality of the data, which, though not an indispensable requirement, improves the predictive capacity of the model (Diggle and Ribeiro, 2000).
The spectral bands agree with the data reported by other authors (Fidencio et al., 2002; Zhang et al., 2016). The VIS-NIR regions exhibited absorption of O-H (1 400 and 1 900) and C-H (2 200 nm) bonds; both overtones are related to the organic matter (Salgó et al., 1998) and associated with the micro- and macro-elements occurring in the soil fraction in the form of various compounds (Cozzolino and Morón, 2003).
The independent validation group also presented a good correlation with R2 values above 0.9 and RPD values above 2 for both OC and TN. This suggests that the models developed have a good predictive capacity (Chang et al., 2001) for the analyzed properties.
The soil OC and TN concentrations are properties that possess a broad theoretical base in regard to predictive models (Barthès et al., 2010; Macías et al., 2015; Terra et al., 2015; Sisouane et al., 2017). However, once the calibration equations have been developed, they must be continually validated, with independent samples, but within the interval considered in the initial model. Subsequently, the validated samples can be added to the initial database, which allows the development of new models with a wider interval, and therefore with greater predictability. This deserves special attention in the case of Mexico, since, due to its great variety of soils, a large number of samples is required to design models that can be applied at the national level.
Conclusions
The R2 and RPD values in both the calibration and the validation processes evidence the high predictive value of the VIS-NIR models for OC and TN concentrations in forest soils.
VIS-NIR spectroscopy has proved to be an alternative technique to the conventional soil analysis methods; it has the potential to carry out rapid and accurate predictions regarding the chemical properties of the soil.
Acknowledgements
The authors wish to express their gratitude to the Comisión Nacional Forestal (National Commission of Forestry) for the support provided in the collection of the samples, as well as to INIFAP for the facilities provided for the analysis of the samples.
REFERENCES
Association of Official Agricultural Chemists (AOAC). 2005. Official Methods of Analysis. Dumas method (990.03) . 15th edition. AOAC International. Washington DC, USA. 771 p. [ Links ]
Barthès, B. G., D. Brunet, A. Brauman, N. Fromin, R. Lensi, A. Volant, J. P. Laclau, D. Blavet and L. Chapuis-Lardy. 2010. Determination of potential denitrification in a range of tropical topsoils using near infrared reflectance spectroscopy (NIRS). Applied soil ecology 46(1): 81-89. [ Links ]
Bastidas, O. E. y J. A. Carbonell. 2010. Caracterización espectral y mineralógica de los suelos del valle del río Cauca por espectroscopía visible e infrarroja (400 - 2.500 nm). Agronomía Colombiana 28: 291-301. [ Links ]
Chang, C. W., D. Laird, M. J. Mausbach and C. R. Hurburgh. 2001. Near-infrared reflectance spectroscopy-Principal components regression analyses of soil properties. Soil Science Society of America Journal 65: 480-490. [ Links ]
Cozzolino, D. and A. Morón. 2003. The potential of near-infrared reflectance spectroscopy to analyse soil chemical and physical characteristics. Journal of Agricultural Science 140: 65-71. [ Links ]
Diggle, P. and J. Ribeiro. 2000. Model Based Geostatistics. 1ed. Associação Brasileira de Estatística. São Paulo, Brasil. 129 p. [ Links ]
Fidencio, P. H., R. J. Poppi, J. C. De Andradre and H. Cantarella. 2002. Determination of organic matter in soil using near infrared spectroscopy and partial least squares regression. Communications in Soil Science and Plant Analysis 33: 1607-1615. [ Links ]
Food and Agriculture Organization of the United Nations (FAO). 2006. World reference base for soil resources 2006: A framework for international classification, correlation and communication. World soil resources reports 103. http://www.fao.org/3/a-a0510e.pdf (18 de agosto de 2017). [ Links ]
Fuentes, M., I. González M., J. Hernández H., C. Hidalgo, B. Govaerts, J. Etchevers, K.D. Sayre and L. Dendooven. 2009. The natural abundance of 13C with different agricultural management by NIRS with fibre optic probe technology. Talanta 79: 32-37. [ Links ]
Fuentes, M., C. Hidalgo, I. González-Martín, J. M. Hernández-Hierro, B. Govaerts, K. D. Sayre and J. Etchevers. 2012. NIR Spectroscopy: An Alternative for Soil Analysis. Communications in Soil Science and Plant Analysis 43(1-2): 346-356. [ Links ]
Gaucher, G. 1971. Tratado de pedología agrícola. Ed. Omega. Barcelona. España. 647 p. [ Links ]
Ge, Y., C. L. S. Morgan, S. Grunwald, D. J. Brown and D.C. Sarkhot. 2011. Comparison of soil reflectance spectra and calibration models obtained using multiple spectrometers. Geoderma 161:202-211. [ Links ]
Gogé, F., R. Joffre, C. Jolivet, I. Ross and L. Ranjard. 2012. Optimization criteria in sample selection step of local regression for quantitative analysis of large soil NIRS database. Chemometrics and Intelligent Laboratory Systems 110:168-176. [ Links ]
Guerrero, C., R. Zornoza, I. Gómez and J. Mataix-Beneyto. 2010. Spiking of NIR regional models using samples from target sites: Effect of model size on prediction accuracy. Geoderma 158:66-77. [ Links ]
Instituto Nacional de Estadística y Geografía (INEGI). 2007. Conjunto de Datos Vectorial Edafológico, Serie II, escala 1: 250 000. s/p. [ Links ]
International Union of Soil Sciences (IUSS). 2007. Base Referencial Mundial del Recurso Suelo. Primera actualización. Informes sobre Recursos Mundiales de Suelos Núm. 103. FAO.Roma, Italia. 130 p. [ Links ]
Jarquín S., A., S. Salgado G., D. J. Palma L., W. Camacho-Chiu y A. Guerrero P. 2011. Análisis de nitrógeno total en suelos tropicales por espectroscopía de infrarojo cercano (NIRS) y quimiometría. Agrociencia 45(6): 653-662. [ Links ]
Kodaira, M. and S. Shibusawa. 2013. Using a mobile real-time soil visible-near infrared sensor for high resolution soil property mapping. Geoderma 199:64-79. [ Links ]
Infrasoft International. 2010. Windows near-infrared software: ISI Scan and WinISI-4 version 4.2. State College, PA, USA. n/p. [ Links ]
MacDicken, K., Ö. Jonsson, L. Piña, S. Maulo, V. Contessa, Y. Adikari y R. D’Annunzio. 2016. Global forest resources assessment 2015: how are the world's forests changing? Food and Agriculture Organization, Rome, Italy. 253 p. [ Links ]
McCarty, G. W., J. B. Reeves III, V. B. Reeves, R. F. Follett and J. M. Kimble. 2002. Mid-infrared and near-infrared diffuse reflectance spectroscopy for soil carbon measurements. Soil Science Society of America Journal 66: 640 - 646. [ Links ]
Maestre, C. G., R. Z. Belmonte, A. P. Bejarano, J. Mataix-Solera, I. G. Lucas y F. García-Orenes. 2008. Uso de la espectroscopía en el infrarrojo cercano (NIR) para la estimación rápida del carbono orgánico y la respiración basal en suelos forestales. Cuadernos de la Sociedad Española de Ciencias Forestales 25:209-214. [ Links ]
Macías C., M. A., J. A. Cueto W., J. A. Muñoz V. y O. Landeros M. 2015. Predicción de propiedades del suelo de importancia agronómica por espectroscopia de reflectancia de infrarrojo cercano. Revista Mexicana de Ciencias Agrícolas 6(6): 1317-1329. [ Links ]
Minasny, B. and A. McBratney. (2013). Why you don’t need to use RPD. Pedometron 33: 14-15. [ Links ]
Nduwamungu, C., N. Ziadi, L. E. Parent, G. E. Tremblay and L. Thuries. 2009. Opportunities for, and limitations of, near infrared reflectance spectroscopy applications in soil analysis: A review. Canadian Journal of Soil Science 89(5): 531-541. [ Links ]
Secretaría del Medio Ambiente y Recursos Naturales (Semarnat). 2002. NOM-021-SEMARNAT-2000 que establece las especificaciones de fertilidad, salinidad y clasificación de suelos. Estudios, muestreo y análisis. Diario Oficial de la Federación. 31 de diciembre de 2002. México, D.F., México. 85 p. [ Links ]
Pan, Y., R. A. Birdsey, J. Fang, R. Houghton, P. E. Kauppi, W. A. Kurz, O. L. Phillips, A. Shvidenko, S. L. Lewis, J. G. Canadell, P. Ciais, R. B. Jackson, S. W. Pacala, A. D. Maguire, S. Piao, A. Rautiainen, S. Sitch and D. Hayes. 2011. A large and persistent carbon sink in the world’s forests. Science 333: 988-993. [ Links ]
Pell, R. J. 2000. Multiple outlier detection for multivariate calibration using robust statistical techniques. Chemometrics and Intelligent Laboratory Systems, 52:87-104. [ Links ]
Pérez N., J. C., J. Soler A., G. Arango P., E. Meneses O. and O. S. Ruiz V. 2014. NIR Spectroscopy as Quick Exploratory Technique for Detection of Chrysanthemum Leaf Yellowing (Dendranthema grandiflora var. Zembla). Revista Facultad Nacional de Agronomía Medellín 67(1): 7163-7168. [ Links ]
Plant, R. 2001. Site-specific management: The application of information technology to crop production. Computers and Electronics in Agriculture 30:9-29. [ Links ]
Reeves III, J. B. and G. W. McCarty. 2001. Quantitative analysis of agricultural soils using near infrared reflectance spectroscopy and fibre-optic probe. Journal of Near Infrared Spectroscopy 9: 25-34. [ Links ]
Rodríguez, C., J., A. W. Cortiza M., C. A. Pereira M., A. Chacón I., S. Gattorno M., O. Rodríguez L., A. Rodríguez U., R. Jiménez C. y P. N. Torres A. 2015. Determinación VIS/NIR del contenido de materia orgánica en suelos agrícolas Pardos mullidos medianamente lavados. Centro Agricola 42(3): 5-12. [ Links ]
Ruiz P., M., C. García F. y J. A. Sayer. 2007. Los servicios ambientales de los bosques. Revista Ecosistemas 16(3):81-90. [ Links ]
Salgó, A., J. Nagy, J. Tarnóy, P. Marth, O. Pálmai and G. Szabó-Kele. 1998. Characterisation of soil by near infrared technique. Journal of Near Infrared Spectroscopy 6: 199-203. [ Links ]
Sarkhot, D. V., S. Grunwald, Y. Ge and C. L. S. Morgan. 2011. Comparison and detection of total and available soil carbon fractions using visible/near infrared diffuse reflectance spectroscopy. Geoderma 164:22-32. [ Links ]
Shepherd, K. and M. Walsh. 2007. Infrared spectroscopy - enabling an evidence-based diagnostic surveillance approach to agricultural and environmental management in developing countries. Journal of Near Infrared Spectroscopy 15:1-19. [ Links ]
Sisouane, M., M. M. Cascant, S. Tahiri, S. Garrigues, M. E. Krati, G. E. K. Boutchich, M.L. Cervera and M. de la Guardia, M. 2017. Prediction of organic carbon and total nitrogen contents in organic wastes and their composts by Infrared spectroscopy and partial least square regression. Talanta 167: 352-358. [ Links ]
Terra, F. S., J. A. Demattê and R. A. Rossel. 2015. Spectral libraries for quantitative analyses of tropical Brazilian soils: Comparing vis-NIR and mid-IR reflectance data. Geoderma 255: 81-93. [ Links ]
Terhoeven U., T., H. Schmidt, R. G. Joergensen and B. Ludwig. 2008. Usefulness of near-infrared spectroscopy to determine biological and chemical soil properties: importance of sample pre-treatment. Soil Biology and Biochemistry 40:1178-1188. [ Links ]
Valenciaga, D. y E. D. Oliveira S. S. 2006. La espectroscopia de reflectancia en el infrarojo cercano (NIRS) y sus potencialidades para la evaluación de forrajes. Revista Cubana de Ciencia Agrícola 40(3):259-267. [ Links ]
Viscarra R., R. A., D. J. Walvoort, A. B. McBratney, L. J. Janik and J. O. Skjemstad. 2006. Visible, near infrared, mid infrared or combined diffuse reflectance spectroscopy for simultaneous assessment of various soil properties. Geoderma 131: 59-75. [ Links ]
Wetterlind, J., B. Stenberg and A. Jonsson. 2008. Near infrared reflectance spectroscopy compared with soil clay and organic matter content for estimating within-field variation in N uptake in cereals. Plant and Soil 302(1-2): 317-327. [ Links ]
Williams, P. 2003. Near-infrared Technology-Getting the Best Out of Light. PDK Grain. Nanaimo, Canada. 132 p. [ Links ]
Xie, X. L., X. Z. Pan and B. Sun. 2012. Visible and near-infrared diffuse reflectance spectroscopy for prediction of soil properties near a copper smelter. Pedosphere 22:351- 366. [ Links ]
Zhang, Y., M. Li, L. Zheng, Y. Zhao and X. Pei. 2016. Soil nitrogen content forecasting based on real-time NIR spectroscopy. Computers and Electronics in Agriculture 124: 29-36. [ Links ]
Zornoza, R., C. Guerrero, J. Mataix-Solera, K. M. Scow, V. Arcenegui and J. Mataix-Beneyto. 2008. Near infrared spectroscopy for determination of various physical, chemical and biochemical properties in Mediterranean soils. Soil Biology and Biochemistry 40:1923- 1930. [ Links ]
Received: December 13, 2017; Accepted: April 15, 2018
 Este es un artículo publicado en acceso abierto bajo una licencia Creative Commons
