


Services on Demand
Journal
Article
 text in
  English (pdf)
 Article in xml format
 Article references
 Send this article by e-mail
Indicators
-
 Cited by SciELO
 -
 Access statistics
Related links
-
 Similars in
SciELO
Similars in
SciELO
Share

 Permalink
Revista mexicana de ciencias forestales
Print version ISSN 2007-1132
Rev. mex. de cienc. forestales vol.9 n.47 México May./Jun. 2018
https://doi.org/10.29298/rmcf.v9i47.180
Articles
Contribution and decomposition of leaf litter in temperate forests of the El Salto region, Durango
1División de Estudios de Posgrado. Instituto Tecnológico de El Salto. México.
2Cátedra de Conacyt. El Colegio de Michoacán. México.
3Facultad de Ciencias Forestales. Universidad Autónoma de Nuevo León. México.
In order to know the contribution and decomposition of litter as an ecosystem process through which nutrients are transferred to the soil, two study sites (2 500 m2) were evaluated during one year: El Brillante, where the forest structure is conditioned by Quercus sideroxyla and Pinus cooperi var. ornelasii, and Santa Bárbara, with Cupressus lusitanica and Pseudotsuga menziesii and different composition of species; in each one, ten 1 m2 litter collectors were installed, in which the collection was made every two weeks. This material was separated into components: leaves, reproductive structure, branches, bark, insects, feces and others (moss, resin and unidentified tissue). To measure foliar decomposition, 160 bags with 10 g of dry litter were distributed per site and reviewed each month. Total litter production was 5.9 (El Brillante) and 3.6 Mg ha-1 year (Santa Bárbara). Through a regression analysis, the Simple Negative Exponential model was the best to describe the relationship between the initial and final weight in the decomposition. For the decomposition of 50 and 90 % of the mass of the leaves, the time required was 1.6 and 10.8 years, respectively. El Brillante has a higher production of litter, however, the decomposition process is similar to that of Santa Bárbara. The comparison of averages in the litter contribution and decomposition of the foliar fraction for the study sites was carried out with the non-parametric Mann-Whitney U test.
Key words: Litterfall deposition; litterfall decomposition models; Pseudotsuga menziesii (Mirb.) Franco; Quercus sideroxyla Humb & Bompl.; foliar decomposition rate
A fin de conocer el aporte y descomposición de hojarasca como un proceso ecosistémico a través del cual se transfieren nutrientes al suelo, se evaluaron dos sitios de estudio (2 500 m2) durante un año: El Brillante, donde la estructura forestal está condicionada por Quercus sideroxyla y Pinus cooperi var. Ornelasii; y Santa Bárbara, con Cupressus lusitanica y Pseudotsuga menziesii y diferente composición de especies; en cada uno se instalaron 10 colectores de hojarasca de 1 m2, en los que la recolecta se hizo quincenalmente. Dicho material fue separado en componentes: hojas, estructuras reproductivas, ramas, corteza, insectos, heces y otros (musgo, resina y tejido no identificado). Para medir la descomposición foliar se distribuyeron, por sitio, 160 bolsas con 10 g de hojarasca seca que se revisaron cada mes. La producción de hojarasca total fue de 5.9 (El Brillante) y de 3.6 Mg ha-1 año-1 (Santa Bárbara). Mediante un análisis de regresión, el modelo Exponencial Negativo Simple fue el mejor para describir la relación entre el peso inicial y final en la descomposición. Para la descomposición de 50 y 90 % de la masa de las hojas, el tiempo requerido fue de 1.6 y 10.8 años, respectivamente. El Brillante tiene una mayor producción de hojarasca; sin embargo, el proceso de descomposición es semejante al de Santa Bárbara. La comparación de promedios en el aporte de hojarasca y descomposición de la fracción foliar para los sitios de estudio se realizó con la prueba no paramétrica de U de Mann-Whitney.
Palabras clave: Deposición de hojarasca; hojarasca; modelos de descomposición; Pseudotsuga menziesii (Mirb.) Franco; Quercus sideroxyla Humb & Bompl.; tasa de descomposición foliar
Introduction
The study of biogeochemical cycles is a prerequisite for the development of better strategies in sustainable forest management plans (Mansillas, 2012, Martínez, 2014). Some of the important processes that occur in forests and forests are the decomposition of biomass, the transformation into nutrients and their availability in the soil (Álvarez et al., 2014). Several authors have established as factors of incidence in the production and decomposition of litter, the climatic variables of the site, the composition of species, the nutritional content of litter and the edaphic conditions, for example (Salazar, 2008; Aponte, 2011). On the other hand, the important effects on the initial rates of leaf litter decomposition according to Ibarra et al. (2011) are associated with the micro-climatic changes caused by the reduction in the canopy of the trees and the nutrient contents.
The rate of decomposition of litter in tropical forests is fast compared to that found in forests of temperate-cold climates (Kim et al., 1996). A high production of litter can lead to a low rate of decomposition, biomass increase and the accumulation of nutrients in the surface horizon of soil, which in turn causes a limitation of nutrients for primary producers (Melillo and Aber, 1982; Didham, 1998).The forests of temperate cold climate in the forest region of El Salto, Durango state, are a mixture of species of the Pinus sp. and Quercus sp., often mixed with isolated feet of the Pseudotsuga sp., Arbutus sp. and Juniperus sp. genera, among others (Wehenkel et al., 2011); these forests are mostly characterized by some type of forest management (SRNyMA, 2006).
Therefore, the theoretical assumptions that frame this research express that the type of plant community does not influence the contribution of leaves and the decomposition of the foliar fraction in the study sites. Thus, the leaf production and its decomposition rate were quantified and the results obtained between them were compared. Under the previous premise, the objective of the work described here was to quantify litter production and the rate of decomposition in two temperate forest sites in the Pueblo Nuevo, Durango region. These findings offer useful elements of the material that the soil receives to the managers of temperate forests.
Materials and Methods
The present investigation was carried out during one year (March 2016 to February 2017) in the El Brillante ejido of Pueblo Nuevo municipality, located southwest of the state of Durango between the geographic coordinates of 23°40'30" and 23°50'35" north and 105°30'30" and 105°19'30" west, which were recorded with a GPS Garmin® Rino 650 navigator (Figure 1). Sampling was carried out in two study sites: i) El Brillante within a forest area dominated by Quercus sideroxyla Humb & Bompl species. and Pinus cooperi var. ornelasii Martínez., and, ii) Santa Bárbara within a stand located in the state reserve conservation area of the same name, with an extension of 53.9 ha with a mixture of Pinus sp., Abies sp., Picea sp. and Pseudotsuga sp., among others. The two localities belong to the area of the physiographic subprovinces known as the Gran Meseta and Cañones Duranguenses (Great Plateau and Duranguenian Canyons) and Mesetas y Cañadas del Sur (Plateaus and South Gullies), from hills at altitudes close to 2 500 to 3 000 masl, at bottoms of ravines up to 700 masl (Inegi, 2015).

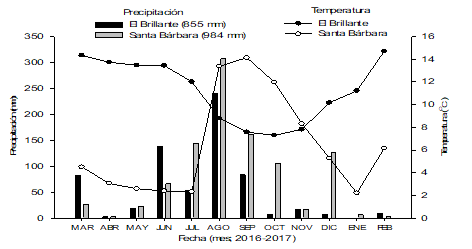
The subhumid -semicold (C (E) (W2)) climates prevail, with rains in summer, as well as the temperate-subhumid climate (C (W2)) and average annual average rainfall of 1 200 mm (García, 1988). As a consequence of the cold fronts that arrive in the direction of NE, from September to March, frosts occur with temperatures of up to -8 °C; and, with those of NW direction, when combined with the humidity of the Sea of Cortez, they can produce winter rains or snow. The maximum speed of the winds ranges between 60 and 65 km h-1.
The study sites are located 17 and 20 km from the town known as El Salto, Pueblo Nuevo, respectively. The distance between El Brillante and Santa Bárbara is 1.5 km.
Description of the vegetation
Each site measured 50 × 50 m. (El Brillante and Santa Bárbara), which were delimited with a Truper® CM112 50 m diameter tape. The species of all the individuals present was recorded. The normal diameter (d, cm) was measured with a Haglöf Mantax Blue 950Mm caliper; total height (h, m) with a Vertex Laser IV Haglöf HS102 hypsometer and crown coverage (CC, m2 ha-1), which came from two measurements, north-south and east-west (León et al., 1996), with a CM112 50 m Truper® measuring tape. With these data, the Importance Value Index (IVI) and the Shannon-Wiener species diversity index (H') were calculated.
Environmental variables
HOBO type automated sensors (Family H8, Forestry Suppliers, Inc.) were installed to record the ambient temperature (°C) with hourly basis. The daily amount of rainfall (mm) was quantified by an automated Davis® rain gauge S-RGC-M002, connected to a HOBO Event Onset recorder.
Leaf litter contribution
Under a completely randomized experimental design, in each study site, 10 1.0 × 1.0 m litter traps or collectors were installed with a 10 cm high wooden frame, whose bottom was covered with fine plastic mesh (1.0 mm) to avoid the accumulation of rainwater. These traps were placed at a height of 50 cm above the ground. Litter collection and quantification was at 15-day intervals from March 15, 2016 to February 28, 2017. Samples were sorted by trap number and / or repetition and date of sampling; later they were analyzed in the Chemistry Laboratory of the Technological Institute of El Salto and separated by fractions or components according to the classification of Arunachalam et al. (1998). Additionally, the fraction of insects and feces contained in the samples was incorporated to gain a better perspective of the characteristics of the deposition process (Veneklass, 1991; Domínguez, 2009; Ávila and Zamora, 2010).
The fractions or components studied were: i) leaves, ii) reproductive structures (flowers, fruits and seeds), ii) branches (<2.0 cm in diameter), iii) bark, iv) insects and feces, and v) other components (moss, resin and unidentified materials). Once the litter was classified, it was dried in a Yamato Scientific America Inc. DNE910 forced convection oven at 65 °C for 72 hours, until obtaining a constant dry weight (Mg ha-1 year-1), for this purpose a digital balance was used (Explorer Pro brand, EP214C model), with thousandths of a gram resolution.
Leaf litter decomposition
To estimate the decomposition rate of the foliar fraction, 10 grams of leaves previously dried at 65 °C were placed for 144 hours in 20 × 15 cm bags of nylon fabric (1 mm). 16 bags were installed per trap or repetition for a total of 160 bags (Bärlocher, 2005). All bags were covered with a layer of organic matter from the same site. The samples were collected at intervals of 5, 10, 15, 20, 30, 60, 90, 120, 150, 180, 210 and 360 days, during the evaluation period. Each collection consisted of a sample of 10 bags (1 per basket or repetition).
Degradation of leaf litter in the bags was determined according to the difference in initial dry weight and final dry weight (expressed as a percentage):
Where:
PR (%) = Ratio of residuary weight
X t = Dry weight along t time (days)
X 0 = Initial dry weight
To describe the decomposition process, the data obtained from dry weight loss were used in the evaluation of different linear, allometric, exponential, potential functions and the Simple Negative Exponential Model proposed by Olson (1963).
Statistical analysis
Given the characteristics of the variables studied, in this work we used the Kruskal-Wallis non-parametric test (Ott, 1993) to test the hypothesis of normality, using the Shapiro Wilk and Levene test (Steel and Torrie, 1980) in the Software Statistical Package for the Social Sciences (SPSS) version 24 (SPSS, 2016).
The normality tests showed that the data do not come from a normal population; therefore, the comparison of averages in litter contribution and decomposition of the foliar fraction for the study sites was carried out with the nonparametric Mann-Whitney U test. The Bonferroni correction method (Wackerly et al., 2002) was applied for a significance level of 0.05, with a selection criterion of P <0.025.
The analysis of the adjustment capacity of the equations used to estimate the rate of leaf decomposition was based on the graphs of the residuals and the values of two statistics: the coefficient of determination (R2) and the root of the mean square error (RMCE).
Finally, the adjustment of the decomposition equations was performed in the "nls" function of R (R Core Development Team, 2016).
Results and Discussion
Tree structure
The main characteristics in the structure and floristic composition of the El Brillante and Santa Bárbara study sites are shown in Table 1.
Table 1 Structure and floristic composition of El Brillante and Santa Bárbara.
| Study site | Species | Individuals | F (%) | Coverage (m 2 ) | Mean height (m) | D | Do | H´ | IVI |
|---|---|---|---|---|---|---|---|---|---|
| El Brillante | Quercus sideroxyla Humb. & Bonpl. | 323 | 51.0 | 861.66 | 2.09 | 31.07 | 18.91 | 0.36 | 100.99 |
| Arbutus xalapensis Kunth | 29 | 5.98 | 89.45 | 2.45 | 8.26 | 1.16 | 0.20 | 15.40 | |
| Juniperus deppeana Steud. | 19 | 6.17 | 80.86 | 2.73 | 6.78 | 3.24 | 0.18 | 16.19 | |
| Pinus strobiformis Engelm. | 46 | 13.17 | 661.47 | 6.39 | 16.18 | 14.92 | 0.29 | 44.27 | |
| Pinus cooperi var. ornelasii Martínez | 68 | 13.09 | 978.14 | 8.03 | 29.85 | 55.18 | 0.36 | 98.12 | |
| Alnus acuminata Kunth | 17 | 10.60 | 56.70 | 2.30 | 7.86 | 6.59 | 0.20 | 25.04 | |
| Total | 502 | 100 | 2 728.20 | 100 | 100 | 1.61 | 300 | ||
| Santa Bárbara | Abies religiosa (Kunth) Schltdl. et Cham. | 31 | 9.54 | 198.82 | 4.69 | 2.52 | 9.24 | 0.09 | 21.30 |
| Alnus acuminata Kunth | 5 | 4.29 | 9.56 | 1.36 | 0.01 | 3.51 | 0.00 | 7.80 | |
| Cupressus lusitanica L. | 185 | 40.27 | 1 755.00 | 7.81 | 26.55 | 28.74 | 0.35 | 95.56 | |
| Fraxinus uhdei (Wenz.) Lingelsh. | 7 | 6.14 | 197.12 | 7.21 | 0.99 | 5.18 | 0.05 | 12.31 | |
| Picea chihuahuana Martínez | 3 | 3.97 | 28.74 | 12.80 | 4.89 | 4.77 | 0.15 | 13.63 | |
| Pinus cooperi var. ornelasii Martínez | 2 | 2.37 | 20.34 | 18.35 | 4.90 | 2.90 | 0.15 | 10.17 | |
| Pinus durangensis Martínez | 3 | 2.78 | 62.71 | 21.77 | 12.47 | 6.23 | 0.26 | 21.49 | |
| Pinus strobiformis Engelm. | 7 | 4.88 | 120.79 | 7.34 | 9.48 | 6.83 | 0.22 | 21.19 | |
| Pseudotsuga menziesii (Mirb.) Franco | 54 | 14.57 | 1 198.06 | 16.55 | 33.94 | 22.94 | 0.37 | 71.45 | |
| Quercus crassifolia Humb. & Bonpl. | 5 | 5.98 | 70.58 | 6.86 | 0.96 | 4.38 | 0.04 | 11.31 | |
| Quercus sideroxyla Humb. & Bonpl. | 7 | 5.20 | 167.05 | 11.63 | 3.29 | 5.29 | 0.11 | 13.79 | |
| Total | 309 | 100 | 3828.76 | 100 | 100 | 1.79 | 300 |
D = Density (trees ha-1); Do = Dominance (trees ha-1); F = Frequency; H´ = Shannon-Wiener Index; IVI = Importance Value Index.
Environmental variables
The average monthly temperature and the monthly rainfall recorded during the study period are illustrated in Figure 2.
Leaf litter contribution
Mean test. Results show differences in the contribution of the leaves fraction in both study places, so the hypothesis that there are no differences in the contribution of leaves in the study sites is rejected.
Comparison of means by tree fraction. When analyzing the components independently and the total litter by date of sampling (Figure 3), these results coincide with those reported by Rocha and Ramírez (2009) and López (2014) in a pine-oak forest under different successional conditions in Chiapas, who found significant differences in annual litter production. These variations can be attributed to the particular characteristics of the floristic composition, phenology of the species and structure of the plant communities in the study sites. The annual deposition dynamics of total litter and component production during the investigation period is shown in Figure 3.

The plotted values correspond to the mean ± standard error.
Fecha = Date; Días = Days; MAR = March; ABR = April; MAY = May; JUN = June; JUL = July; AGO = August; SEP = September; OCT = October; NOV = November; DEC = December; Deposición del componente hojas = Deposition of leaves component; Deposición del componente ramas = Deposition of branches component; Deposición del componente estructura reproductiva = Deposition of reproductive structure component; Deposición del componente corteza = Deposition of cortex component; Deposición de otros component = Deposition of other components; Deposición insectos y heces = Deposition of insects and feces.
Figure 3 Deposition of the components a) leaves; b) branches; c) reproductive structure; d) cortex; e) other components and f) insects and feces.
Total litter. When comparing the total litter production in the two study sites, statistical differences were detected (P <0.015). In general, El Brillante presented a greater gain in the contribution of total litter (5.9 Mg ha-1 year-1) compared to Santa Bárbara (3.6 Mg ha-1 year-1). The total annual production in the first site coincides with the results documented by Pérez (2009) for a pine and oak forest in central Mexico, when it registered fine litter production of 5.9 Mg ha-1 year-1. The dynamics of deposition is observed in Figure 4.
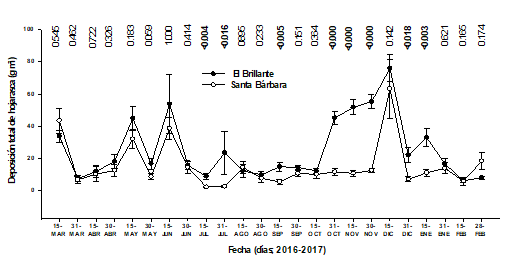
Fecha = Date; Días = Days; Deposición total de hojarasca = Total leaf litter deposition; MAR = March; ABR = April; MAY = May; JUN = June; JUL = July; AGO = August; SEP = September; OCT = October; NOV = November; DEC = December
Figure 4 Total leaf litter deposition.
Unfortunately, due to the shortness of the work period and the lack of information on some variables such as biotic and abiotic factors, it was not possible to make a more detailed analysis of the results obtained, which makes it difficult to reach a more sustained conclusion about the agents that affect production in the sites studied (Cutini, 2002). With the results obtained it can be affirmed that the total litter production is not related to the reproductive structures of the species studied, so the contribution per component on this occasion was similar to that of González et al. (2013) at the Tamaulipan Thorny Scrub in northeastern Mexico, and to that reported by Ávila and Zamora (2010) in a study on an isolated coffee agroforestry system in Ocotal Chico, Veracruz, Mexico.
It is worth mentioning that the different methodologies used, the particular characteristics of the study sites and the separations of the leaf litter components make it difficult to compare the results obtained with other investigations (Rocha and Ramírez, 2009).
Leaves. The leaves are the component of greatest proportion in the total accumulation of litter, which corresponds to 74.8 % (4.4) and 46.4 % (1.6 Mg ha-1 year-1) in El Brillante and Santa Bárbara, respectively. When practicing the statistical analysis of the total production of leaves, significant differences were verified between the averages of both sites (P <0.001). In Santa Bárbara the records place production below those obtained by Martínez (2014) for a forest without management, and those of Ibarra et al. (2011) in Chilean natural forests with Nothofagus pumilio (Poepp. & Endl.) Krasse, with a litter deposition of 6.5 Mg ha-1 year-1 for the first and 3.8 (virgin forest) for the second.
On the other hand, when contrasting the production of El Brillante with the results of Ibarra et al. (2011) within the same investigation in which the litter accumulation was of 2 and 2.8 Mg ha-1 year-1 in a forest under short protection and thinned forests, respectively, the results place it above such data.
Branches. The contribution in the production of branches was higher in Santa Bárbara than in El Brillante, but, when its statistical comparison was made, no significant differences were found between their averages (P <0.224). Branches represent the second component with the highest contribution to total litter production; for El Brillante it provides 14.1 % (0.8) and for Santa Bárbara, 28.3 % (1 Mg ha-1 year-1). The figures calculated in the present study are above those recorded by Nájera and Hernández (2009) (0.7 Mg ha-1 year-1), in contemporary forests of the El Salto, Pueblo Nuevo, Durango region.
Reproductive structure. When comparing the production of reproductive structures between the study sites, El Brillante had the lowest percentage. On the other hand, when statistically contrasting the total production of this component, there are no differences (P <0.293). This variable obtained the fourth position in the total production in El Brillante and the third place in Santa Bárbara. Its accumulation in the first locality was 3.9 % (0.2 Mg ha-1 year-1) of the total litter production, while for Santa Bárbara the average production of the contribution was 10.2 % (0.3 Mg ha-1 year-1) of the total. The amounts recorded for both study sites are below that obtained by Vargas and Varela (2007), which was 0.9 Mg ha-1 year-1.
Bark. The highest average of this tree part came from the Santa Bárbara site contributing with 8.4 % (0.3 Mg ha-1 year-1) to the total litter production, while at El Brillante it was 4.4 %. (0.2 Mg ha-1 year-1). However, when analyzing the total bark deposition, it does not seem to differ statistically between the study sites (P <0.458). This component ranks fourth in total litter production. Comparing these results with those obtained by López et al. (2013) who studied two species of Pinus in localities of the Sierra de Arteaga, Coahuila State, Mexico, they calculated 0.04 Mg ha-1 year-1 of bark only from P. cembroides Zucc. The values found in this research seem to be higher to those recorded in literature.
Other components. When analyzing the average production of this item among the study sites, the results indicate that the highest values that contribute to total litter production are recorded in El Brillante, with 6.0 % (0.1 Mg ha-1 year-1), while in Santa Bárbara, 2.4 % (0.2 Mg ha-1 year-1). Their total sum points out that they differ significantly between the sites of interest (P <0.043). The referred variable occupies the fifth position in the total litter production. In this context, Rocha (2006) documented 0.07 Mg ha-1 year-1 in a forest of pine and oak, and Vargas and Varela (2007), 1.5 Mg ha-1 year-1.
Insects and feces. During the study period, this component was higher at the Santa Bárbara site; the maximum value represents 0.3 % (0.01 Mg ha-1 year-1) of the total production and statistically there seems to be no difference in the total contribution of this variable (P <0.103). It is close to the values obtained by Ávila and Zamora (2010) that fluctuated around 0.001 (medium forest) to 0.01 Mg ha-1 year-1 (deciduous forest).
Leaf litter decomposition
The comparison of the average rate of the foliar component in the study sites through the Kruskal-Wallis test is shown in Figure 5; suggests a similar pattern of decomposition from the fourth month, for both locations, so that the hypothesis is accepted in relation to the decomposition process. When the loss of organic mass was contrasted at the end of the study (1 year), the percentage of decomposition for the first site of interest was 31.7 %, while for the second it was 34.7 %. These values coincide with those of Ibarra et al. (2011) over a period of two years in stands of Nothofagus pumilio in the Magallanes region, where they documented variations in the relative mass of the litter. On the other hand, in the decomposition study of the foliar fraction of Pinus patula Schiede ex Schltdl. & Cham., Martínez (2014) showed that in none of the sites studied the percentage of litter weight reduction was different.
The decomposition rate was different from the one calculated by Martínez (2014), in which the process is greater in the first months and then its slope is significantly reduced. This slow decomposition can be attributed to the chemical characteristics of the litter (variables not analyzed in the present research), the composition of species and water availability. The decomposition dynamics is observed in Figure 5.

Fecha = Date; Días = Days; Masa remanente = Remainder mass
Figure 5 Remainder mass of the foliar fraction through time (days).
Berg (2000) mentions that in the first months of decomposition, the concentration of water-soluble substances decreases rapidly, while lignin (in large quantities in pine needles) does not decompose so fast. In addition, the presence of substances such as N can limit the decomposition of organic matter (Prause and Lifschitz, 2001).
The decomposition rate in El Brillante and Santa Bárbara seems to be more similar to that calculated by Verdú (1984) who recorded a loss of 25.7 % in 374 days for Quercus ilex L. and 16.8 % for Abies alba Mill.in 354 days.
To assess the decomposition process, several linear, allometric, potential and exponential mathematical models were tested (Table 2); the residuals were taken into account and, due to the nature of the data, the Simple Negative Exponential Model proposed by Olson (1963) was selected (Figure 6).
Table 2 Regression models used to estimate the remaining mass of the foliar fraction in the two study sites.
| Study sites | Equation | Model | Estimator | Statistics | ||
|---|---|---|---|---|---|---|
| 𝛃0 | 𝛃1 | R2 | RECM | |||
| El Brillante |
|
(1) | 1.019 | 0.001 | 0.969 | 0.022 |
| Santa Bárbara | 0.987 | 0.001 | 0.965 | 0.023 | ||
| El Brillante |
|
(2) | 1.011 | -0.000 | 0.971 | 0.021 |
| Santa Bárbara | 0.097 | -0.000 | 0.961 | 0.024 | ||
| El Brillante |
|
(3) | 0.247 | -0.091 | 0.741 | 0.077 |
| Santa Bárbara | 0.218 | -0.092 | 0.761 | 0.073 | ||
| El Brillante |
|
(4) | 1.237 | -0.082 | 0.726 | 0.066 |
| Santa Bárbara | 1.203 | -0.083 | 0.740 | 0.063 | ||
| El Brillante |
|
(5) | -0.328 | 0.686 | 0.447 | 0.094 |
| Santa Bárbara | -0.360 | 0.688 | 0.450 | 0.091 | ||
β0, β1= Parameters of the model; R2 = Coefficient of determination; RECM = Root mean square error.

The plotted values correspond to the mean (n = 10). The solid line refers to data from the El Brillante site and the dotted line to the Santa Bárbara site.
Fecha = Date; Días = Days; Masa remanente = Remainder mass
Figure 6 Estimation of the remaining organic mass of the foliar component with Model 1.
The parameters are similar to those by Del Valle (2003), Ibarra et al. (2011) and Castellanos and de León (2011), who tested exponential models with good statistics of fit.
The decomposition rate (constant K) during the evaluated time was very similar in the two study sites evaluated -0.424 for El Brillante and -0.425 year-1 for Santa Bárbara. In both places, the time required for the decomposition of the foliar fraction of 50 and 90 % was 1.6 and 10.8.
Conclusions
Two sites with different species composition were compared in this study; the most tolerant (Pinus sp. and Quercus sp.) contribute the most leaf litter in El Brillante. The greatest diversity of species occurred at the Santa Bárbara site (11 species), however, the dominance of the forest structure is conditioned by intolerant species (Pseudotsuga sp. and Cupressus sp.) with very small leaves and more pronounced delivery rates.
When analyzing the decomposition process of the foliar fraction in situ, the rate or rythm of mass loss was the same in both study sites; this finding confirms that it is the same climate unit, therefore, it is advised to replicate this assay in different qualities of site and above all, control the species that provide the leaves.
The five decomposition models evaluated showed good statistical fits in terms of the coefficient of determination and the mean square error. But when taking residuals into account, all except the Simple Negative Exponential Model showed autocorrelation of errors. The model proposed here, which estimates the remaining leaf fraction as a capital placed at a negative rate of compound interest (the decomposition rate) was statistically greater than or equal to most traditional models.
Acknowledgements
The support for the accomplishment of the actual research study came from the projects Ciclos biogeoquímicos en bosques de la Sierra Madre Occidental de la región de El Salto, Durango, México (Biochemical cycles in forests of the Western Mountain Chain of the El Salto region, Durango, Mexico) [Proyecto TECNM. 5746.16-P], and Deposición de hojarasca en tres sitios de la Sierra Madre Occidental, Durango, México (Leaf litter deposition in three sites of the Western Mountain Chain, Durango, Mexico) [Proyecto SEP-ITM-ITESA-PTC-002].
REFERENCES
Álvarez A., O., P. Cairo C., A. Mollineda T., Y. García L., P. Torres A., A. Rodríguez U. y F. Cuevas H. 2014. Caracterización química de la biomasa del Bambú (Bambusa vulgaris Schrader ex. Wendlan): perspectivas para su utilización. Centro Agrícola 41 (2):91-93. [ Links ]
Aponte, C. 2011. Interacciones planta-suelo en un bosque mediterráneo. Ecosistemas 20 (2): 95-100. [ Links ]
Arunachalam, A., K. Arunachalam M., H. Pandey N. and R. Tripathi S. 1998. Fine litterfall and and nutrient dynamics during forest regrowth in the humid subtripics of north-eastern India. Forest Ecology and Management 110: 209-219. [ Links ]
Ávila B., C. H. y P. Zamora M. 2010. Producción de hojarasca y materia orgánica en agroecosistemas cafetaleros marginales de Ocotal Chico, Veracruz, México. Polibotánica 30: 69-87. [ Links ]
Bärlocher, F. 2005. Leaf mass loss estimated by litter bag technique. In: Graca A., S., F. Barloche and O. Gessner M. (eds.). Methods to study litter decomposition: a practical guide Springer-Verlag. Dordrecht, Germany. pp. 37-42. [ Links ]
Berg, B. 2000. Litter decomposition and organic matter turnover in northern forest soils. Forest Ecology and Management 133: 13-22. [ Links ]
Castellanos B., J. y J. de León P. 2011. Descomposición de hojarasca y liberación de nutrientes en plantaciones de Acacia mangium (Mimosaceae) establecidas en suelos degradados de Colombia. Revista de Biología Tropical 59 (1): 113-128. [ Links ]
Cutini, A. 2002. Litterfall and leaf area index in the CONECOFOR permanent monitoring plots. Journal of Limnology 61:62-68. [ Links ]
Del Valle A., J. I. 2003. Descomposición de la hojarasca fina en bosques pantanosos del pacífico colombiano. Interciencia 28 (3):148-153. [ Links ]
Didham, R. 1998. Altered leaf-litter decomposition rates in tropical forest fragments. Oecologia 116: 397-406. [ Links ]
Domínguez, G. T. 2009. Deposición de hojarasca y retorno potencial de nutrimentos en diferentes comunidades de vegetación. Tesis de Maestría. Facultad de Ciencias Forestales, Universidad Autónoma de Nuevo León. Linares, NL., México, 133 p. [ Links ]
García, E. 1988. Modificaciones al Sistema de Clasificación Climática de Köppen. http://www.igeograf.unam.mx/sigg/utilidades/docs/pdfs/publicaciones/geo_siglo21/serie_lib/modific_al_sis.pdf (2 de noviembre de 2017). [ Links ]
González R., H., R. G. Ramírez L., I. Cantú S, M. V. Gómez M., M. Cotera C., A. Carrillo P. y J. J. Marroquín C. 2013. Producción de hojarasca y retorno de nutrientes vía foliar en un Matorral Desértico Micrófilo en el Noreste de México. Revista Chapingo Serie Ciencias Forestales y del Ambiente 19 (2):249-262. [ Links ]
Ibarra, M., J. Caldentey y A. Promis . 2011. Descomposición de hojarasca en rodales de Nothofagus pumilio de la región de Magallanes. Bosque 32 (3):227-233. [ Links ]
Instituto Nacional de Estadística, Geografía e Informática (Inegi). 2015. Anuario Estadístico Durango. http://www.datatur.sectur.gob.mx/ITxEF_Docs/DGO_ANUARIO_PDF15.pdf (2 de noviembre de 2017). [ Links ]
Kim, C., T. Sharik and M. Jurgensen. 1996. Canopy cover effects on mass loss, and nitrogen and phosphorus dynamics from decomposing litter in oak and pine stands in northern Lower Michigan. Forest Ecology and Management 80:13-20. [ Links ]
León de la L., J. L., R. Coria B. y M. Cruz E. 1996. Fenología floral de una comunidad árido-tropical de Baja California Sur, México. Acta Botánica Mexicana 35:45-64. [ Links ]
López H., J. M. 2014. Producción de hojarasca y retorno potencial de nutrientes en tres sitios del Estado de Nuevo León, México. Tesis Doctoral. Facultad de Ciencias Forestales, Universidad Autónoma de Nuevo León. Linares, NL., México. 83 p. [ Links ]
López L., J. D., G. Méndez, J. A. Nájera L., P. Cerano, J. D. Flores F. y J. A. Najera C. 2013. Producción de hojarasca en Pinus halapensis Mill. y Pinus cembroides Zucc. y su relación con algunos factores climáticos. Agrociencia 47:495-510. [ Links ]
Mansillas, P. R. 2012. Evaluación de la alteración y restauración de los ciclos biogeoquímicos en bosques de Nothofagus pumilio de Tierra del Fuego afectados por prácticas de manejo forestal. Tesis Doctoral. Facultad de Ciencias Exactas y Naturales Universidad de Buenos Aires. Buenos Aires, Argentina. 140 p. [ Links ]
Martínez C., B. E. 2014. Descomposición de la fracción foliar de Pinus patula Shcltdl.& Cham. y dinámica de la producción de hojarasca en un bosque manejado. Tesis de Maestría. Colegio de Postgraduados Campus Montecillo. Texcoco, Edo. de Méx., México. 112 p. [ Links ]
Melillo, J. and J. Aber. 1982. Nitrogen and ligning control of hardwood leaf litter decomposition dynamics. Ecology 63: 621-626. [ Links ]
Nájera L. J. A., y E. Hernández H. 2009. Acumulación de biomasa aérea en un bosque coetáneo de la región de El Salto, Durango. Ra Ximhai 5(2):225-230. [ Links ]
Olson, J. S. 1963. Energy storage and the balance of producers and decomposers in ecological systems. Ecology 44:322-333. [ Links ]
Ott, L. 1993. An introduction to statistical methods and data analysis. Duxbury Press. Boston, MA, USA. 775 p. [ Links ]
Pérez S., M. 2009. Understanding the role of Pinus cembroides and Quercus potosina in water and nutrient dynamics in a semi-arid forest ecosystem of central-northwest Mexico applying the functional matrix approach. Tesis Doctoral. Instituto Potosino de Investigación Científica y Tecnológica, A.C. San Luis Potosí, S.L.P., México. 98 p. [ Links ]
Prause, J. y P. Lifschitz A. 2001. Ciencia y Técnica. http://www.unne.edu.ar/unnevieja/Web/cyt/cyt/2001/5-Agrarias/A-072.pdf (2 de noviembre de 2017). [ Links ]
Rocha L., A. G. y N. Ramírez M. 2009. Producción y descomposición de hojarasca en diferentes condiciones sucesionales del bosque de pino-encino en Chiapas, México. Boletín de la Sociedad Biológica de México 84:1-12. [ Links ]
R Core Development Team. 2016. RStudio: Integrated Development for R. RStudio, Inc. (3.3.0). Boston, MA. http://www.rstudio.com (2 de noviembre de 2016). [ Links ]
Secretaría de Recursos Naturales y Medio Ambiente (SRNMA). 2006. Programa Estratégico Forestal 2030 para Durango. Durango, Dgo., México. 44 p. [ Links ]
Salazar I., S. 2008. Estudio de procesos ecológicos para el desarrollo sostenible del castaño Castanea sativa Mill. de la sierra de Francia. Tesis Doctoral. Universidad de Salamanca. Departamento de Biología Animal, Ecología, Parasitología, Edafología y Química Agrícola. Salamanca, España. 340 p. [ Links ]
Statistical Package for the Social Sciences (SPSS). 2016. SPSS Statistics. Standard released (Versión 24). for Windows. SPSS Inc. Chicago, IL USA. n/p. [ Links ]
Steel, R. G. D. and J. H. Torrie. 1980. Principles and procedures of statistics. A biometrical approach. McGraw-Hill Book Company. New York, NY, USA. 633 p. [ Links ]
Vargas, P. L. y A. Varela. 2007. Producción de hojarasca de un bosque de niebla en la reserva natural La Planada (Nariño, Colombia). Revista de la Facultad de Ciencias 12: 35-49. [ Links ]
Veneklaas, E. J. 1991. Litterfall and nutrient fluxes in two montane tropical rain forests, Colombia. Journal of Tropical Ecology 7:319-336. [ Links ]
Verdú G., A. M. C. 1984. Circulació de nutrients en tres ecosistemes forestals del Montseny: caiguda de virosta i descomposició de la fullaraca. Tesis Doctoral. Universidad Autónoma de Barcelona. Barcelona, España, 47 p. [ Links ]
Wackerly, D. D., W. Mendenhall and R. L. Scheaffer. 2002. Estadística matemática con aplicaciones. Editorial Thomson International. México, D. F., México. 872 p. [ Links ]
Wehenkel, C., J. J. Corral R., J. C. Hernández D. and K. V Gadow. 2011. Estimating balanced structure areas in multi-species forests on the Sierra Madre Occidental, Mexico. Annals of Forest Science 68: 385-394. [ Links ]
Received: August 26, 2017; Accepted: February 21, 2018
 Este es un artículo publicado en acceso abierto bajo una licencia Creative Commons
