


Servicios Personalizados
Revista
Articulo
 texto en
  Inglés (pdf)
 Artículo en XML
 Referencias del artículo
 Enviar artículo por email
Indicadores
-
 Citado por SciELO
 -
 Accesos
Links relacionados
-
 Similares en
SciELO
Similares en
SciELO
Compartir

 Permalink
Revista mexicana de ciencias forestales
versión impresa ISSN 2007-1132
Rev. mex. de cienc. forestales vol.9 no.45 México ene./feb. 2018
https://doi.org/10.29298/rmcf.v9i45.141
Articles
Diversity and carbon storage in the Permanent Forest Area of Álvaro Obregón, Calakmul, Campeche
1El Colegio de la Frontera Sur. México.
2Investigación y Soluciones Socioambientales, A. C. México.
Permanent Forest Area (AFP) in Álvaro Obregón, Calakmul has semi-evergreen tropical forests that have been exposed to forest management. Considering the importance of these tropical forests as reservoirs of carbon and biodiversity, the objective of this study was to analyze tree diversity, accumulation of biomass and carbon capture in different types of semi-evergreen tropical forests (medium forest - SMSP and floodable forest - SI). Circular plots of 1 000 m2 where used, in which tree species were tagged, measured (height and diameter at 1.30 m) and identified. The AFP that has been in the recovery period for more than 20 years. A richness of 90 species was found in the SMSP, with densities between 5 170 to 3 720 ind ha-1, with intermediate diversity (H) (2.8 to 2.65). In the IS, 75 species were found, with a high density (5 920 to 8 630 ind ha-1), and a high diversity (H) (3.02 to 3.06). The average structural diversity (Hsdh) was low for SMSP and SI, with carbon values between 16.6 and 37.17 MgCha-1 in SMSP and 36.44 to 44.58 in SI. It is concluded that the semi-evergreen tropical forests analyzed are in the process of recovery, with processes of regeneration and capture of carbon important for the conservation of diversity.
Key words: Biomass; composition; conservation; structure; structure diversity; forestry management
El Área Forestal Permanente (AFP) del ejido Álvaro Obregón en Calakmul resguarda selvas subperennifolias que han estado expuestas al manejo forestal. Dada su importancia como reservorios de carbono y biodiversidad, el objetivo de este estudio fue analizar la diversidad arbórea, la acumulación de biomasa y la captura de carbono en diferentes comunidades de dicho tipo de vegetación (selva mediana - SMSP y selva inundable - SI) presentes en el AFP, las cuales están en periodo de recuperación desde hace más de 20 años. El trabajo se realizó en parcelas circulares de 1 000 m2, en donde se etiquetaron, midieron (altura y diámetro a la altura de 1.30 m), e identificaron los taxa arbóreos presentes. En las SMSP se determinó una riqueza de 90 especies, con densidades de 5 170 y 3 720 ind ha-1, con una diversidad (H) intermedia (2.8 a 2.65). En las SI se identificaron 75 especies, con una densidad (5 920 a 8 630 ind ha-1), y una diversidad (H) alta (3.02 a 3.06). La diversidad estructural promedio (Hsdh) fue baja para SMSP y SI, con valores de carbono de 16.6 a 37.17 Mg C ha-1, en SMSP; y 36.44 a 44.58 en SI. Se concluye que las selvas subperennifolias analizadas están en recuperación, con procesos de regeneración y captura de carbono importantes para la conservación de la diversidad.
Palabras clave: Biomasa; composición; conservación; estructura; diversidad estructural; manejo forestal
Introduction
In Mexico, the southern region of the Yucatán peninsula is considered one of the largest rainforest areas; the rainforests in the region of Calakmul stand out because of their diversity, extension and conservation status (Martínez and Galindo, 2002). These have been exposed, from the Maya up to the new settlers who arrived at the end of the decade of the 1960s to various human activities among them are agriculture, stockbreeding and timber extraction (Aryal et al., 2014; García-Licona et al., 2014). This has resulted in a heterogeneous mosaic of vegetation in different successional stages, from mature forests to early stages of succession, which allows them to maintain a high floristic diversity (Martínez and Galindo, 2002; Vester et al., 2007), and to exhibit areas with different potentials as carbon reservoirs (mature forests) or with high rates of carbon capture (early and intermediate successional stages) (Aryal et al., 2014; Aryal et al., 2017).
The rainforests of Calakmul are home to 23 plant associations with more than 1 500 species (Martínez and Galindo, 2002). A carbon storage of up to 99.56 mg C ha-1 is cited for mature forests; 40.89 - 55.52 mg C ha-1 have been estimated for the secondary forests aged 20 to 35 years, and 11.72 - 28.92 mg C ha-1, for secondary vegetation between 4 and 10 years of age.
At the global level, that the loss of biodiversity and the increase in the concentration of carbon dioxide in the atmosphere is considered to contribute to global warming. These are the most important problems from an environmental point of view. It is therefore essential to analyze the potential of the forest areas to contribute to the maintenance of biodiversity and to reduce the concentration of atmospheric CO2. In this context, the objective of this paper is to analyze the tree diversity, the accumulation of biomass and carbon capture by the air component in different types of semi-evergreen (medium and floodplain) forests of the Permanent Forest Area (AFP) of Ejido Álvaro Obregón in Calakmul, Campeche.
Materials and Methods
Location
Ejido Álvaro Obregón is located 10 km away from Xpujil, Calakmul municipality, Campeche, at 265 m of altitude, at the coordinates 18°35'33'' N and 89°25'04'' W. The area is bordered to the north by land owned by the nation; to the south, by Xpujil and the Sinaí; to the east, by Ejido Nuevo Becal, and to the west, by national land and by Ejidos El Porvenir and Valentín Gómez Farías. The soils in the ejido are rendzinas, Vertic and Gleic Gleysols, Gleic Vertisol, and Lithic Cambisol (García and Pat, 2000; Márdero et al., 2012). The climate is warm sub-humid with summer rains (Aw1). The vegetation types correspond to medium semi-evergreen forests (SMQ), low semi-evergreen rainforests (SBQ), and low floodplain semi-evergreen forests (SBQI), known locally as lowlands (Martínez and Galindo, 2002).
The history of forest management in the ejido began around 1940, with the extraction of gum and the consequent occupation of the territory by chicleros camps. By the end of the 1940s, the forestry company Caobas Mexicanas S.A. was established; this company extracted timber from Calakmul and Quintana Roo during almost 40 years (Martínez, 2010). In 1968, the ejido was officially constituted, maintaining its forest vocation. During the 1993-1996 period, a forest inventory system was developed for the Forest Management Program in an area of 10 000 hectares, assigned as the Permanent Forest Area (PFA), which was evaluated in this study. The predominant vegetation of this area is the semi-evergreen forest, particularly the medium-sized and floodplain forests (Herrera-Gloria, 2007).
Selection of plots and sampling design
A tour was made to the PFA of Álvaro Obregón together with the person responsible for the management; six areas were selected: four in the medium semi-evergreen forest (MSEF) and two in the medium floodplain forest (IF). The selection took into account the accessibility of those areas that have not been used for agricultural activities and were excluded from forest utilization since 1990, so that the process of recovery exceeds 20 years.
In each area of selected vegetation a rectangular plot of 20 × 50 m (1 000 m2), subdivided with a 20 × 20 m (400 m2) was established. The arboreal individuals with a diameter at breast height (DBH) of 1 cm or more were labeled, taxonomically identified and measured for height with a Vertex IV, Hanglöf and DBH with a Forestry Suppliers diametric tape model 283D/5m. In the rest of the 1 000 m2 plot, i.e. the remaining 600 m2, took the same data for individuals with DBH equal to or above 2.5 cm.
The taxonomic identification was carried out with the help of two expert parataxonomists (Mr. Demetrio Álvarez Montejo and Mr. Manuel Arana) used the listing of Martínez et al. (2001).
Floristic composition of species, structure of the arboreal vegetation and structural diversity
Based on the data for taxonomic identity, a floristic list was made for each plot, and the taxonomic data were corroborated and, when appropriate, updated with the databases of the The Plant List specialized website (www.theplantlist.org) and of the Missouri Botanical Garden (www.tropicos.org) (The Plant List, 2013; Tropicos, 2013). Both the richness and the number of species were estimated per sampling unit (plot). The diversity was calculated with the Shannon-Wiener index (H') using the formula (Magurran, 2004):
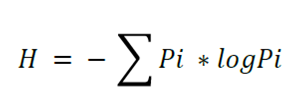
Where:
H = Shannon-Wiener Index
Pi = Relative Abundance
Log = Base 10 logarithm
The population density (ind ha-1) and the basal area (m2 ha-1) were estimated. Likewise, the value of the relative importance of the species per plot (RIV) was calculated, as the sum of the relative abundance (number of individuals per species/total number of individuals of all species * 100), the relative frequency (frequency of a species/sum of the frequency of all species * 100), and the relative basal area (basal area of each species/total basal area of all species * 100) (Magurran, 2004).
The analysis of the horizontal (DPA) horizontal and vertical (height) structures of the vegetation was carried out with the frequency of distributions grouped by class, according to the following formula (Martínez-Sánchez, 2016):

Where:
K = Number of classes
N = Number of trees
On the other hand, the structural diversity -i.e. the diversity estimated as the combination of the diversity of species and the size of the diameter and the height of the trees- was analyzed (Lei et al., 2009; Martínez-Sánchez, 2016). The assessed indicators were the Shannon-Wiener index for species (Hs), by diameter (Hd) and height classes (Hh), and the average structural diversity rate (Hsdh), all of which were calculated using the following formulas:
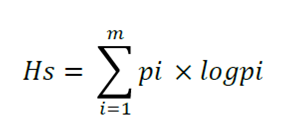
Where:
pi = Proportion of basal area for the species i
m = Number of species
log = Base 10 logarithm
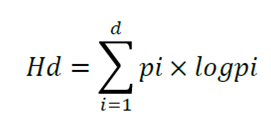
Where:
pi = Proportion of basal area by the diameter class i
d = The number of diameter classes
log = Base 10 logarithm

Where:
pi = Proportion of basal area for the height class i
h= Number of classes of height
log = Base 10 logarithm

Where:
Hs = Diversity by species
Hd = Diversity by diameter classes
Hh = Diversity by height classes
Estimation of biomass and stored carbon
The biomass per individual was calculated with the allometric equations generated for the areas closest to the present study, i.e. those with similar conditions (vegetation type). The previously employed equations were chosen for estimating the biomass in the forests of the region (Aryal et al., 2014).
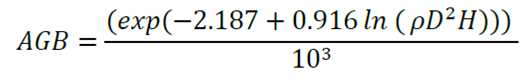
The following formula was used for individuals with normal diameters equal to or above 10 cm (Cairns et al., 2003, modified by Urquiza-Haas et al., 2007):
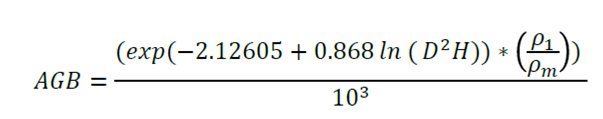
Where:
D = Stem diameter at breast height, i.e. at 1.30 m
H = Total height of the tree
ρ 1 = Density of wood per tree (g cm-3)
ρ m = Average wood density of trees used to generate the equation (0.75 g cm-3)
In the case of individuals with normal diameters between 5 and 9.9 cm, the following expression was used (Chave et al., 2005):
Where:
D = Stem diameter at breast height, 1.30 m
H = Total height of the tree
p = Density of wood per tree (g cm-3)
Finally, the following equation was used for individuals with normal diameters of less than 5 cm (Hughes et al., 1999):
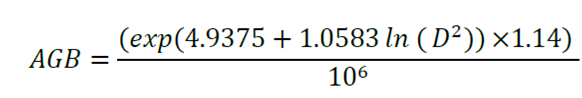
Where:
D = Stem diameter at breast height, 1.30 m
The density of the wood of each species corresponded to the values cited for tropical tree species by various authors (Chave et al., 2006; Zanne et al., 2009). In those cases when the datum was not available, the average density of wood for the sampling site was calculated using the following formula:
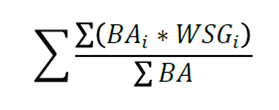
Where:
BAi = Basal area per individual
WSG i = Density of wood by species with known values (g cm-3)
The basal area (BA) was estimated using the following equation:
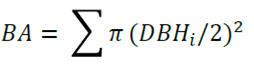
Where:
DBH i = Stem diameter at breast height, i.e. at 1.30 m
The biomass per plot was estimated based on the sum of each of the individuals present. The carbon content in the aerial component was estimated for each individual using the factor 0.47 for the conversion to carbon (Fonseca et al., 2011).
Statistical Analysis
An analysis of normality (Levin’s test) was applied to the calculated variables such as richness of species, density, basal area and carbon content. A univariate analysis of variance (ANOVA) was used to determine significant differences for the density of individuals between different plots, and a Kruskal-Wallis test was utilized to compare this parameter between vegetation types. In the case of the BA, the comparison between plots and between types of vegetal cover was carried out using the Kruskal-Wallis test, as it did not fulfill the assumptions of the ANOVA. These analyses were carried out using the Statistica 2007 software.
The Shannon index values were compared using the Student’s t-test modified by Hutcheson (1970) in order to detect significant differences (p<0.05) between pairs of conditions. The same test was used for the estimated Shannon indices in order to assess the structural diversity.
Results and Discussion
Floristic composition, diversity of species, structure of the arboreal vegetation and structural diversity
A total of 3 146 individuals belonging to 126 species and 37 families were labeled and censused (Table 1); the following families stood out for the number of taxa that they include: Fabaceae (20 species), Polygonaceae (7), Rubiaceae (10), Euphorbiaceae (6), Sapotaceae (6), Sapindaceae (5) and Rutaceae (5), equivalent to 47 % of the species present in the study area.
Table 1 Floristic list of tree species and their abundances in the floodplain forests (FF) and medium semi-evergreen forests (MSEF) analyzed in the Permanent Forest Area of Ejido Álvaro Obregón.

Fabaceae (13), Rubiaceae (8), Polygonaceae (6) and Euphorbiaceae (5) were the best represented families in the FFs, while, Fabaceae (14), Rubiaceae (6), and Polygonaceae (5) were the best represented in the MSEFs. These findings agree with the 10 most frequent families with largest number of species cited for the Yucatán Peninsula (Carnevali et al., 2010).
The most frequent families in the plots have been reported as the most abundant in southern Mexico (Chiquini, 2016; Maldonado-Sánchez et al., 2016; Chiquini-Heredia et al., 2017). The most common families in the MSEF coincide with those of other studies in Calakmul (Lawrence et al., 2004; Vester et al., 2007; Zamorano-Crescencio et al., 2012; García-Licona et al., 2014). The results suggest that the break of over 20 years from forest management has made it possible to maintain the composition, with regard to what would be expected in mature forests of the Yucatán Peninsula, based on the successional processes.
The most abundant species in the FF plots were Pouteria reticulata (Engl.) Eyma (153 individuals), Eugenia winzerlingii Standl. (151 ind) and Croton icche Lundell (120 ind); in the MSEF: Pouteria reticulata (316 ind), Eugenia ibarrae Lundell (202 ind) and Sideroxylon salicifolium (L.) Lamarck (155 ind). This agrees with the data documented in other works for both types of forests (Martínez and Galindo, 2002; Díaz et al., 2002; Lawrence et al., 2004; Vester et al., 2007; Zamora-Crescencio et al., 2012; García-Licona et al., 2014; Chiquini, 2016; Maldonado-Sánchez et al., 2016; Chiquini-Heredia et al., 2017). Among the species identified in the study area are Cryosophila argentea Bartlett and Tabebuia chrysantha (Jacq.) G. Nicholson classified under the category of endangered species in the Official Mexican Norm NOM-059-SEMARNAT-2010 (Semarnat, 2010).
The richness of species in the MSEF consisted of 90 taxa, with a variation between plots of 33 to 55 and a diversity that varied between 2.65 and 2.80, without significant differences between plots (Table 2). These values are above those indicated by Zamora-Crescencio et al. (2012) and García-Licona et al. (2014) for the MSEFs of Calakmul and below those reported for other MSEFs in the state of Campeche (Gutiérrez-Báez et al., 2015).
Table 2 Diversity of species and structural diversity (HS, HD, Hh and Hsdh), richness of species, density and average basal area (BA) in the floodplain forests (FFs) and medium semi-evergreen forests (MSEF) analyzed in Ejido Álvaro Obregón.
| Variable | FF_1 | FF_2 | MSEF_1 | MSEF_2 | MSEF_3 | MSEF_4 |
|---|---|---|---|---|---|---|
| Richness | 65 | 44 | 52 | 33 | 40 | 55 |
| Diversity | 3.06 | 3.02 | 2.7 | 2.79 | 2.65 | 2.80 |
| Evenness | 0.73 | 0.80 | 0.68 | 0.80 | 0.72 | 0.70 |
| Density | 5920 | 8630 | 3940 | 3720 | 4080 | 5170 |
| BA (m) | 30.83 | 34.26 | 25.11 | 37.42 | 31.11 | 22.66 |
| Hs | 1.29 | 1.15 | 1.23 | 1.18 | 1.13 | 1.33 |
| Hd | 0.94 | 0.92 | 0.96 | 0.88 | 0.91 | 0.95 |
| Hh | 0.75 | 0.62 | 0.76 | 0.70 | 0.73 | 0.78 |
| Hsdh | 0.73 | 0.80 | 0.68 | 0.80 | 0.72 | 0.70 |
BA = Basal area, Hs = The Shannon-Wiener index for species, HD = The Shannon-Wiener index by diameter classes, Hh = The Shannon-Wiener index by height classes, Hsdh = Average structural diversity rate.
75 species were registered, with a variation between plots of 44 to 65 and a diversity of 3.02 and 3.06, but without significant differences between MSEF plots (Table 2). The richness and diversity of species in the FFs were higher compared to those reported by Díaz et al. (2002), Tun-Dzul et al. (2008) , Vázquez et al. (2010), Chiquini (2016), Maldonado-Sánchez et al. (2016) and Chiquini-Heredia et al. (2017); this can be associated with the precipitation in the area (García et al., 2002; Martínez and Galindo, 2002) and the topographical features that influence the flooding (Palacio et al., 2002; Cortés-Castelán e Islebe, 2005).
The ANOVA test showed no significant differences in density (ind ha-1) between the FF plots and the MSEF plots (Table 2). However, when the tree density (ind ha-1) in the FFs was compared with that of the MSEFs by means of the Kruskal Wallis test, there was a significant difference (H(X2) = 12.16, p = 0.0077). In the case of the FFs, the values were higher than those mentioned by other authors for the FFs of Calakmul (Díaz et al., 2002; Tun-Dzul et al., 2008; Chiquini, 2016; Chiquini-Heredia et al., 2017), and similar to those indicated for other FFs in southern Mexico (Cortés-Castelán and Islebe, 2005; Maldonado-Sánchez et al., 2016).
When the results were compared with those documented in other papers for MSEFs in Calakmul, the density (ind ha-1) turned out to be similar to that cited by Vester et al. (2007) and higher than that estimated by Zamora-Crescencio et al. (2012) and García-Licona et al. (2014) in Calakmul.
As for the basal area (BA), the Kruskal-Wallis test showed no significant differences between the FF plots, whereas the MSEF_2 plot had a significantly larger BA than MSEF_4 (Table 2). When comparing between types of forests, there was a significant difference (H(X2) = 10.19, p = 0.0204). The studied FFs had a larger BA than that recorded for forests of this type in Calakmul (Díaz et al., 2002; Zamora-Crescencio et al., 2012; Chiquini, 2016; Chiquini-Heredia et al., 2017) and a similar BA to that of other FFs in other regions in southern Mexico (Cortés-Castelán e Islebe, 2005; Maldonado-Sánchez et al., 2016).
The MSEFs exhibited lower values for BA than other forests in Calakmul (Read and Lawrence, 2003; Zamora-Crescencio et al., 2012; García-Licona et al., 2014), due to the impact of the forest management in the past (Martínez and Galindo, 2002; Martínez, 2010).
The species with the highest RIV were Pouteria reticulata, Haematoxylum campechianum L., Manilkara zapota (L.) P. Royen, and Eugenia winzerlingii (Table 3), which agrees with the findings of Díaz et al. (2002), Palaces et al. (2002), Chiniquini (2016) and Chiquini-Heredia et al. (2017) for FFs in central and southern Calakmul. While at the MSEFs, the highest RIVs were: Sideroxylon salicifolium, P. reticulata, M. zapota and Brosimum alicastrum Sw., which have been registered by various authors as dominant and with high RIVs for the MSEFs in Calakmul (Read and Lawrence, 2003; Vester et al., 2007; Zamora-Crescencio et al., 2012; García-Licona et al., 2014).
Table 3 List of the species with the highest RIV in each of the floodplain forests (FFs) and medium semi-evergreen forests (MSEF) analyzed in the Permanent Forest Area of Ejido Álvaro Obregón.

The horizontal structure (DBH distribution), in all plots of both the FFs and MSEFs exhibits a distribution in the form of an inverted "J", with more than 70 % of the individuals in the first two diameter categories; that is to say, between 1 and 7.7 cm (Figure 1). The distribution in the form of an inverted J indicates that these forests maintain natural replacement processes that guarantee the replacement of the trees that have been removed for a variety of reasons (Zamora-Crescencio et al., 2012; García-Licona et al., 2014; Maldonado-Sánchez et al., 2016).
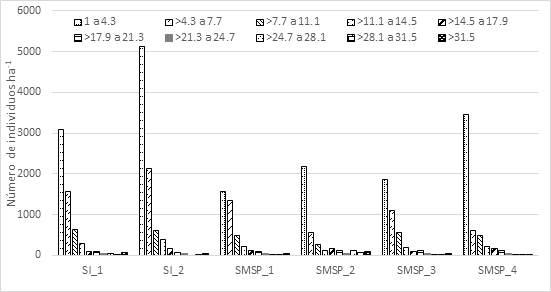
Figure 1 Vertical structure (heights) of the floodplain forests (FFs) and medium semi-evergreen forests (MSEFs) in the Permanent Forest Area of Ejido Álvaro Obregón.
The vertical structure (distribution of heights) exhibited a bell-shaped distribution, in which more than 60 % of the individuals were included in the categories 2 to 4, (3.3 and 9.6 m) (Figure 2). A similar pattern was followed by the plots of the MSEFs, except in the case of the MSEF_6, in which the first category included approximately 40 % of the individuals. These results agree with those documented by Díaz et al. (2002), Zamora-Crescencio et al. (2011), García-Licona et al. (2014), Chiquini (2016) and Chiquini-Heredia et al., (2017), who point out that the pattern in question shows the recovery of the vegetation through the successional process.

Figure 2 Horizontal structure (DAP) of the floodplain forests (FFs) and medium semi-evergreen forests (MSEFs) analyzed in the Permanent Forest Area of Ejido Álvaro Obregón.
When the structural diversity indices Hs, Hd, Hh and Hsdh were compared between the studied plots of both the FFs and the MSEFs (Table 2), significant differences were found between the Shannon-Wiener indices for the species (Hs). FFs registered a significantly greater diversity at FF_1 than at FF_2 (Hutchenson’s t= 4.23, p= 0.001). In the case of the MSEF plots, the Hs of MSEF_4 was calculated and found to be significantly higher than the estimates for MSEF_1 (Hutchenson’s t= 3.14, p= 0.001), MSEF_2 (Hutchenson’s t= 4.40, p= 0.001) and MSEF_3 (Hutchenson’s t= 6.13, p= 0.001). There were no significant differences in the Hh (diversity index by height classes) between the FFs and the MSEFs; whereas, for the HD (diversity index by diameter classes) there were significant differences only between the plots MSEF_2 and MSEF_3 (Hutchenson’s t= 1.72, p= 0.05). In the case of the Hsdh (average structural diversity index), the highest value was estimated for MSEF_6 and for FF_1.
When we compare the results between types of forest, we find that MSEF_4 has a significantly higher value for diversity of species (Hs) than FF_2 (Hutchenson’s t= 5.48, p= 0.001); however, FF_2 has a significantly lower value for diversity by height classes (Hh) than MSEF_1 (Hutchenson’s t= 1.67, p= 0.001) and MSEF_4 (Hutchenson’s t= 2.01, p= 0.001).
The structural diversity estimated for the MSEFs was lower than indicated by Martínez-Sánchez (2016) for the same type of forests in Tabasco; for the FFs, the values were similar to those cited by Chiquini-Heredia et al. (2017).
Estimation of biomass and stored carbon
The biomass estimates for the FFs were 94.85 t ha-1 for FF_1 and 77.53 t ha-1 in FF_2; in the MSEFs, they ranged between 72.70 and 35.31 t ha-1 (Table 4). The calculation of the carbon content in the aboveground biomass in the FFs was of 44.58 and 36.44 mg C ha-1, while in the MSEFs it varied between 34.17 and 16.60 Mg C ha-1 (Table 4). At the FFs, the species with the highest values for biomass and, therefore, for carbon were H. campechianum, M. zapota, Canella winterana (L.) Gaertn. and Metopium brownei (Jacq.) urb. At the MSEFs, they were M. zapota, M. brownei and S. salicifolium; at the FFs and the MSEFs (except in the case of the MSEF_3) the species and values are similar to those indicated by other authors for secondary vegetation derived from forests with 20 - 25 years of recovery in the Region of Calakmul (Lawrence and Foster, 2003; Eaton and Lawrence, 2008; Aryal et al., 2014) as well as for other areas (Urquiza-Haas, et al., 2007; Berenguer et al., 2014).
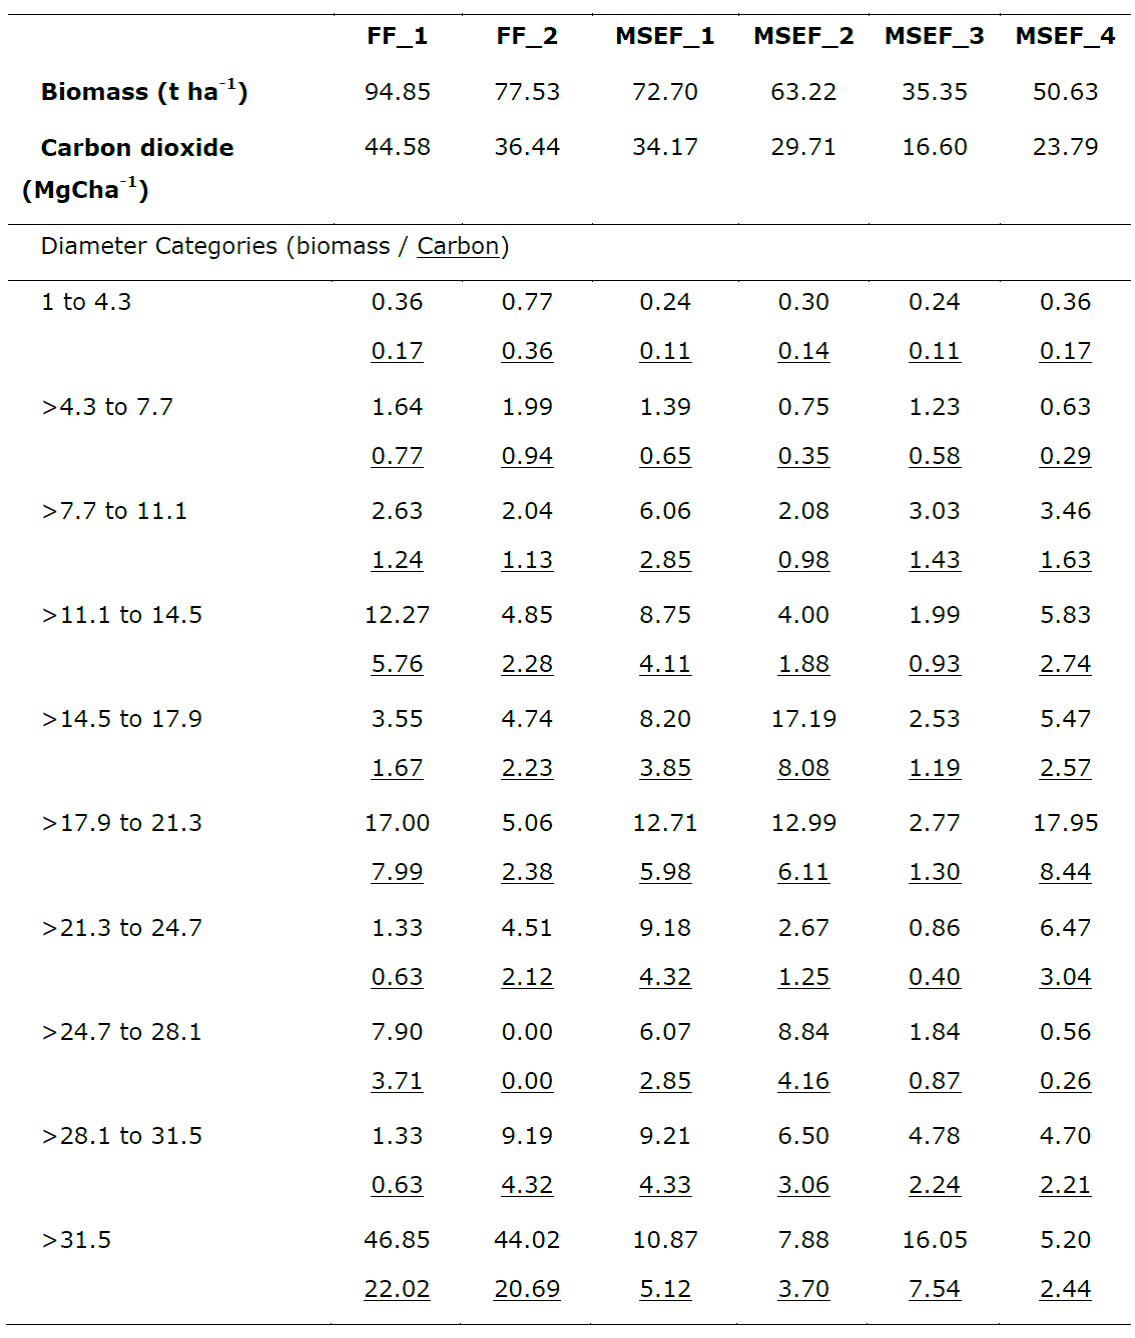
Table 4 Average accumulated biomass and carbon by categories in the floodplain forests (FFs) and medium semi-evergreen forests (MSEFs) analyzed in the Permanent Forest Area of Ejido Álvaro Obregón.
The biomass and carbon accumulated at the MSEF_3 coincide with those registered for the secondary vegetation derived from forests in early phases of the succession (10 years of recovery) in Calakmul (Lawrence and Foster, 2003; Eaton and Lawrence, 2008; Aryal et al., 2014). These results probably relate to the long period during which wood was extracted in the PFA, and show the manner in which they have been recovered since their exploitation ceased (Eaton and Lawrence, 2008; Berenguer et al. 2014).
In relation to the estimation of biomass and carbon by diameter categories, it was noted that if the largest amount of biomass and therefore of carbon dioxide is concentrated in the last category (>31.5 cm diameter) with percentages close to 50 % of the total accumulated carbon of the sampled plots (FF_1= 49.39 % and FF_2= 56.78 %). Whereas the MSEFs have the highest percentages of the accumulated carbon in the intermediate categories, with a DBH between 11.1 and 21.3 cm, in three of the plots (MSEF_1= 40.80 %, MSEF_2= 54.09 % and MSEF_4= 57.78 %), and only the MSEF_3 is in the last diameter category (45.45 %). These values are similar to those cited by other authors (Santamaria, 2014; Berenguer et al., 2014), who point out that the highest amount of carbon occurs in individuals of intermediate (10 to 20 cm) and higher (more than 20 cm) diameter categories.
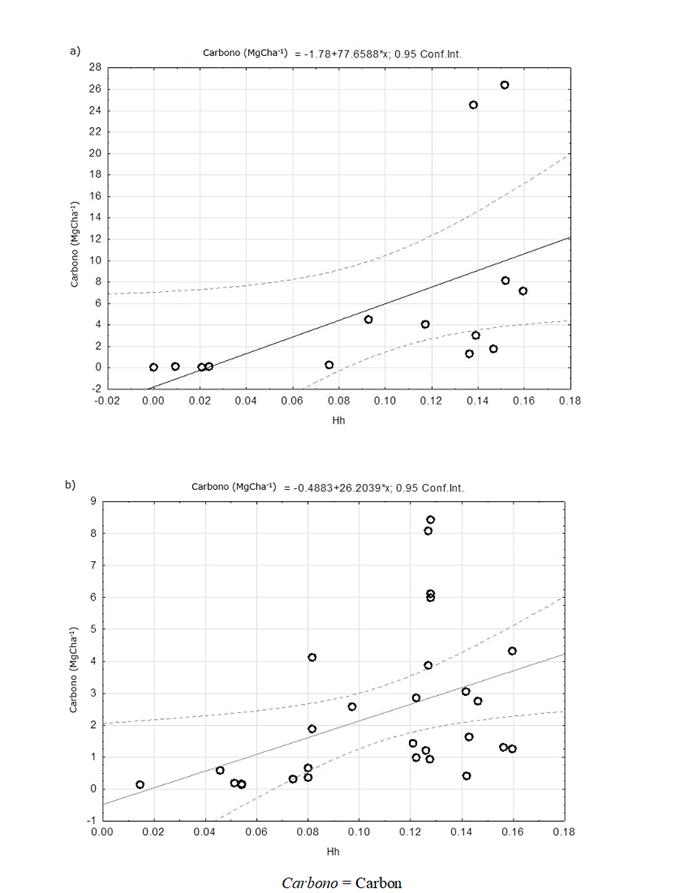
By observing the relationship between the structural diversity (Hd and Hh) and the amount of carbon stored in each plot (figures 3a, 3b, 4a and 4b), it was noted that in both the FFs and the MSEFs there was a positive and significant correlation between the Hd and carbon stored and HH and the stored carbon. These results agree with the findings of Wang et al. (2011), who point out that there is a positive relationship between the structural diversity rates and the carbon reservoirs, i.e. the carbon storage increases with higher diversity rates.
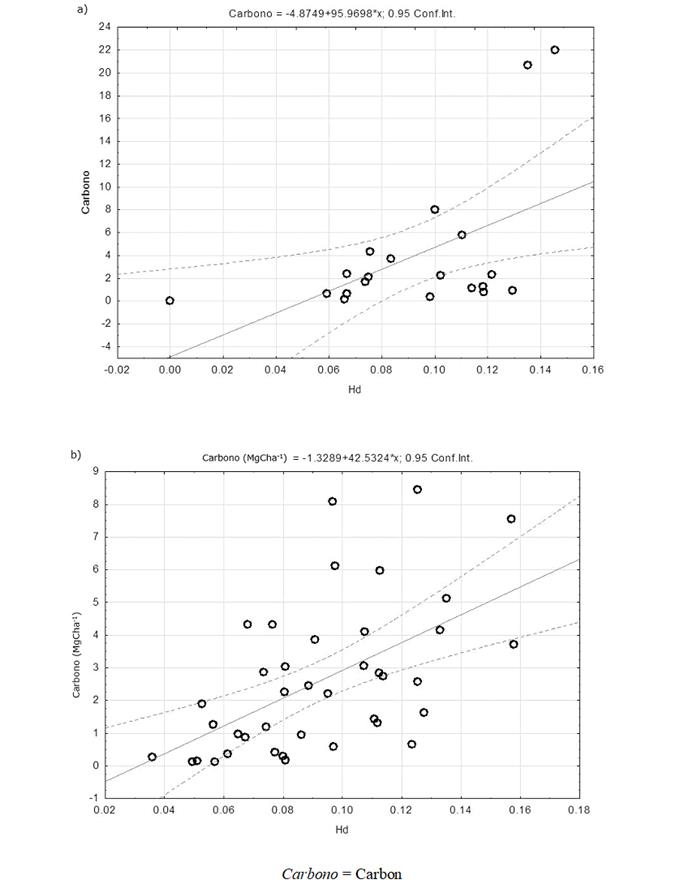
Figure 3 Relationship between the stored carbon and the structural diversity (diversity index by diameter classes) in the floodplain forests (FFs - 3a) and in the medium semi-evergreen forests (MSEFs - 3b) analyzed in the Permanent Forest Area of Ejido Álvaro Obregón.
Conclusions
The diversity of the Permanent Forest Area of Ejido Álvaro Obregón allows us to conclude that both the MSEFs and the FFs exhibit a good conservation status, with appropriate plant regeneration processes for this type of forests. The characteristics of richness of species, abundance, basal area, biomass and carbon show that the MSEFs are those with the greatest impact in relation to the exploitation. Both the FFs and the MSEFs maintain good structural conditions, composition and carbon content, which are similar to those of the old secondary vegetation (aged 25 to 30 years), i.e. they are in recovery after the period of exploitation to which they were subjected.
Acknowledgments
The authors wish to thank the inhabitants of Ejido Álvaro Obregón for the facilities provided for the realization of this study. Thanks to Manuel Arana Cua and Demetrio Álvarez Montejo for their support in the field and in the identification of species. The study was carried out with resources from the Adaptive Monitoring Project of the Calakmul Biosphere Reserve (Strategic Innovation Projects - FMCN) and El Colegio de la Frontera Sur (ECOSUR).
REFERENCES
Aryal D. R., B. H. J. de Jong, S. Ochoa-Gaona, L. Esparza-Olguín and J. Mendoza-Vega. 2014. Carbon stocks and changes in tropical secondary forests of southern Mexico. Agriculture, Ecosystems and Environment 195:220-230. [ Links ]
Aryal D.R., B. H. J. de Jong, J. Mendoza-Vega, S. Ochoa-Gaona and L. Esparza-Olguín. 2017. Soil organic carbon stocks and soil respiration in tropical secondary forests in Southern Mexico. In: Damien, D. J., C. Field, L. S. Morgan and A. B. McBratney. (eds.). Global Soil Security. Springer. Cham, Switzerland. pp. 153-165. [ Links ]
Berenguer E., J. Ferreira, T. A. Gardner, L. E. Oliveira C. A., P. Barbosa C., C. E. Cerri, M. Durigan, R. C. de Oliveira Jr., I. C. Guimarães V. and J. Barlow. 2014. A large-scale field assessment of carbon stocks in human-modified tropical forest. Global Change Biology 20:3713-3726. [ Links ]
Cairns M. A., I. Olmsted, J. Granados and J. Argaez. 2003. Composition and aboveground tree biomass of a dry semi-evergreen forest on Mexico´s Yucatan Peninsula. Forest Ecology and Management 186(1-3):125-132. [ Links ]
Carnevali F.-C., G., J. L. Tapia-Muñoz, R. Duno S. y I. Ramírez M. (eds). 2010. Flora Ilustrada de la Península de Yucatán: Listado Florístico. Centro de Investigación Científica de Yucatán, A.C. Mérida, Yuc., México. 328 p. [ Links ]
Cortés-Castelán, J. C. y G. A. Islebe. 2005. Influencia de factores ambientales en la distribución de especies arbóreas en las selvas del sureste de México. Revista de Biología Tropical 53:115-133. [ Links ]
Chave, J., C., Andalo, S. Brown, M. A. Cairns, J. Q. Chambers, D. Eamus, H. Fölster, F. Fromard, N. Higuchi, T. Kira, J.-P. Lescure, B. W. Nelson, H. Ogawa, H. Puig, B. Riéra and T. Yamakura. 2005. Tree allometry and improved estimation of carbon stocks and balance in tropical forest. Oecologia 145:87-99. [ Links ]
Chave, J., H. C. Muller-Landau, T. R. Baker, T. A. Easdale, H. ter Steege and C. O. Webb. 2006. Regional and phylogenetic variation of wood density across 2456 Neotropical tree species. Ecological Applications 16(6):2356-2367. [ Links ]
Chiquini H., W. A. 2016. Diversidad florística de la selva inundable de Calakmul. Tesis de Maestría. El Colegio de la Frontera Sur, Unidad Campeche. Lerma Campeche, Camp., México. 60 p. [ Links ]
Chiquini-Heredia, W. A., L. Esparza-Olguín, Y. Peña-Ramírez, A. Maya-Martínez y E. Martínez-Romero. 2017. Estructura y diversidad en selva inundable al centro y sur de Calakmul. Ecosistemas y Recursos Agropecuarios 4(12):511-524. [ Links ]
Díaz G., J. R., O. Castillo A. y G. García G. 2002. Distribución espacial y estructura arbórea de la selva baja subperennifolia en un ejido de la Reserva de la Biosfera de Calakmul, Campeche, México. Universidad y Ciencia 18(35):11-28. [ Links ]
Eaton, J. M. and D. Lawrence. 2008. Loss of carbon sequestration potential after several decades of shifting cultivation in the Southern Yucatán. Forest Ecology and Management 258(6):949-958. [ Links ]
Fonseca, W., J. M. Rey B. and F. E. Alice. 2011. Carbon accumulation in the biomass and soil of different aged secondary forests in the humid tropics of Costa Rica. Forest Ecology and Management 262(8):1400-1408. [ Links ]
García G., G. y J. M. Pat F. 2000. Apropiación del espacio y colonización en la Reserva de la Biosfera de Calakmul, Campeche, México. Revista Mexicana del Caribe 5(10):212-231. [ Links ]
García G., G, J. L. Palacio P. y M. A. Ortiz P. 2002. Reconocimiento geomorfológico e hidrográfico de la Reserva de la Biosfera Calakmul, México. Investigaciones Geográficas 48:7-23. [ Links ]
García-Licona J. B., L. Esparza-Olguín y E. Martínez-Romero. 2014. Estructura y composición de la vegetación leñosa de selvas en diferentes estadios sucesionales en el ejido El Carmen II, Calakmul, México. Polibotánica 38(1):1-26. [ Links ]
Gutiérrez-Báez C., P. Zamora-Crescencio y G. G. Cabrera-Mis. 2015. Estructura y composición florística de la selva mediana subperennifolia El Remate, Calkiní, Campeche, México. Foresta Veracruzana 18(2):1-12. [ Links ]
Herrera-Gloria, J. M. 2007. Estudio de Impacto Ambiental. Aprovechamiento Forestal en Selvas Tropicales, ejido Álvaro Obregón. http://sinat.semarnat.gob.mx/dgiraDocs/documentos/camp/estudios/2007/04CA2007FD033.pdf (10 de febrero de 2009). [ Links ]
Hughes, R. F., J. B. Kauffman and V. J. Jaramillo. 1999. Biomass, carbon, and nutrient dynamics of secondary forests in humid tropical region of México. Ecology 80(6):1892-1907. [ Links ]
Hutcheson, K. 1970. A test for comparing diversities based on the Shannon formula. Journal of Theoretical Biology 29(1):151-154. [ Links ]
Lawrence, D. and D. R. Foster. 2003. Chapter 5. Recovery of nutrient cycling and ecosystem properties following swidden cultivation: regional and stand-level constraints. In: Turner II, B. L., J. Geoghegan, D. R. Foster (eds.). Integrated Land-Change Science and Tropical Deforestation in Southern Yucatán. Final Frontiers, Oxford University Press. New York, NY, USA. pp. 81-104. [ Links ]
Lawrence, D. , H. F. M. Vester, D. Pérez-Salicrup, J. R. Eastman, B. L. Turner II and J. Geoghegan. 2004. Integrated analysis of ecosystem interactions with land-use change: The Southern Yucatán peninsular region. In: Defries, R. S., G. P. Asner and R. A. Houghton (eds.). Ecosystems and land use change. American Geophysical Union. Washington DC, USA. pp. 277-292 p. [ Links ]
Lei, X., W. Wang and C. Peng. 2009. Relations hips between stand growth and structural diversity in spruce-dominated forest in New Brunswick, Canada. Canadian Journal of Forest Research 39(10):1835-1847. [ Links ]
Magurran, A. E. 2004. Measuring biological diversity. Blackwell Publishing. Oxford, England. 264 p. [ Links ]
Maldonado-Sánchez, E. A., S. Ochoa-Gaona, R. Ramos-Reyes, M. A. Guadarrama-Olivera, N. González-Valdivia y B. H. J. de Jong. 2016. La selva inundable de canacoite en Tabasco, México, una comunidad vegetal amenazada. Acta Botánica Mexicana 115: 75-101. [ Links ]
Márdero, S., E. Nickl, B. Schmook, L. Schneider, J. Rogan, Z. Christman y D. Lawrence. 2012. Sequías en el sur de la península de Yucatán: análisis de la variabilidad anual y estacional de la precipitación. Investigaciones Geográficas 78:19-33. [ Links ]
Martínez, E., M. Sousa S. y C. H. Ramos Á. 2001. Listados Florísticos de México, XXII. Región de Calakmul, Campeche. Instituto de Biología, Universidad Nacional Autónoma de México. México, D.F., México. 57 p. [ Links ]
Martínez, E. y C. Galindo L. 2002. La vegetación de Calakmul, Campeche, México: Clasificación, descripción y distribución. Boletín de la Sociedad Botánica de México 71:7-32. [ Links ]
Martínez R., E. 2010. Factores de impacto directos e indirectos que determinaron el proceso complejo de la deforestación a nivel ejidal, en la región de Calakmul, Campeche, durante el período 1976-2008. Tesis de doctorado. Facultad Latinoamericana de Ciencias Sociales (FLACSO). Sede Académica México. México, D.F., México. 296 p. [ Links ]
Martínez-Sánchez, J. L. 2016. Comparación de la diversidad estructural de una selva alta perennifolia y una mediana subperennifolia en Tabasco, México. Madera y Bosques 22(2):29-40. [ Links ]
Palacio A., A. G., R. Noriega T. y P. Zamora C. 2002. Caracterización físico-geográfica del paisaje conocido como “bajos inundables”. El caso del Área Natural Protegida Balamkín, Campeche. Investigaciones Geográficas 49:57-73. [ Links ]
Read, L. and D. Lawrence. 2003. Recovery of biomass following shifting cultivation in dry tropical forests of the Yucatan. Ecological Applications 13(1):85-97. [ Links ]
Santamaria R., S. L. 2014. Aboveground biomass and carbon stock of a medium stature semi-evergreen tropical forest in the Intensive Carbon Monitoring Site of Calakmul-Campeche, Mexico. Thesis of Master of Science. Technische Universität Dresden. The Faculty of Environmental Science, Institute of International Forestry and Forest Products. Dresden, Germany. 47 p. [ Links ]
Secretaría de Medio Ambiente y Recursos Naturales (Semarnat). 2010. Norma Oficial Mexicana NOM-059-SEMARNAT-2010. 2010. Protección ambiental-especies nativas de México de flora y fauna silvestres-categorías de riesgo y especificaciones para su inclusión, exclusión o cambio-lista de especies en riesgo. Diario Oficial de la Federación. México, D.F., México. 78 p. [ Links ]
The Plant List. 2013. The Plant List. http://www.theplantlist.org/ (20 de junio de 2017). [ Links ]
Tropicos. 2013. Missouri Botanical Garden. htpp://www.tropicos.org/ (20 de junio de 2017). [ Links ]
Tun-Dzul, F. J., H. Vester, R. Durán G. and B. Schmook. 2008. Estructura arbórea y variabilidad temporal de los “bajos inundables” de la Península de Yucatán, México. Polibotánica 25:69-90. [ Links ]
Urquiza-Haas, T., P. M. Dolman and C. A. Peres. 2007. Regional scale variation in forest structure and biomass in the Yucatan Peninsula, Mexico: Effects of forest disturbance. Forest Ecology and Management 247(1-3): 80-90. [ Links ]
Vázquez N., I., D. López P., H. E. Montalvo U., C. A. Méndez S. y O. Castillo A. 2010. Estructura y composición florística de vegetación inundable en la División Académica de Ciencias Biológicas, Villahermosa, Tabasco. Kuxulkab´ Revista de Divulgación 17(31):21-30. [ Links ]
Vester, H. F., D. Lawrence, J. R. Eastman, B. L. Turner II, S. Calmé, R. Dickson, C. Pozo and F. Sangermano. 2007. Land change in the southern Yucatán and Calakmul biosphere reserve: effects on habitat and biodiversity. Ecological Applications 17(4):989-1003. [ Links ]
Wang, W., X. Lei, Z. Ma, D. D. Kneeshaw and C. Peng. 2011. Positive relationship between aboveground carbon stocks and structural diversity in spruce-dominated forest stands in New Brunswick, Canada. Forest Science 57(6):506-515. [ Links ]
Zamora-Crescencio, P., M. R. Domínguez-Carrasco, P. Villegas, C. Gutiérrez-Báez, L. A. Manzanero-Acevedo, J. J. Ortega-Hass, S. Hernández-Mundo, E. C. Puc-Garrido y R. Puch-Chávez. 2011. Composición florística y estructura de la vegetación secundaria en el norte del estado de Campeche, México. Boletín de la Sociedad Botánica de México 89:27-35. [ Links ]
Zamora-Crescencio, P. , C. Gutiérrez-Báez, W. J. Folan, M. R. Domínguez-Carrasco, P. Villegas, G. Cabrera-Mis, C. M. Castro-Angulo y J. C. Carballo. 2012. La vegetación leñosa del sitio arqueológico de Oxpemul, municipio de Calakmul, Campeche, México. Polibotánica 33: 131-150. [ Links ]
Zanne, A. E., G. López-González, D. A. Coomes, J. Ilic, S. Jansen, S. L. Lewis, J. Chave. 2009. Global Wood Density Database. Dryad Identififier. htpp:/hdl.handle.net/1025/dryad.235 (12 de julio de 2017). [ Links ]
Received: August 02, 2017; Accepted: November 13, 2017
 Este es un artículo publicado en acceso abierto bajo una licencia Creative Commons
