


Services on Demand
Journal
Article
 text in
  English (pdf)
 Article in xml format
 Article references
 Send this article by e-mail
Indicators
-
 Cited by SciELO
 -
 Access statistics
Related links
-
 Similars in
SciELO
Similars in
SciELO
Share

 Permalink
Revista mexicana de ciencias forestales
Print version ISSN 2007-1132
Rev. mex. de cienc. forestales vol.9 n.45 México Jan./Feb. 2018
https://doi.org/10.29298/rmcf.v9i45.142
Articles
Tree diversity and structure in an Abies vejarii Martínez at the south of Nuevo León state
1Facultad de Ciencias Forestales, Universidad de Nuevo León. México.
2Facultad de Ciencias Agrarias, Departamento de Ciencias Forestales, Universidad Nacional de Colombia-Sede Medellín. Colombia.
3Campo Experimental Uruapan. CIR-Pacífico Centro. INIFAP. México.
To evaluate species diversity and tree density in natural forests of Abies vejarii in south Nuevo León, a directed sampling was applied in four Permanent Forest Research Sites of 2 500 m2, at 100 m high between each community. Tree diameter information was recorded for normal diameters greater than 7.5 cm. Species composition, diversity, density of individuals, basal area and dominance by species between altitudinal gradient were determined. A statistical analysis was performed with the hypothesis of equality of medians with Kruskal-Wallis nonparametric test; the effect of distance at altitude was evaluated by means of species rarefaction curves and tablecloth tests. It was a total of 553 individuals of 7 families, 10 genera and 15 species. Pinaceae and Fagaceae reached the highest importance value index; the first contributed with most species. The average forest density was 523 ha-1 individuals with an average basimetric area of 30.44 m2ha-1. The Shannon-Weiner index (H ') varied from 1.47 to 1.76. The mantel test did not recognize significant differences in the distance between the communities (p> 0.05); the Kruskal-Wallis test and the rarefaction curves revealed that the richness of species varied significantly (p <0.05). The most frequent diameters are less than 40 cm. It is concluded that the greatest diversity of species occurred in the lower elevation community and the structure corresponds to that of an irregular mature forest without management.
Key words: Abies vejarii Martínez; rarefaction curves; altitudinal gradient; diversity indexes; Kruskal-Wallis test; tablecloth test
Para evaluar la diversidad de especies y la densidad arbórea en bosques naturales de Abies vejarii en el sur de Nuevo León, se aplicó un muestreo dirigido en cuatro Sitios Permanentes de Investigación Forestal de 2 500 m2, a 100 m de altitud entre cada comunidad. Se registró información dasométrica del arbolado para diámetros normales mayores a 7.5 cm. Se determinó la composición de especies, la diversidad, la densidad de individuos, el área basal y la dominancia por especie entre gradiente altitudinal. Se realizó un análisis estadístico con la hipótesis de igualdad de medianas mediante la prueba no paramétrica de Kruskal-Wallis; se evaluó el efecto de la distancia en altitud a partir de las curvas de rarefacción de especies y pruebas de mantel. Resultó un total de 553 individuos de siete familias, 10 géneros y 15 especies. Pinaceae y Fagaceae alcanzaron el mayor índice de valor de importancia; la primera aportó la mayoría de los taxa. La densidad forestal promedio fue de 523 individuos ha-1, con un área basal promedio de 30.44 m2ha-1. El índice de Shannon-Weiner (H') varió de 1.47 a 1.76. La prueba de mantel no reconoció diferencias significativas en la distancia entre las comunidades (p>0.05); la prueba de Kruskal-Wallis y las curvas de rarefacción revelaron que la riqueza de especies varió significativamente (p<0.05). Los diámetros más frecuentes son menores a 40 cm. Se concluye que la mayor diversidad se presentó en la comunidad de menor altitud y la estructura corresponde a la de un bosque maduro irregular sin manejo.
Palabras clave: Abies vejarii Martínez; curvas de rarefacción; gradiente altitudinal; índices de diversidad; prueba de Kruskal-Wallis; prueba de mantel
Introduction
From 47 to 52 Abies (fir) species have been recorded in the world, all of them in the northern hemisphere; they form pure or mixed masses associated to Pinus spp. and Quercus spp. (Xiang et al., 2007; Granados et al., 2007; Farjon and Filler, 2013). In Mexico, the genus comprises ten species (Martínez-Méndez et al., 2016), which cover around 144 thousand hectares (FAO, 2010a); its greatest concentration occurs at the center of the country (Rzedowski, 1978; Sánchez et al., 2006).
The conservation of these ecosystems is important; however, the geographical extension of the Abies populations is currently being reduced due to ecological, social, economic and climate change problems (Alvarado et al., 1991, Fagre and Peterson, 2002; Saavedra et al., 2003; Encina et al., 2008). Several species of the genus are in some risk category, such as Abies vejarii Martínez, which is one of the six endemic species of Mexico (Semarnat, 2010; Gernandt and Pérez-de la Rosa, 2014; Martínez-Méndez et al., 2016).
This species grows in very specific areas of the Sierra Madre Oriental of the states of Coahuila, Nuevo León and Tamaulipas with small populations (Farjon, 2013). For this reason, it is considered of great scientific interest to know the population dynamics of these relict masses through the diversity and arboreal structure of their communities.
The main elements that determine the composition, diversity and structure of plant communities depend on the size of the area (Aguirre, 2002; Condit et al., 2002). The population dynamics of the species in forest ecosystems is considered as an indicator of the succession of vegetation, and of the climatic changes in the ecotone of the ecosystems (Camarero and Gutiérrez, 2004). Disturbances such as landslides, overgrazing and fire promote changes in the composition and diversity of species that vary according to altitude (Stephenson and Mantgem, 2005; Cuyckens et al., 2015).
The altitudinal gradients in particular are closely associated to environmental modifications, which imply in turn, a change in biodiversity (Meraz et al., 2017); in addition, elevation is an important factor that directly conditions environmental variables and, indirectly, population variables such as growth and mortality (Homeier et al., 2010; Girardin et al., 2010, Blundo et al., 2012, Anderson et al., 2013).
The change of index values within and between communities provides information on interspecific competition on the structure of a stand (Castellanos et al., 2010). Therefore, the objective of this work was to describe the composition of the community, the diversity of species and the structure of the population of trees in four forest ecosystems with the presence of Abies vejarii along an altitudinal gradient, in the south of Nuevo León, Mexico.
Materials and Methods
Study area
Forest stands were selected with the presence of Abies vejarii in the La Encantada ejido of the General Zaragoza municipality of Nuevo León, Mexico, which is located at the coordinate of 23°54'18.36'' north and 99°47'44.04'' west, in an altitudinal range of 2 400 to 2 700 m. The data was obtained from four sites named by the location (Figure 1).

According to the national information system of weather stations and the WorldClim, the average annual temperature ranged between 12.6 °C and 14.8 °C, with an average annual rainfall of 800 mm (Conagua, 2010; Fick and Hijmans, 2017). The surface of the terrain is rugged with steep slopes. The climate in the area is of the C (E) (w2) type, subhumid semicold with summer rains (Inegi, 2010). The natural vegetation corresponds to a coniferous forest destined to the provision and improvement of forest environmental services.
Methodology
A directed sampling design was implemented, in which the strata were stands in different conditions of natural development, determined by their altitude (Figure 2). The sampling covered an area of 10 000 m2 (1 ha-1), resulting from the survey of four sites, each with an area of 2 500 m2 (50 m × 50 m), where the. methodology recommended by Corral et al. (2009) was applied. Information was recorded for tree species larger than 7.5 cm in diameter; the variables quantified were: species, number of trees, the normal diameter (DN1.30), total height (ht) and crown diameter (north-south and east-west), as well as the distances from the central tree to each of the trees within the site. The diameter was measured with a Haglöf tree caliper of 80 cm and a Forestry Suppliers diametric tape of 5 m; for the height a Vertex Forestor Haglöf hypsometer was used; while a 30 m Lufkin longimeter was used for the crown diameters. A botanical collection of all associated plant species was made for later identification.

Data analysis
The database elaborated with the record of the individuals in the sampling sites was quantitatively analyzed to obtain the relative density, relative frequency and relative dominance to calculate the Importance Value Index (IVI) of the arboreal species, which is obtained from the sum of the three variables (Curtis and McIntosh, 1950; Mueller-Dombois and Ellemberg, 1974; Mostacedo and Fredericksen, 2000; Treviño et al., 2001).
The diversity of tree species was determined through the Shannon diversity index for each community (Shannon and Weaver, 1949), which is an algorithm that describes this component as distance-independent and reflects the heterogeneity of a community over the basis of two factors: the number of species present and their relative abundance (Castellanos et al., 2008). (equation 1):
 (1)
(1)
Where:
Pi = ni/N = Rate of individuals found in the ith species
ni = Number of individuals of the i species
N = Total number of individuals of all species of that kind of vegetation in the forest
ln = Natural logarithm
The dominance of species was calculated using the Simpson index (1949), a weighted diversity index towards the most abundant species in the sample; when the index increases, diversity decreases and is generally expressed from 0 to 1 (equation 2):
 (2)
(2)
Where:
Pi = Shannon’s information function
The equity index refers to the degree of relative dominance of each species in each site, which quantifies equality as the proportion of diversity observed in relation to the maximum expected diversity whose values vary between 0 and 1, the higher the index, greater equality of the species. It is calculated according to Pielou (1966) with the following mathematical expression (3):
 (3)
(3)
Where:
H´ = Shannon index
S = Number of species
The richness of species within each community was determined by Margalef’s index (Margalef, 1968 ) through equation (4):
 (4)
(4)
Where:
S = Number of species
N = Number of individuals
The analysis of the structural composition was considered the comparison of the distribution of the diametric categories and to determine if there are significant differences in the diversity and in the tree structure between the four altitudinal gradients, the non-parametric Kruskal-Wallis test was used (equation 5) (Kruskal and Wallis, 1952), with the null hypothesis of equality of medians and with a level of significance of 95 %. This is because, previously, the data were subjected to Kolmogorov-Smirnov (K-S) normality tests, which did not present a normal distribution.
 (5)
(5)
Where:
N = Total number of elements
R i = Average interval of the i group
n i = Number of elements of the i group
The effect of the abundance of individuals on the number of species between the altitudes was evaluated, for which rarefaction curves were constructed for each altitude of the forest, according to the number of species and the number of individuals sampled (Colwell, 2000; Colwell et al., 2012; Oksanen et al., 2017); this made it possible to compare the species richness between elevations. In addition, the Sørensen index was applied among the sites in order to know the percentage of shared species (Chao et al., 2005).
Finally, from the geographic coordinates and the altitude, the beta diversity was evaluated by the relationship of the geographical distance between the sampling sites of each altitude based on tablecloth tests with the statistical package of vegan in R (Rosenberg and Anderson, 2011). To compare the spatial structure, a distance matrix was elaborated in the four sites based on the floristic composition of each one, with its X and Y coordinates. All procedures for diversity were carried out using the R Project statistical package (R Core Team, 2017).
Results and Discussion
In the four parcels of 2 500 m2ha-1 an average of 523 trees of 15 species, 10 genera and 7 families were recorded. Of these, 6 families comprising 9 genera, 11 species and 154 individuals, were registered in El Bosque; 4 families representing 6 genera, 7 species and 105 individuals were consigned in El Rosal; 6 species belonging to 5 genera, 3 families and 97 trees in the La Tinaja plot; and the Las Antenas site gathered 167 individuals belonging to 6 species, 4 genera and 3 families (Table 1).
Table 1 Floristic richness, number of trees and diversity indexes for the four sites of southern Nuevo León.
| Variable | Sites | |||
|---|---|---|---|---|
| El Bosque | El Rosal | La Tinaja | Las Antenas | |
| Number of species | 11 | 7 | 6 | 6 |
| Number de genera | 9 | 6 | 5 | 4 |
| Number of families | 7 | 4 | 3 | 3 |
| Density (ind. ha-1) | 616 | 420 | 388 | 668 |
| Basimetric area (m2 ha-1) | 27.78 | 48.62 | 23.99 | 21.38 |
| Shannon | 1.76 | 1.47 | 1.69 | 1.6 |
| Simpson | 0.79 | 0.73 | 0.8 | 0.79 |
| Equity | 0.73 | 0.75 | 0.94 | 0.89 |
| Margalef | 1.98 | 1.28 | 1.09 | 0.97 |
| Altitude | 2 386 | 2 500 | 2 593 | 2 686 |
| Exposure | North | North | North | North |
| Latitude | 23°53´24.9” N | 23°55'07.6" N | 23°53´22.6” N | 23°54'49.4" N |
| Longitude | 99°46´26.3” O | 99°48'17.8" O | 99°47´31.5” O | 99°47'54.8" O |
The number of tree species in this study was similar to that from several authors in temperate forests with Abies, which ranged from 5 to 13 (Encina et al., 2008; García et al., 2012; Ávila et al., 2012; Guerrero et al., 2014). Diversity was influenced by the structure of the forest and the composition of species (FAO, 2010b).
In general, there were seven tree families in the study area taxonomically well-represented. Pinaceae has the maximum number of species (6), followed by Fagaceae (4); Cupressaceae, Ericaceae, Rutaceae, Taxaceae and Ulmaceae had only one species. On the basis of density, Pinaceae contributed with 56.5 %, followed by Fagaceae (27.3 %), Cupressaceae (7.2 %), Taxaceae (5.16 %), and Ericaceae 3.25 %. For the Importance Value Index, Pinaceae contributed with 54.8 % followed by Fagaceae (25.33 %), Cupressaceae (8.35 %), Taxaceae (5.54 %) and Ericaceae with 3.76 % (Table 2). In addition to this, Valdez et al. (2003) described a locality in Nuevo León at 2 100 masl, where there is an association made up by Picea martinezii T. F. Patt, Cornus florida L., Ilex rubra S. Wats, Quercus greggii (A. DC.) Trel., Abies durangensis var. coahuilensis (I. M. Johnst.) Martínez, Carya ovata (Mill.) K. Koch and Taxus globosa Schltdl.
Table 2 Families of greater relevance based on the Importance Value Index (IVI) and the number of species, genera and trees.
| Number | Family | Number of species | Number of genera | Number of trees | IVI % |
|---|---|---|---|---|---|
| 1 | Pinaceae | 6 | 4 | 296 | 54.8 |
| 2 | Fagaceae | 4 | 1 | 143 | 25.33 |
| 3 | Cupressaceae | 1 | 1 | 38 | 8.35 |
| 4 | Taxaceae | 1 | 1 | 27 | 5.54 |
| 5 | Ericaceae | 1 | 1 | 17 | 3.76 |
| 6 | Rutaceae | 1 | 1 | 1 | 1.12 |
| 7 | Ulmaceae | 1 | 1 | 1 | 1.1 |
| Total | 15 | 10 | 523 | 100 |
The diversity indexes are calculated mainly to compare the diversity and abundance of species in different habitats on a similar scale and the higher the value, the greater the species richness. The diversity analysis of tree species shows that the location with the lowest altitude El Bosque showed the highest diversity considering the Shannon index (H ') (1.76), as well as the highest Margalef index with 1.98 and the lowest value of equity (Simpson's index) with 0.73.
In this sense, in forests similar to the study area, García et al. (2012) found that the Shannon diversity index was 1.82 and 2.0, corresponding to the maximum diversity of the Sierra Madre Oriental of the state of Nuevo León; whereas, Martínez (2014) carried out a study on plant succession of a forest of Abies guatemalensis Rehder in western Guatemala, and obtained results in richness of species from 3.67 to 3.95. This variation can be attributed to the availability of light, management practices, competition from other plants and grazing activities (Alexander et al., 2006).
The analysis of the floristic structure shows that in the lowest locality the dominant species is Abies vejarii (IVI = 29.42), with two codominant species, Quercus affinis Scheidw (18.53) and Quercus mexicana Bonpl. (17.23) to form a forest of Abies - Quercus. In the 2 500 m, the forest changes its structure to have two dominant species, Abies vejarii (29.47) in the high stratum and Cupressus sp. (31.46) in the middle stratum. When climbing the floor of 2 593 m in altitude, the dominant trees are Quercus affinis (24.07) and Picea martinezii (22.59), and Abies vejarii (16.91) is codominant. At the highest altitude site, Quercus affinis (24.74) is dominant and Pinus ayacahuite Ehrenb. et Schltdl. (20.91) and Abies vejarii (18.39) are codominant (Table 3).
Table 3 Density (trees ha-1), Importance Value Index (IVI), and Basimetric Area (AB) of the species in the four study sites.
| Spp | El Bosque | Spp | El Rosal | Spp | La Tinaja | Spp | Las Antenas | ||||||||
|---|---|---|---|---|---|---|---|---|---|---|---|---|---|---|---|
| IVI | N ha -1 | AB | IVI | N ha -1 | AB | IVI | N ha -1 | AB | IVI | N ha -1 | AB | ||||
| AbVe | 29.4 | 224 | 10.3 | CuAr | 31.4 | 152 | 18.0 | QuAf | 24.0 | 68 | 8.7 | QuAf | 24.7 | 192 | 6.0 |
| QuAf | 18.5 | 124 | 5.7 | AbVe | 29.4 | 144 | 16.0 | PcMa | 22.5 | 128 | 5.0 | PiAy | 20.9 | 152 | 4.8 |
| QuMe | 17.2 | 100 | 6.7 | PiAy | 14.4 | 44 | 5.6 | AbVe | 16.9 | 64 | 3.8 | AbVe | 18.3 | 160 | 2.9 |
| QuPo | 9.21 | 36 | 2.9 | PsMe | 11.6 | 32 | 5.6 | PiAy | 14.2 | 44 | 3.2 | PiTe | 18.2 | 88 | 5.1 |
| PcMa | 8.7 | 52 | 0.8 | QuAf | 8.5 | 40 | 2.7 | TaGl | 13.0 | 48 | 2.0 | ArXa | 12.68 | 64 | 2.3 |
| TaGl | 8.7 | 56 | 0.6 | PiPs | 2.2 | 4 | 0.2 | PiPs | 9.0 | 36 | 1.0 | QuFu | 5.0 | 12 | 0. 8 |
| PsMe | 1.9 | 8 | 0.1 | TaGl | 2.2 | 4 | 0.1 | ||||||||
| ZaFa | 1.6 | 4 | 0.1 | ||||||||||||
| PiAy | 1.5 | 4 | 0.1 | ||||||||||||
| UlCr | 1.5 | 4 | 0.8 | ||||||||||||
| ArXa | 1.5 | 4 | 0.5 | ||||||||||||
Spp = Species; AbVe = Abies vejarii; ArXa = Arbutus xalapensis; CuAr = Cupressus arizonica Greene Kunth; PcMa = Picea martinezii; PiAy = Pinus ayacahuite Ehrenb. ex Schltdl.; PiPs = Pinus pseudostrobus Lindl.; PiTe = Pinus teocote Schiede ex Schltdl. & Cham.; PsMe = Pseudotsuga menziesii (Mirb.) Franco; QuAf = Quercus affinis; QuFu = Quercus fulva Liebm.; QuMe = Quercus mexicana; QuPo = Quercus polymorpha Schltdl. & Cham.; TaGl = Taxus globosa Schltdl.; UlCr = Ulmus crassifolia Nutt; ZaFa = Zanthoxylum fagara (L.) Sarg.
In all localities, conifers are the group with the greatest species associated to Abies, which coincides with what was recorded by other authors (Rzedowski, 1978, Sánchez and López, 2003, Encina et al., 2008).
The density of tree species was different along the altitudinal gradient; the highest was determined at the Las Antenas site (668 individuals ha-1) and the lowest at La Tinaja (388 individuals ha-1); these values are comparable with those of other authors in temperate forests of northeast Mexico, Jiménez et al. (2001) with 297 individuals ha-1; Aguirre et al. (2003), 420-777 individuals ha-1; Návar (2010), 424-700 individuals ha-1; Ávila et al. (2012), 150-185 individuals ha-1; and Hernández et al. (2013) 716-940 individuals ha-1. The calculated basimetric area was 21.38 m2 ha-1 to 48.62 m2 ha-1 and the average for the four sites was 30.44 m2 ha-1 (Table 3).
The distribution of trees in the different diametric categories describes the characteristics of a mature forest without management in three of the four sites, where the largest number of trees is concentrated in the smaller diameter classes, but the highest dominance per basal area is that of the major categories (Figure 3). These characteristics are attributed to the high competition and to the intolerance to the shade of some species (Castellanos et al., 2008).
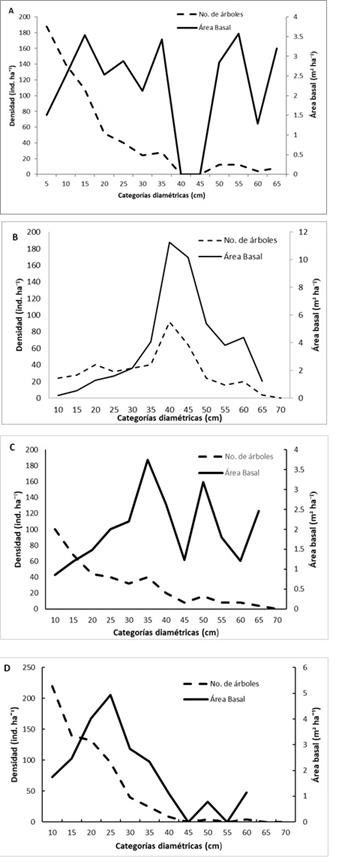
A = El Bosque; B = El Rosal; C = La Tinaja; D = Las Antenas. Densidad = Density; Área basal = Basimetric área; No. De árboles = Number of tres; Categorías diaméticas = Diametric classes
Figure 3 Distribution of the tree density and basimetric area in the stands, based upon the diametric classes.
The diametric conformation and the basal area for each forest mass in the sites may be due to the composition of the species, the age of the trees, the disturbances and the succession strategies of the tree strata (Yu et al., 2009; Price et al., 2011). Neumann (2001) states that the regular distribution provides the maximum space and optimal growth conditions for each individual, while that of conglomerates causes increase losses. Zenner and Hibbs (2000) point out that distribution patterns have been linked to different processes such as tree mortality, competition, regeneration, hole creation and seed, which could be responsible for the observed spatial patterns.
However, in addition to the above, the Kruskal-Wallis test shows that the diversity and the structure of the stands did not have significant statistical differences between the altitude intervals (p> 0.05), except for the Margalef index, which was slightly lower. than the stands of higher altitude (p <0.05), which indicates that there was a significant difference in the species richness in the altitudinal interval (Figure 4). Probably this pattern is explained as the species that develop at different altitudes experience diverse environmental conditions and factors such as the age of the trees, the type of stand depending on the composition of the tree species or the effect of the treetops that induce contrasting selection pressures that can lead to differentiation or acclimatization among populations (Sagar et al., 2008; Smith et al., 2008; Coote et al., 2013; Latreille et al., 2017).
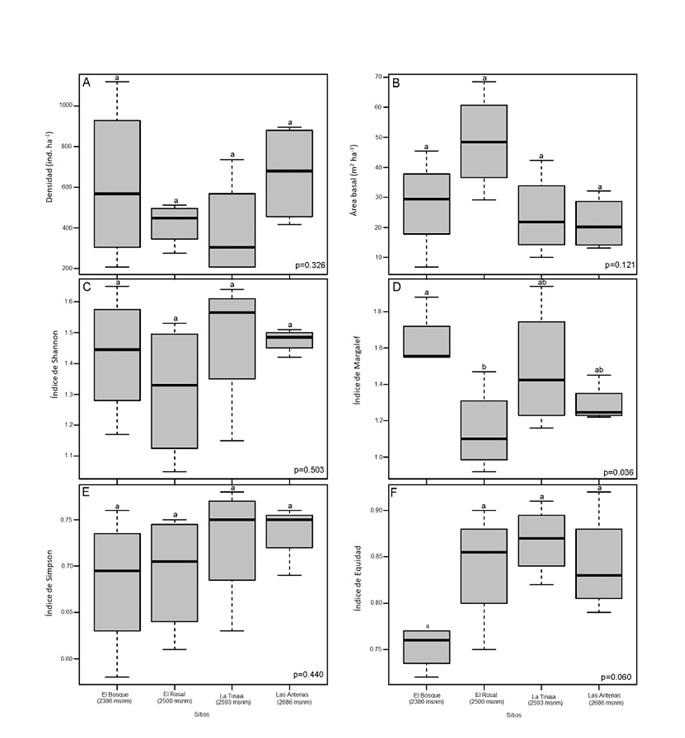
A = Density; B = Basimetric area; C = Shannon index; D = Margalef index; E = Simpson index; F = Equity index among the four sites. Values with different letters are significant (Tukey-Kramer; p≤0.05).
Figure 4 Graphs of the Kruskal-Wallis test.
The analysis of the rarefaction curves of the estimated species for the altitudinal gradient presented asymptote in approximately nine species; in general, 97 individuals were needed to achieve the maximum species richness and in the confidence intervals there was an overlap in three plots, so they did not present significant differences in the species richness. El Bosque was slightly above the three sites, that is, there is a higher concentration of species richness in the lower locality of 2 386 masl (Figure 5).
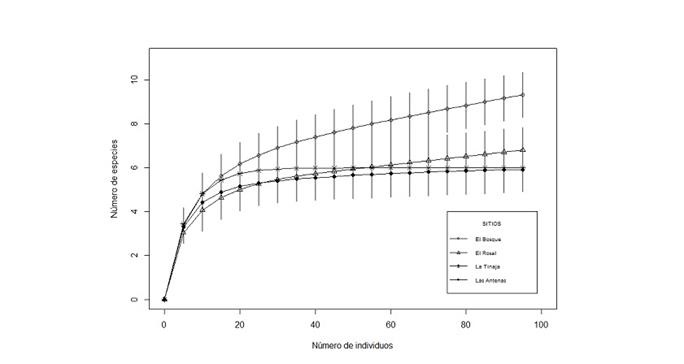
Número de especies = Number of species; Número de individuos = Number of individuals; Sitios = Sites.
Figure 5 Rarefaction curve of the species richness and the number of individuals among the communities along the altitudinal gradient.
One of the factors that seems to have influenced the low diversity is the distance that separates one community to another and with the type of forest under study. Therefore, this information reveals that temperate forest species show a certain equity in relative abundance (Návar-Cháidez and González-Elizondo, 2009; López-Hernández et al., 2017).
The comparison of the four forests when using the Sørensen index showed that the floristic similarity in the four sites on average was 44 %. This similarity is consistent since mixed conifer forests harbor groups of dependent species (Gao et al., 2014; Junyan et al., 2014).
The replacement of species with geographic distance and altitude between the four sites did not correlate positively (p> 0.05); that is, the distance between the sites and the altitude of each one had no effect on the floristic composition of the studied forest. This result may be associated with environmental factors such as forest type, topographic and climatic variations, soil and location (Suding et al., 2008, Hirota et al., 2009).
Conclusions
The floristic composition and structural dynamics of the Abies vejarii forest here studied are of great ecological importance due to its restricted population distribution and its exceptional value for the conservation of the biodiversity of the relict masses of northeastern Mexico. In addition, it facilitates the description of these vulnerable ecosystems in the face of climate changes, based on responses at different altitudes in the interactions between species.
Forests with this species in the region are heterogeneous and contain communities formed mainly by the species of Abies, Quercus and Pinus for their dominance along the gradient. The change in diversity using the Shannon, Equity and Simpson indices did not vary significantly between the sampling sites; however, through the Margalef index and the rarefaction curves, the highest species richness along the altitudinal gradient occurred in the lower elevation community and only 44 % of the species showed a similarity between the communities.
The distribution of the trees by diametric classes confirmed that 90 % of the specimens corresponded to diameters of small dimensions smaller than 40 cm, characteristic of an irregular mature forest not managed, and 70 % for basimetric area. Finally, it is worth mentioning that this slight variation is influenced by the distance that separates one community with another that was 300 m high. These factors contribute to the understanding of the influence of environmental elements on the development of temperate forests.
Acknowledgements
The authors thank the authorities of La Encantada ejido, General Zaragoza municipality, Nuevo León State, for their facilities. The Facultad de Ciencias Forestales of the Universidad Autónoma de Nuevo León for the financial support through the Programa de Apoyo a la Investigación Científica y Tecnológica, “Análisis de la estructura, diversidad y volumen de ecosistemas forestales con especies arbóreas amenazadas en el sur del estado de Nuevo León” PAICyT CT245-15, under Dr. Eduardo Javier Treviño Garza. To the work team in the field: Humberto López Alejandro, Israel López Martínez and Valeria Araceli Valdés Castillo.
REFERENCES
Aguirre C., O. A. 2002. Índices para la caracterización de la estructura del estrato arbóreo de ecosistemas forestales. Revista Mexicana de Ciencias Forestales 27(92): 5-28. [ Links ]
Aguirre C., O. A., J. Jiménez P., H. Kramer y A. Akça, 2003. Análisis estructural de ecosistemas forestales en el Cerro del Potosí, Nuevo León, México. Ciencia UANL 6(2): 219-225. [ Links ]
Alexander, K., J. Butler and T. Green. 2006. The value of different tree and shrub species to wildlife. British Wildlife 18(1): 18. [ Links ]
Alvarado R., D., L. Bauer y J. Galindo A. 1991. Declinación y muerte de bosque de oyamel (Abies religiosa) en el sur del Valle de México. Agrociencia. Serie Recursos Naturales Renovables 3: 123-143. [ Links ]
Anderson T., K. J., A. D. Miller, J. E. Mohan, T. W. Hudiburg, B. D. Duval and E. H. de Lucía. 2013. Altered dynamics of forest recovery under a changing climate. Global Change Biology 19(7): 2001-2021. [ Links ]
Ávila F., D. Y., M. A. González T., J. Jiménez P., O. A. Aguirre C., E. J. Treviño G. y B. Vargas L. 2012. Estructura de rodales de Pinus hartwegii afectados por incendios utilizando parámetros de vecindad en la Sierra Madre Oriental, México. Tropical and Subtropical Agroecosystems 15: 377-387. [ Links ]
Blundo, C., L. R. Malizia, J. G. Blake and A. D. Brown. 2012. Tree species distribution in Andean forests: influence of regional and local factors. Journal of Tropical Ecology 28(1): 83-95. [ Links ]
Camarero, J. J. y E. Gutiérrez. 2004. Pace and pattern of recent treeline dynamics: response of ecotones to climatic variability in the Spanish Pyrenees. Climatic Change 63: 181-200. [ Links ]
Castellanos B., J. F., E. J. Treviño G., O. A. Aguirre C., J. Jiménez P., M. Musálem S. y R. López A. 2008. Estructura de bosques de pino pátula bajo manejo en Ixtlán de Juárez, Oaxaca, México. Madera y Bosques 14(2): 51-63. [ Links ]
Castellanos B., J. F. , E. J. Treviño G., O. A. Aguirre C. , J. Jiménez P. y A. Velázquez M. 2010. Diversidad arbórea y estructura espacial de bosques de pino-encino en Ixtlán de Juárez, Oaxaca. Revista Mexicana de Ciencias Forestales 1(2): 39-52. [ Links ]
Chao, A., R. L. Chazdon, R. K. Colwell y T. Shen. 2005. A new statistical approach for assessing similarity of species composition with incidence and abundance data. Ecology Letters 8(2): 148-159. [ Links ]
Colwell, R. K. 2006. Estimates: statistical estimation of species richness and shared species from samples. Ver 8. http://www.purl.oclc.org/estimates (12 de agosto de 2017). [ Links ]
Colwell, R. K., A. Chao, N. J. Gotelli, S. Y. Lin, C. X. Mao, R. L. Chazdon and J. T. Longino. 2012. Models and estimators linking individual-based and sample-based rarefaction, extrapolation, and comparison of assemblages. Journal of Plant Ecology 5:3-21. [ Links ]
Comisión Nacional del Agua (Conagua). 2010. Información climatológica por estado. < http://smn.cna.gob.mx/es/informacion-climatologica-ver-estado?estado=nl > (15 de septiembre de 2017). [ Links ]
Condit, R., N. Pitman, E. G. Leigh, J. Chave, J. Terborgh, R. B. Foster, P. Núnez, S. Aguilar, R., Valencia, G. Villa, H. C. Muller L., E. Losos and S. P. Hubbell. 2002. Beta-diversity in tropical forest trees. Science 295 (5555): 666-669. [ Links ]
Coote, L., A. C. Dietzsch, M. W. Wilson, C. T. Graham, L. Fuller, A. T. Walsh, S. Irwin, D. L. Kelly, F. J. G. Mitchell, T. C. Kelly and J. O’Halloran. 2013. Testing indicators of biodiversity for plantation forests. Ecological Indicators 32: 107-115. [ Links ]
Corral R., J., B. Vargas L., C. H., Wehenkel, O. A. Aguirre C. , J. G. Álvarez G. y A. Rojo A. 2009. Guía para el establecimiento de sitios de investigación forestal y de suelos en bosques del estado de Durango. Universidad Juárez del Estado de Durango. Durango, Dgo., México. 81 p. [ Links ]
Curtis, J. T. and R. P. McIntosh, 1950. The interrelations of certain analytic and synthetic phytosociological characters. Ecology 31: 434-455. [ Links ]
Cuyckens G., A. E., L. R. Malizia y C. Blundo. 2015. Composición, diversidad y estructura de comunidades de árboles en un gradiente altitudinal de selvas subtropicales de montaña (Serranías de Zapla, Jujuy, Argentina). Madera y Bosques 21(3): 137-148. [ Links ]
Encina D., D. J. A., F. J. Encina D., E. Mata R. y J. Valdés R. 2008. Aspectos estructurales, composición florística y caracterización ecológica del bosque de oyamel de la sierra de Zapalinamé, Coahuila, México. Boletín de la Sociedad Botánica de México 83: 13-24. [ Links ]
Fagre, D. and D. L. Peterson. 2002. Modelling and monitoring ecosystem responses to climate chance in three North American mountain ranges. In: Körner, C. and E. M. Spehn (eds.). Mountain biodiversity a global assessment. Parthenon Publishing Group. New York, NY, USA. pp. 249-259. [ Links ]
Farjon, A. 2013. Abies vejarii. The IUCN Red List of threatened species 2013: e.T42302A2970671. http://dx.doi.org/10.2305/IUCN.UK.2013-1.RLTS.T42302A2970671.en(12 de agosto de 2017). [ Links ]
Farjon, A. and D. Filler. 2013. An Atlas of the World's Conifers: An Analysis of their Distribution, Biogeography, Diversity and Conservation Status. Brill, The Netherlands. 524p. [ Links ]
Fick, S. E. and R. J. Hijmans. 2017. Worldclim 2: New 1-km spatial resolution climate surfaces for global land areas. International Journal of Climatology 37(12):4302-4315. [ Links ]
Gao, T., M. Hedblom, T. Emilsson and A. B. Nielsen. 2014. The role of forest stand structure as biodiversity indicator. Forest Ecology and Management 330: 82-93. [ Links ]
García A., M. A., A. E. Estrada C. , C. M. Cantú A. y M. Pando M. 2012. Clasificación de nueve sitios de bosque mixto de coníferas con presencia de Taxus globosa en la Sierra Madre Oriental, Nuevo León y Tamaulipas, México. Botanical Sciences 90(1): 53-62. [ Links ]
Gernandt, D. S. y J. A. Pérez de la Rosa. 2014. Biodiversidad de Pinophyta (coníferas) en México. Revista Mexicana de Biodiversidad 85: 126-133. [ Links ]
Girardin, C. A. J., Y. Malhi, L. E. O. C. Aragao, M. Mamani, W. Huaraca H., L. Durand, K. J. Feeley, J. Rapp, J. E. Silva E., M. Silman, N. Salinas and R. J. Whittaker. 2010. Net primary productivity allocation and cycling of carbon along a tropical forest elevational transect in the Peruvian Andes. Global Change Biology 16(12): 3176-3192. [ Links ]
Granados S., D., G. F. López R. y M. A. Hernández G. 2007. Ecología y silvicultura en bosques templados. Revista Chapingo. Serie: Ciencias Forestales y del Ambiente 13(1): 67-83. [ Links ]
Guerrero H., R., J. G. González G. y A. Castro C. 2014. Análisis florístico de un bosque de Abies y el bosque mesófilo de montaña adyacente en Juanacatlán, Mascota, Jalisco, México. Botanical Sciences 92(4): 541-562. [ Links ]
Hernández S., J., O. A. Aguirre C. , E. Alanís R. , J.,Jiménez P. , E. J. Treviño G., M. A. González T., C. Luján Á., J. M. Olivas G. y L. A. Domínguez P. 2013. Efecto del manejo forestal en la diversidad y composición arbórea de un bosque templado del noroeste de México. Revista Chapingo. Serie: Ciencias Forestales y del Ambiente 19(2):189-200. [ Links ]
Hirota, M., P. Zhang, S. Gu, M. Du, A. Shimono, H. Shen, Y. Li and Y. Tang. 2009. Altitudinal variation of ecosystem CO2 fluxes in an alpine grassland from 3600 to 4200 m. Journal of Plant Ecology 2(4):197-205. [ Links ]
Homeier, J., S. W. Breckle, S. Günter, R. T. Rollenbeck and C. Leuschner. 2010. Tree Diversity, Forest Structure and Productivity along Altitudinal and Topographical Gradients in a Species-Rich Ecuadorian Montane Rain Forest: Ecuadorian Montane Forest Diversity and Structure. Biotropica 42(2): 140-148. [ Links ]
Instituto Nacional de Estadística y Geografía (Inegi). 2010. Compendio de información geográfica municipal. Gral. Zaragoza. Nuevo León. http://www.inegi.org.mx/geo/contenidos/Topografia/Compendio.aspx Fecha de consulta (6 de 12 de 2017). [ Links ]
Jiménez, J., O. Aguirre y H. Kramer. 2001. Análisis de la estructura horizontal y vertical en un ecosistema multicohortal de pino-encino en el norte de México. Investigación Agraria. Sistemas y Recursos Forestales 10(2): 355-366. [ Links ]
Junyan, Z., C. Kewu, Z. Runguo and D. Yi.2014 Changes in floristic composition, community structure and species diversity across a tropical coniferous broadleaved forest ecotone. Tropical Conservation Science 7: 126-144. [ Links ]
Kruskal, W. H. and A. W. Wallis. 1952. Use of ranks in one-criterion variance analysis. Journal of the American Statistical Association 47(260): 583-621. [ Links ]
Latreille, A., H. Davi, F. Huard and C. Pichot. 2017. Variability of the climate-radial growth relationship among Abies alba trees and populations along altitudinal gradients. Forest Ecology and Management 396: 150-159. [ Links ]
López-Hernández, J. A. L., O. A., Aguirre-Calderón, E. Alanís-Rodríguez, J. C. Monarrez-González, M. A. González-Tagle y J. Jiménez-Pérez. 2017. Composición y diversidad de especies forestales en bosques templados de Puebla, México. Madera y Bosques 23(1): 39-51. [ Links ]
Margalef, R. 1968. Perspectives in Ecological Theory, University of Chicago Press, Chicago, IL USA. 111 p. [ Links ]
Martínez A., J. V. 2014. Sucesión vegetal en bordes de bosques de pinabete (Abies guatemalensis Rehder) del occidente de Guatemala. Revista Mexicana de Ciencias Forestales 5(23): 64-77. [ Links ]
Martínez-Méndez, N., E. Aguirre-Planter, L. E. Eguiarte y J. P. Jaramillo-Correa. 2016. Modelado de nicho ecológico de las especies del género Abies (Pinaceae) en México: Algunas implicaciones taxonómicas y para la conservación. Botanical Sciences 94(1): 5-24. [ Links ]
Meraz M., M. J., F. J. Hernández, S. Corral R. y J. A. Nájera L. 2017. Diversidad arbórea a diferentes niveles de altitud en la región de El Salto, Durango. Revista Mexicana de Ciencias Forestales 8(40): 57-68. [ Links ]
Mostacedo, B. y T. S. Fredericksen. 2000. Manual de métodos básicos de muestreo y análisis en ecología vegetal. Editora El País. Santa Cruz, Bolivia. 87 p. [ Links ]
Mueller-Dombois, D. and H. Ellenberg. 1974. Aims and methods of vegetation ecology. John Wiley and Sons Co. New York NY, USA. 547 p. [ Links ]
Návar Ch., J. J. 2010. Los bosques templados del estado de Nuevo León: el manejo sustentable para bienes y servicios ambientales. Madera y bosques 16(1): 51-69. [ Links ]
Návar-Cháidez, J. J. y S. González-Elizondo. 2009. Diversidad, estructura y productividad de bosques templados de Durango, México. Polibotánica 27: 71-87. [ Links ]
Neumann, M. and F. Starlinger. 2001. The significance of different indices for stand structure and diversity in forest. Forest Ecology and Management 145: 91-106. [ Links ]
Oksanen, J., F. G. Blanchet, R. Kindt, P. Legendre, P. R. Minchin, R. B. O'Hara, G. L. Simpson, P. Solymos, M. H. H Stevens and H. Wagner. 2017. Vegan: Community ecology package. https://cran.r-project.org/web/packages/vegan/index.html (6 de diciembre de 2017). [ Links ]
Organización de las Naciones Unidas para la Alimentación y la Agricultura (FAO). 2010a. Evaluación de los recursos forestales mundiales 2010: Informe nacional, México. FRA2010/132. Roma, Italia. 98 p. [ Links ]
Organización de las Naciones Unidas para la Alimentación y la Agricultura (FAO). 2010b. Evaluación de los recursos forestales mundiales 2010: Informe principal. FRA2010/041. Roma, Italia. 381 p. [ Links ]
Pielou, E. C. 1966. Pieloum. The measurement of diversity in different types of biological collectionsm. Journal of Theoretical Biology 13: 131-144. [ Links ]
Price, M. F., G. Gratzer, L. Alemayehu D., T. Kohler, D. Maselli and R. Romeo (eds.). 2011. Mountain Forests in a Changing World: Realizing Values, Adressing Challenges. Food and Agriculture Organization of the United Nations (FAO) and Centre of Development and Environment (CDE). Rome, Italy. 82 p. [ Links ]
R Core Team. 2017. R: A language and environment for statistical computing. R Foundation for Statistical Computing. Vienna, Austria. URL URL https://www.R-project.org/ (6 de diciembre de 2017). [ Links ]
Rosenberg, M. S. and C. D. Anderson. 2011. PASSaGE: Pattern Analysis, Spatial Statistics and Geographic Exegesis. Version 2. Methods in Ecology and Evolution 2(3): 229-232. [ Links ]
Rzedowski, J. 1978. Vegetación de México. Ed. Limusa. México, D. F., México. 432 p. [ Links ]
Saavedra-Romero, L. L., D. Alvarado-Rosales, J. Vargas-Hernández y T. Hernández-Tejeda. 2003. Análisis de la precipitación pluvial en bosques de Abies religiosa (HBK.) Schlecht. et Cham., en el sur de la ciudad de México. Agrociencia 37(1): 57-64. [ Links ]
Sagar, R., A. Singh and J. S. Singh. 2008. Differential effect of woody plant canopies on species composition and diversity of ground vegetation: a case study. Tropical Ecology 49(2): 189-197. [ Links ]
Sánchez G., A., L. López M. y H. Vibrans. 2006. Composición y patrones de distribución geográfica de la flora del bosque de oyamel del cerro Tláloc, México. Boletín de la Sociedad Botánica de México 79: 67-78. [ Links ]
Sánchez G., A. y L. López M. 2003. Clasificación y ordenación de la vegetación del norte de la Sierra Nevada, a lo largo de un gradiente altitudinal. Anales del Instituto de Biología. Serie Botánica 74(1):47-71. [ Links ]
Secretaria de Medio Ambiente de Recursos Naturales (Semarnat). 2010. NOM-059-Semarnat-2010. Protección ambiental - especies nativas de México de flora y fauna silvestres - categorías de riesgo y especificaciones para su inclusión, exclusión o cambio - lista de especies en riesgo. Diario Oficial de la Federación (30 de diciembre de 2010). México, D.F., México. 77 p. [ Links ]
Shannon, C. E. and W. Weaver. 1949. The mathematical theory of communication University of Illinois. Press Urbana and Chicago. Chicago, IL, USA. 28 p. [ Links ]
Simpson, E. 1949. Measurement of diversity. Nature 163, 688. doi:10.1038/163688a0. [ Links ]
Smith, G. F., T. Gittings, M. Wilson, L. French, A. Oxbrough, S. O’Donoghue, J. O’Halloran, D. L. Kelly, F. J. G. Mitchell, T. Kelly, S. Iremonger, A McKee and P. Giller. 2008. Identifying practical indicators of biodiversity for stand-level management of plantation forests. Biodiversity and Conservation 17(5): 991-1015. [ Links ]
Stephenson, N. L. and P. J. Mantgem. 2005. Forest turnover rates follow global and regional patterns of productivity: Patterns in forest turnover rates. Ecology Letters 8(5): 524-531. [ Links ]
Suding, K. N., S. Lavorel, F. S. Chapin, . J H. C. Cornelissen, S. Díaz, E. Garnier, D. Goldberg, D. U. Hooper, S. T. Jackson and M. L. Navas. 2008. Scaling environmental change through the community‐level: a trait‐based response‐and‐effect framework for plants. Global Change Biology 14: 1125‐1140. [ Links ]
Treviño G., E. J., C. Cavazos C. y O. A. Aguirre C. 2001: Distribución y estructura de los bosques de galería en dos ríos del centro sur de Nuevo León. Madera y Bosques 7(1):13- 25. [ Links ]
Valdez T., V., R. Foroughbakhch P. y G. J. Alanís F. 2003. Distribución relictual del bosque mesófilo de montaña en el noreste de México. Ciencia 6(3):360-365. [ Links ]
Xiang, X., M. Cao and Z. Zhou. 2007. Fossil history and modern distribution of the genus Abies (Pinaceae). Frontiers of Forestry in China 2(4): 355-365. [ Links ]
Yu, H., T. Wiegand, X. Yang and L. Ci. 2009. The impact of fire density-dependent mortality on the spatial patterns of a pine forest in the Hulun Buir sandland, Inner Mongolia, China. Forest Ecology and Management 257(10): 2098-2107. [ Links ]
Zenner, E. K. and D. E. Hibbs. 2000. A new method for modelling the heterogeneity of forest structure. Forest Ecology and Management 129(1): 75-87. [ Links ]
Received: August 04, 2017; Accepted: November 27, 2017
 Este es un artículo publicado en acceso abierto bajo una licencia Creative Commons
