


Servicios Personalizados
Revista
Articulo
 texto en
  Inglés (pdf)
 Artículo en XML
 Referencias del artículo
 Enviar artículo por email
Indicadores
-
 Citado por SciELO
 -
 Accesos
Links relacionados
-
 Similares en
SciELO
Similares en
SciELO
Compartir

 Permalink
Revista mexicana de ciencias forestales
versión impresa ISSN 2007-1132
Rev. mex. de cienc. forestales vol.8 no.44 México nov./dic. 2017
Articles
Hemeroby index for the assessment of the conservation of pine-oak forests in a micro-watershed
1Centro de Investigación Orográfica. México.
2Departamento de Botánica, Facultad de Ciencias Biológicas, Universidad Autónoma de Nuevo León. México.
3Departamento de Botánica, Ecología y Manejo de Biodiversidad. Universidad Autónoma Agraria Antonio Narro. México.
The conservation of soil and vegetation is essential to maintain the proper functioning of a watershed, because of the fundamental importance that both components have for the hydrological and ecological processes that occur in it. The term hemerobia represents a measure of the anthropic impact on the flora. Applied to vegetation, the index or degree of hemerobia corresponds to the distance or separation between a current plant community and a potential natural one, or its successional state of climax under the total absence of anthropogenic influence.The conservation status of the pine-oak forest in a micro-watershed of the Gran Sierra Plegada (Great Fold Mountains), in the state of Nuevo León, was assessed by means of a descriptive study and the estimation of the hemeroby index. This index was obtained by comparing the vegetation of interest with the potential natural vegetation; by evaluating specific indicators, it integrates various aspects of the composition, structure and use of the vegetation into a single value. The index assumes that the changes between the two vegetation statuses are the result of human activity, and therefore it indicates the degree of anthropic impact on the vegetation. The studied forest has various degrees of hemeroby. It can be concluded that the conservation status of the micro-watershed area is not optimal.
Key words: Pine-oak forest; conservation; hemeroby; forest management; micro-watershed; vegetation
La conservación del suelo y la vegetación es esencial para mantener el buen funcionamiento de una cuenca hidrográfica, por la importancia fundamental que ambos componentes tienen para los procesos hidrológicos y ecológicos que en ella ocurren. El término de hemerobia representa una medida del impacto antrópico sobre la flora. Aplicado a la vegetación, el índice o grado de hemerobia corresponde a la distancia o separación entre una comunidad vegetal actual y una natural potencial, o su estado sucesional de clímax bajo la ausencia total de la influencia antropogénica. Se evaluó el estado de conservación del bosque de pino-encino en una microcuenca hidrográfica de la Gran Sierra Plegada en el estado de Nuevo León. Mediante un estudio descriptivo y la estimación del índice de hemerobia. Este índice se obtuvo comparando la vegetación de interés con la natural potencial, a través de la evaluación de indicadores particulares, integra en un solo valor diversos aspectos de la composición, estructura, y uso de la vegetación. El índice asume que los cambios entre ambos estados de la vegetación son resultado de las actividades humanas, por lo que indica el grado de impacto antrópico sobre ella. El bosque estudiado presenta diversos grados de hemerobia. Se concluye que el estado de conservación de la vegetación en la zona de la microcuenca no es óptimo.
Palabras clave: Bosque de pino-encino; conservación; hemerobia; manejo forestal; microcuenca; vegetación
Introduction
The conservation of soil and vegetation is essential to maintain the proper functioning of a watershed, given the crucial importance of both these components for the hydrological and ecological processes occurring in it.
The soil is the essential biophysical support for the vegetation cover through which rain water seeps. At the same time, vegetation is an element that protects it against hydric and eolic erosion, and an essential factor in the regulation of runoff (Lindholm and Stenbeck, 1993). The loss of both elements has an impact on the entire ecosystem to which they belong, as they affect multiple processes, as well as its biotic and abiotic components, causing the loss of biodiversity or the reduction or annulment of the ecosystem’s ability to provide resources and environmental services, including the capture of moisture and the recharge of the aquifers, the regulation of the weather, carbon sequestration, and the abatement of air pollution (Cantú-Ayala et al., 2013).
The vegetation in the Gran Sierra Plegada (Great Fold Mountains), within the Cumbres de Monterrey National Park (Spanish acronym, PNCM) has been severely affected in the last decades. Between the years 1975 and 1995, the surface area of the forests decreased by 13.68 % (6 858 ha), and that of submontane shrubs, by 29 % (7 457 ha). Conversely, the secondary vegetation increased by 37.86 % (7 063 ha), and the naked soils by 758 % (5 458 ha) (Murillo-Sánchez, 2002). An area of 4 237 ha in the PNCM is estimated to have erosion and loss of soil issues; furthermore, 56 549 ha are particularly susceptible to erosion (Pronatura Noreste A.C., 2011). The main disturbance factors are overgrazing, forest fires and pests; the uncontrolled exploitation of forest resources and the change of land use (Cantú-Ayala et al., 2013).
Although these issues have been recently addressed in over 1 740 ha (Rovalo-Merino et al., 2013), the efforts have been centered on those areas that provide an easy access for vehicles. Nevertheless, certain areas that require attention are not easily accessible.
The term and the concept of hemeroby were proposed by Jalas (1955); the word comes from the Greek hemeros (cultivated, tamed) and bios (life), and it stands for a measure of the anthropic impact on the flora. It was further developed by Sukopp (1972) and Kowarik (1988) and applied at a landscape and ecosystem level (Steinhardt et al., 1999; Winter, 2012; Kiedrzynski et al., 2014; Walz y Stein, 2014). Applied to vegetation, the hemeroby rate or index corresponds to the distance or separation between a current vegetation community and a potential natural vegetation community, or its peak successional status in the total absence of anthropogenic influence (Walz and Stein, 2014). It is measured by assessing the indicators for the vegetation and the environment, whose integration determines the hemeroby index, expressed in a scale.
Today there is an ongoing debate regarding how many and which markers should be assessed; this is reflected in the diversity of methodologies followed by the various authors who have worked with the hemeroby index so far. For example, Grabherr et al. (1998) use 18 markers, including the dead timber volume, and they consider nine possible degrees of hemeroby; Steinhardt et al. (1999) incorporate markers for the morphological and chemical features of the soil and consider only seven degrees of hemeroby.
More recent works continue to incorporate changes; thus, Stoll (2007, 2008) modified the method used by Grabherr et al. (1998), adapting it to the conditions of the native vegetation of Chile and assessing the conservation status of the vegetation of Quebrada Honda, in the Region of Maule, Chile (Stoll, 2008); furthermore, he raised the number of markers to eight, with five degrees of hemeroby.
The present study focuses on the assessment of the conservation status of the vegetation of a micro-watershed to which access is difficult, using the hemeroby index to obtain a diagnosis that may contribute to guide management actions. The presence of conditions or risk factors for the vegetation of the micro-watershed was also determined.
Materials and Methods
Study area
The San Judas-Agua del Toro micro-watershed is located at the coordinates 25°34’25 N and 100°27’43 W, at the northern end of the Great Fold Mountains, in the Eastern Sierra Madre, southwest of the city of Monterrey, in the municipality of Santa Catarina, Nuevo León (Figure 1). Access to this micro-watershed is difficult, as there are no roads for any type of vehicle, and the terrain is very steep.

Área de estudio = Study area; Sitios de muestreo = Sampling sites; Parque Cumbres de Monterrey = Cumbres de Monterrey National Park; Área Metropolitana de Monterrey = Metropolitan Area of Monterrey.
Figure 1 Study area and sampling sites 1, 2, 3 and 4 from left to right.
From the hydrological point of view, the area is a tributary micro-watershed to the sub-basin of the Santa Catarina river, which is part of the Bravo - San Juan River Basin (IAENL, 2011); its surface area is 28.2 km2, along which recharge areas for the three hydrogeological units of the Campo Buenos Aires aquifer -the main source of underground water for Monterrey and its metropolitan area- are located (De León-Gómez et al., 1998; Masuch-Oesterreich et al., 2001; Conagua, 2009; ITESM, 2009; Conagua, 2011); it is characterized by exhibiting a deficit over its mean annual recharge (Conagua, 2011).
The Great Fold Mountains are an orographic system formed by sedimentary rocks of the Mesozoic era corresponding to geological formations that have their origin in the ocean of the higher Jurassic and Cretaceous periods (SGM, 2008); there are, besides, continental alluvial deposits of the Tertiary and Quaternary periods of the Cenozoic era.
The Campo Buenos Aires aquifer consists of three hydrogeological units located in certain sets of those geological formations: the Cretaceous Unit, in the limestone of the Cupido, Aurora and Cuesta del Cura formations; the Jurassic Unit, in the limestone of the Zuloaga formation, and the Alluvial Unit, on the gravel of the alluvial deposits (Conagua, 2009). Outcrops of the Cupido and Zuloaga formations and alluvial deposits were observed in the studied micro-watershed; therefore, it is a recharge area for the three aquifer units (Figure 2).

Área de estudio = Study area; Sitios de muestreo = Sampling sites; Formación geológica = Geological formations
Figure 2 Geological formations in the study area and sampling sites.
The area has two different types of climate: BS0hw, dry semi-warm, and BS1kw, semi-dry temperate; the mean annual precipitation ranges between 432.3 mm and 688.6 mm, and the mean annual temperature, between 14.0 and 20.7 °C (SMN, 2012, 2013). The predominant vegetation is the pine-oak forest, followed by submontane and xerophytic shrubs (Pronatura Noreste A. C., 2011) (Figure 3). The occurring soil types are lithosols, regosols, rendzines and xerosols (Inegi, 1986).

Área de estudio = Study area; Sitios de muestreo = Sampling sites; Tipos de vegetación = Vegetation types; Bosque de encino = Oak forest; Bosque de pino-encino = Pine-oak forest; Bosque de encino pino = Oak-pine forest; Bosque de pino = Pine forest; Bosque de táscate (juniperus-enebro) = Juniper forest; Matorral submontano = Submontane shrub
Figure 3 Vegetation types in the study area and sampling sites.
Stoll’s method (2007) was chosen to estimate the hemeroby index, due to the similarities in topography and vegetation type (mountain canyon and temperate forest) between the area studied by Stoll and the present area, as well as because it is the most simplified among the methods reviewed in the literature.
Directed stratified sampling was used, according to three criteria: geological formation (Zuloaga Formation), vegetation (mixed pine-oak forest) and altitude (1 460 m, 1 660 m, 1 860 m, and 1 960 m). Four sampling sites were established (figures 1, 2 and 3) encompassing the total longitude and four different altitudes in the mixed forest strip located in the Zuloaga Formation.
A 20 m x 10 rectangular plot established longitudinally to the curves of the terrain was used to characterize the vegetation in each sampling site. This sampling intensity was due to limitations in time and mobility resulting from the difficulty to access the work area. However, when possible, representative sites of the physiognomic variations observed in the forest strip of interest were carefully selected. The arboreal stratum in the total area of each plot (200 m2), the shrub stratum in two cater-cornered inner 25 m2 subplots, and the herbaceous stratum in five 1 m2 inner subplots were considered. All individuals that were not branched from the base were regarded as belonging to the arboreal stratum. The following attributes were registered: species, height and crown diameter, for trees and shrubs, and species and cover only, for the herbaceous vegetation. The frequency, density, cover and importance values were estimated for each taxon; these data were then used to calculate the Shannon-Wiener diversity and equity index, the Margalef´s richness index, and Simpson’s dominance (Mostacedo and Fredericksen, 2000; Melo and Vargas, 2002).
The hemeroby index was estimated for each sampling site through the aggregation and average of eight criteria or markers assessed per site (Stoll, 2007): the composition of the arboreal stratum (1), the composition of the shrub and herbaceous strata (2), the type of regeneration of tree species (3), the use of the vegetation (4), the use of the environment (5), the stratification (6), the diversity of species of the arboreal stratus (7), and the diversity of species of the shrub and herbaceous strata (8).
The comparisons between the assessed vegetation and the corresponding natural potential vegetation for the various criteria were made based on the descriptions of the mixed pine-oak forest community cited in descriptive studies carried out in the region (Rojas-Mendoza, 1965; Marroquín, 1968; Rzedowski, 1978; Baca-Venegas, 2000; Jiménez et al., 2001).
Criterion 1 (composition of the arboreal stratus). The current and potential covers of each species were compared; the presence or absence of taxa, the expected potential cover, and the cover of neophyte species were included.
A basic table of cover categories (Table 1) was used to establish potential cover categories according to the consulted information (Table 2). Based on the cover obtained in field, a current cover category was assigned to each registered arboreal taxon. The categories obtained from the comparison were later correlated with a matrix (Table 3).
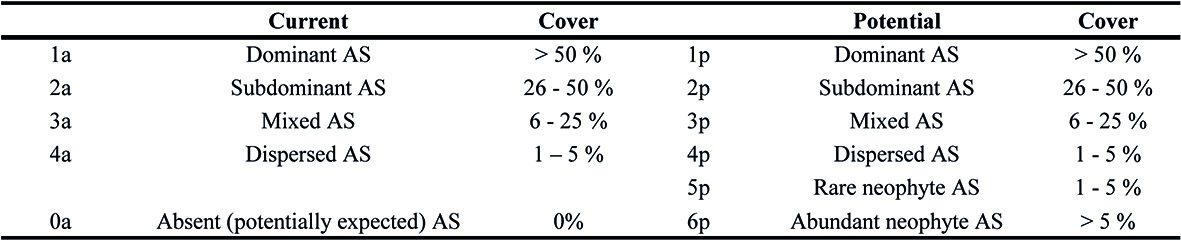


The correlation value for each cover category was added to obtain the value of Criterion 1.

Where:
C1 = Criterion 1
RV n = Retention value of species “n”
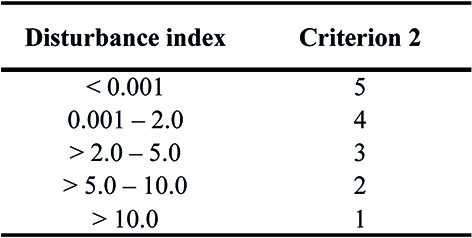
Criterion 2 (composition of the shrub and herbaceous strata). The presence and relative cover of species indicating disturbance in both strata were assessed; the neophyte and native species that are foreign to the assessed vegetal community were considered, as were the species that indicate changes in the cover of the respective stratum, based on the information available in the literature. Specific categories were established for the comparison (Table 4). A cover index was obtained for each of the taxa belonging to one of the categories, based on a matrix (Table 5).


The disturbance index was then calculated using the following formula:

Where:
Di = Disturbance index
Dp = Disturbance probability
Ci = Cover index
Finally, the value of the criterion was determined by correlating the disturbance index with the values shown in Table 6.
Criterion 3 (type of regeneration of arboreal species). The relative regeneration cover of each present arboreal species was estimated, by counting the young individuals and the seedlings. According to the classification shown in Table 7, each taxon was assigned a representative factor.

The value of the criterion is the sum of the products of the relative covers of each species in regeneration and the corresponding factor, as shown in the following formula:

Criterion 4 (use of vegetation). The intensity, type and use history of the vegetation in the study area were estimated based on personal communications with the owner of the plot and direct in-field observation of the factors involved in each use type. For example, in order to evaluate the intensity in the use type “grazing”, the presence and number of cattle, the perceptible compacting of the soil, the appearance of the vegetation and the disturbance marker species brought about by overgrazing. The correspondence factors were established (Table 8).

The product of the factors is the Influence Number, which corresponds with a specific criterion value (Table 9).

Criterion 5 (use of the environment). The type of use of the environment around the site at a distance of not more than 1 km was determined based on in-field observations. A criterion value corresponds to each use type (Table 10).

Criterion 6 (stratification). The observed structure was compared with the potential structure cited in the literature for the same type of vegetation, assigning it a class based on the stratification types shown in Table 11.

Criterion 7 (richness of arboreal species). The registered number of arboreal species was contrasted with the minimum number and with the most frequent number of arboreal taxa under natural conditions, as documented in the bibliography (Table 12).

Criterion 8 (richness of species of the shrub and herbaceous strata). The registered number of species in the shrub and herbaceous strata was compared with the minimum number and with the most frequent number of species under natural conditions as reported in the literature, as shown in Table 12.
Once the criteria were obtained, their values were averaged in order to estimate the index or degree of hemeroby by sampling site. The average of the degrees in the sampled sites was subsequently calculated in order to estimate the overall hemeroby index for the pine-oak forest in the study area. The index was then interpreted according to the classification shown in Table 13.

The conditions and risk factors for the vegetation in the watershed were determined through in-field observation and direct communication with the owner of the plot, who was requested information regarding the current and past activities carried out in the plot and their degree of intensity.
Results
Characterization of the vegetation
A total of 36 species were registered, corresponding to 34 genera and 23 families (tables 14 and 15). The arboreal stratus of the vegetation is dominated by Quercus canbyi Trel. (index of importance value: 92.51), Pinus arizonica Engelm. (64.17) and Quercus laeta Liebm. (55.98); and the shrub stratum is dominated by Rhus virens Lindh. ex A.Gray (51.73), Leucaena greggii S.Watson (48.50), and Decatropis bicolor (Zucc.) Radlk. (46.53). In the herbaceous stratum, the most dominant species are Gymnosperma glutinosum Less. and Ageratina espinosarum (A.Gray) R.M.King & H.Rob. (tables 16, 17 and 18).


The ecological indices estimated by stratum for each sampling site are shown in figures 4, 5 and 6.

Sitios de muestreo = Sampling sites; Riqueza = Richness; Diversidad = Diversity; Equitatividad= Equity; Dominancia = Dominance
Figure 4 Ecological indices of the arboreal stratum by sampling site.

Sitios de muestreo = Sampling sites; Riqueza = Richness; Diversidad = Diversity; Equitatividad= Equity; Dominancia = Dominance
Figure 5 Ecological indices of the shrub stratum per sampling site.

Conservation status of the vegetation
Figure 7 shows the criteria and estimated degrees of hemeroby per sampling site.

Valores = Values; Sitios de muestreo = Sampling sites; Criterios y grados de hemorobia = Criteria and degrees of hemeroby; Hemorobia = Hemeroby.
Figure 7 Values of the criteria and degrees of hemeroby per sampling site.
Based on the average of the degrees of hemeroby of all the sampling sites, an overall degree of hemeroby of 4 was estimated. This indicates that the vegetation corresponds to an oligohemerobic or almost natural site, in which there is a low anthropic influence and a clearly recognizable natural vegetation.
Risk conditions for the vegetation
Three conditions or risk factors were observed in the study area: 1) the presence of cattle, which has existed in the micro-watershed for several decades -cattle and goats in the past, but currently only cattle (Figure 8); 2) the existence of areas with a partial or total loss of the vegetation cover, hydric erosion and erosion gullies (Figure 9); the surface of these areas was estimated in more than 45 ha, distributed in a stretch of 4 km, along which a gradient was observed in the intensity of the loss of vegetation cover; 3) the presence of patches of trees of the Pinus genus, with symptoms of a likely infestation by debarker insects, Dendroctonus spp. (Figure 10).


Discussion
Although the estimated overall hemeroby index indicates that its vegetation has a low anthropic impact, there was a variation between the estimated indices for the sampling sites. The degree of hemeroby increases from site 1 to site 4, indicating that the anthropic impact on the vegetation diminishes from site 1 to site 4 (Figure 7). This variation seems to be in accordance with the geographic gradient as to the intensity of the aforementioned loss of vegetation cover.
At the same time, this gradient seems to be related to the presence of a nucleus of historical and current livestock activity within the micro-watershed; as for this nucleus, site 1 is the closest (less than 1 km away from an abandoned pasture), and site 4 is the most distant; this may be a possible explanation of the increase in values of hemeroby as the distance from the said nucleus increases.
This is reflected in the correspondence between the hemeroby values and those estimated for diversity in the various growth strata in each sampling site. Thus, the richness, diversity and equity increase generally from site 1 to site 4, while the dominance value decreases (figures 4, 5 and 6).
Marker species for disturbance, such as Gymnosperma glutinosum and Leucaena greggii (González-Elizondo, 1996; Estrada-Castillón et al., 2013) were found in all the sites, most abundantly in site 1. The former is dominant in the herbaceous stratum, and the latter, in the shrub-arboreal stratum.
The identification of Koeberlinia spinosa -not characteristic of pine-oak forests, but, rather, of the thorny bushes of Tamaulipas, which are located in sites subjected to semiarid climatic conditions- is worth mentioning. Its presence was considered to be an indication of disturbance.
On the other hand, the areas with loss of vegetation cover may be providing positive feedback to anthropogenic impact, as they exert an influence on the rest of the vegetation through the border effect. These areas are characterized by changes both in the abiotic (air humidity, humidity content and temperature of the soil, degree of insolation, erosion foci, etc.) and the biotic characteristics, such as the favored presence of neophyte species and a reduction of the seed bank (Peña-Becerril et al., 2005; Santos and Tellería, 2006). Again, site 1 is the closest one to the areas with the most notorious desertification process.
A personal communication with the owner of the study area corroborated the presence, in recent decades, of cattle and goats in large numbers; today there are only cattle. Areas with a loss of vegetation cover exhibit characteristics that are typical of areas that are affected by trampling by cattle. Both these facts and those mentioned above justify the hypothesis that uncontrolled grazing activities have been and continue to be the main cause of estimated anthropic impact on the vegetation in the study area.
Although the authors regard the approach to the hemeroby index presented herein as useful, they recommend caution in considering the effectiveness of the method used for its estimation. On one hand, as we mentioned at the beginning of this paper, there is disagreement between authors as to the markers that should be assessed for its estimation. On the other hand, and independently from this fact, since the estimation is based on a comparison between the studied vegetation and its potential natural counterpart free of impact, as a reference point, the availability of descriptive studies of the latter is required; this is difficult or impossible to attain due to the reduced surface area of primary vegetation present in Mexico. For this reason, potential natural conditions that are mere assumptions and cannot be proven must be used as a reference.
Furthermore, although the outcome of the present work is considered to be pertinent, in an illustrative sense, with regard to the application of the hemeroby index, we are aware of its intrinsic limitations, which are due to the limited sampling effort carried out resulting from the difficulties of access and mobility in the work area.
It is our hope that, as the hemeroby index gains greater diffusion among the Mexican scientific community and is applied by more researchers, its use will be assessed, proposed and perfected in such a way that its application may contribute to the obtainment of essential information for implementing actions for the management and conservation of the vegetation of Mexico.
Conclusions
The conservation status of the pine-oak forest of the studied micro-watershed is not optimal, as the hemeroby index and the estimated community attributes show. Provided that the hemeroby index indicates the degree of anthropic impact on the vegetation, and taking into account the history of the use of the studied micro-watershed, a possible cause of the observed disturbance is uncontrolled grazing.
Therefore, it is suggested that the convenience of characterizing the livestock activity in the micro-watershed based on the number of animal units present and on the pasture coefficient of the vegetation, as well as carrying out a complete study of the vegetation in the rest of the micro-watershed -with a sufficiently intense sampling effort-, in order to develop a management plan that is pertinent to its current conditions. It is equally necessary to address the disturbance present in the area by means of a thorough assessment of the areas that exhibit loss of vegetation and soil, in order to develop and apply a management plan in the area. Finally, we suggest confirming the presence of an infestation by debarker insects in those areas where signs of their presence were observed, and, if such pests are proved to be present, proceeding at once to their management.
Acknowledgements
The first author thanks his scientific colleagues and mountaineer partners for their support in field work, specially to Conrado González and Ugo Silva, as well as to Enrique Neri and Dayana Pruneda. A very particular acknowledgement with deep respect and love, in spite of her impossibility to read it, to Capita, mountain dog who always, in an unconditional and loyal way, was a tireless companion in every crossing through canyons, glens, forests, scrublands, harbors and hilltops. She will always be in our memories.
REFERENCES
Baca-Venegas J. 2000. Caracterización de la estructura vertical y horizontal en bosques de pino-encino. Tesis de maestría. Facultad de Ciencias Forestales, Universidad Autónoma de Nuevo León. Linares, N.L., México. 117 p. [ Links ]
Cantú-Ayala C., M. Rovalo-Merino, J. Marmolejo, S. Ortiz-Hernández, F. Seriñá-Garza (eds.). 2013. Historia Natural del Parque Nacional Cumbres de Monterrey, México. UANL-CONANP. Monterrey, N.L., México. 414 p. [ Links ]
Comisión nacional del Agua (Conagua). 2009. Actualización de la Disponibilidad Media Anual de Agua Subterránea. Acuífero (1907) Campo Buenos Aires. Estado de Nuevo León. Comisión Nacional del Agua. Subdirección General Técnica. Gerencia de Aguas Subterráneas. Subgerencia de Evaluación y Ordenamiento de Acuíferos. Diario Oficial de la Federación. 28 de agosto de 2009. México, D.F., México. 18 p. [ Links ]
Comisión nacional del Agua (Conagua). 2011. Determinación de la Disponibilidad Media Anual de Agua Subterránea del Acuífero Campo Buenos Aires, Clave 1907. Diario Oficial de la Federación . 8 de julio de 2011. México, D.F., México. 30 p. [ Links ]
De León-Gómez, H., D. Masuch-Oesterreich, F. Medina-Barrera y F. Hellweg. 1998. Investigaciones hidrogeológicas en el Cañón de la Huasteca como contribución al abastecimiento de agua potable de Monterrey, Nuevo León, NE-México. Geogaceta 23: 87-90. [ Links ]
Estrada-Castillón, E., J. Villarreal-Quintanilla, M. M. Salinas-Rodríguez, H. Rodríguez-González, J. Jiménez-Pérez and M. A. García-Aranda. 2013. Flora and Phytogeography of Cumbres de Monterrey National Park, Nuevo Leon, Mexico. Journal of the Botanical Research Institute of Texas 7 (2): 771-801. [ Links ]
González-Elizondo, M. 1996. Análisis de la vegetación secundaria de Linares N.L., México. Tesis de maestría. Facultad de Ciencias Forestales. Universidad Autónoma de Nuevo León. Linares, N.L., México. 98 p. [ Links ]
Grabherr, G., G. Koch, H. Kirchmeir and K. Reiter. 1998. Hemeroby of Austrian Forest. http://131.130.59.133/projekte/hemerobie/hem_forest.htm Fecha de consulta (13 de marzo de 2013). [ Links ]
Instituto del Agua del Estado de Nuevo León (IAENL). 2011. Diagnóstico sobre la Gestión y el Uso del Agua en el Sector Agropecuario de Nuevo León. Instituto del Agua del Estado de Nuevo León. Apodaca, N.L., México. 287 p. [ Links ]
Instituto Nacional de Estadística, Geografía e Informática (Inegi). 1986. Síntesis Geográfica de Nuevo León. Inegi. México, D.F., México. 170 p. [ Links ]
Instituto Tecnológico de Estudios Superiores Monterrey (ITESM). 2009. Diagnóstico Integral de la Cuenca del Río San Juan. Centro del Agua para América Latina y el Caribe. Monterrey, NL., México. 309 p. [ Links ]
Jalas, J. 1955. Hemerobe und hemechore Pflanzenarten. Ein terminologischer Reformversuch. Acta Fauna Flora Fennica 72(11): 1-15. [ Links ]
Jiménez, J., O. Aguirre y H. Kramer. 2001. Análisis de la estructura horizontal y vertical en un ecosistema multicohortal de pino-encino en el norte de México. Investigación Agraria: Sistemas y Recursos Forestales 10(2): 355-366. [ Links ]
Kiedrzynski, M., E. Kiedrzynska, P. Witoslawski, M. Urbaniak and J. Kurowski. 2014. Historical land use, actual vegetation, and the hemeroby levels in ecological evaluation of an urban river valley in perspective of its rehabilitation plan. Polish Journal of Environmental Stududies 23 (1): 109-117. [ Links ]
Lindholm, P. and I. Stenbeck. 1993. Rainfall, soil loss and the effect of vegetation cover; results of measurements in a tree plantation area in West Pokot District of Kenya. International Rural Development Center, University of Agricultural Sciences. Working Paper Num. 244. Uppsala, Suecia. 25 p. [ Links ]
Marroquín, J. 1968. Datos botánicos de los cañones orientales de la Sierra de Anáhuac, al sur de Monterrey, N.L., México. Instituto de Investigaciones Científicas. Universidad de Nuevo León. Cuadernos del Instituto de Investigaciones Científicas. Núm. 14. San Nicolás de los Garza, N.L., México. 79 p. [ Links ]
Masuch-Oesterreich, D., J. Medina-Alemán y J. Martínez-de la Cerda. 2001. Manejo de agua subterránea para la ciudad de Monterrey, NE-México: el acuífero Buenos Aires en el Cañón La Huasteca. Boletín Informativo de la Unión Geofísica Mexicana 21(3): 187. [ Links ]
Melo C., O. A. y R. Vargas R. 2002. Evaluación ecológica y silvicultural de ecosistemas boscosos. Universidad del Tolima, CRQ, Carder, Corpocaldas, Cortolima. Ibagué, Colombia. 235 p. [ Links ]
Mostacedo, B. y T. Fredericksen. 2000. Manual de Métodos Básicos de Muestreo y Análisis en Ecología Vegetal. Proyecto de Manejo Forestal Sostenible (BOLFOR). Santa Cruz, Bolivia. 92 p. [ Links ]
Murillo-Sánchez, M. 2002. Estudio del efecto del cambio de uso de suelo en el escurrimiento en la subcuenca 24 Bf “Monterrey”, aplicando un sistema de información geográfica. Tesis de maestría. División de Ingeniería y Arquitectura. Instituto Tecnológico y de Estudios Superiores de Monterrey. Monterrey, N.L., México. 119 p. [ Links ]
Peña-Becerril, J., A. Monroy-Ata, F. Álvarez-Sánchez y M. Orozco-Almanza. 2005. Uso del efecto de borde de la vegetación para la restauración ecológica del bosque tropical. Revista Especializada en Ciencias Químico-Biológicas 8(2): 91-98. [ Links ]
Pronatura Noreste, A.C. 2011. Identificación de áreas críticas para la provisión de servicios ambientales hidrológicos en seis APROMSAs de interés. Monterrey, N.L. 178 p. [ Links ]
Rojas-Mendoza, P. 1965. Generalidades sobre la vegetación del estado de Nuevo León y datos acerca de su flora. Tesis doctoral. Facultad de Ciencias. Universidad Nacional Autónoma de México. México, D.F., México. 227 p. [ Links ]
Rovalo-Merino, M., J. Pérez-Cantú, S. Valenzuela-Pérez y M. De la Maza-Benignos. 2013. Restauración Ecológica. In: Cantú A., C., M. Rovalo M., J. Marmolejo M., S. Ortiz H. y F. Seriñá G. (eds.). Historia Natural del Parque Nacional Cumbres de Monterrey, México . UANL-CONANP. Nicolás de los Garza, N.L., México. pp. 371-383. [ Links ]
Rzedowski, J. 1978. Vegetación de México. Editorial Limusa. México, D.F., México. 504 p. [ Links ]
Santos, T. y J. Tellería. 2006. Pérdida y fragmentación del hábitat: efecto sobre la conservación de las especies. Ecosistemas 15(2): 3-12. [ Links ]
Servicio Geológico Mexicano (SGM). 2008. Carta Geológico-Minera Monterrey G14-7 Nuevo León y Coahuila. Servicio Geológico Mexicano. Pachuca, Hgo. 1:250 000. s/p. [ Links ]
Servicio Meteorológico Nacional (SMN). 2012. Normales Climatológicas. Período 1981-2010. Estación Agua Blanca, Nuevo León. Servicio Meteorológico Nacional, Conagua. México, D.F. http://smn.cna.gob.mx/climatologia/Normales8110/NORMAL19002.TXT (26 de septiembre de 2013). [ Links ]
Servicio Meteorológico Nacional (SMN). 2013. Normales Climatológicas. Período 1981-2010. Estación Las Comitas, Nuevo León. Servicio Meteorológico Nacional. Conagua. México, D.F. http://smn.cna.gob.mx/climatologia/Normales8110/NORMAL19038.TXT (26 de septiembre de 2013). [ Links ]
Steinhardt, U., F. Herzog, A. Lausch, E. Müller and S. Lehmann. 1999. Hemeroby index for landscape monitoring and evaluation. In: Pykh, Y. A., D. E. Hyatt and R. J. Lenz (eds). Environmental Indices - System Analysis Approach. EOLSS Publishers. Oxford, UK. pp. 237-254. [ Links ]
Stoll, A. 2007. Hemerobia: una medida para evaluar el estado de conservación de comunidades vegetales nativas. Chloris Chilensis Revista chilena de flora y vegetación. http://www.chlorischile.cl/hemerobia/hemerobia.htm (13 de marzo de 2013). [ Links ]
Stoll, A. 2008. Hemerobia, un ejemplo de cálculo: el estado de conservación del bosque de pitao y coigue (Pitavio-Nothofagetum) en Quebrada Honda, Región del Maule (VII), Chile. Chloris Chilensis. Revista chilena de flora y vegetación. http://www.chlorischile.cl/hemerobia%202%20stoll/hemerobia2stoll.htm (13 de marzo de 2013). [ Links ]
Walz, U. and C. Stein. 2014. Indicators of hemeroby for the monitoring of landscapes in Germany. Journal for Nature Conservation 22 (3): 279-289. [ Links ]
Winter, S. 2012. Forest naturalness assessment as a component of biodiversity monitoring and conservation management. Forestry 85 (2): 293-304. [ Links ]
Received: June 03, 2016; Accepted: August 15, 2017
 Este es un artículo publicado en acceso abierto bajo una licencia Creative Commons
