


Serviços Personalizados
Journal
Artigo
 texto em
  Inglês (pdf)
 Artigo em XML
 Referências do artigo
 Enviar este artigo por email
Indicadores
-
 Citado por SciELO
 -
 Acessos
Links relacionados
-
 Similares em
SciELO
Similares em
SciELO
Compartilhar

 Permalink
Revista mexicana de ciencias forestales
versão impressa ISSN 2007-1132
Rev. mex. de cienc. forestales vol.8 no.43 México Set./Out. 2017
Article
Prediction of the normal diameter, height and volume from the stump diameter in tropical species
1Campo Experimental Chetumal, CIR- Sureste, INIFAP. México.
2Campo Experimental Saltillo, CIR-Noreste, INIFAP. México.
3Campo Experimental Valle de Guadiana, CIR- Norte Centro INIFAP. México.
4Campo Experimental San Martinito, CIR Golfo-Centro, INIFAP. México.
5Programa de Posgrado. Universidad Autónoma de Nuevo León. México.
In the control and supervision of forest management, the estimation of the diameter at breast height is necessary to characterize the original stand and from this estimate, the extracted volumes. When the tree no longer exists, it is not possible to know the dimension of the diameter at breast height (d), height (h) and volume (v). These variables can be estimated based on stump diameter (dt). This allometric relationship can be used to calculate the missing volumes (v). Therefore, the aim of this research was to develop predictive equations relating dt-d, dt-h and dt-v for eight tropical species (Mahogany, Red cedar, Chacah, Chechem, Ramón, Sacchacah, Chicozapote and Tzalam) of Quintana Roo, through a selective sampling and direct measurement of 1,169 pairs of dt-d data, and indirect measurement of the height (h) of trees. All possible heights and diameter categories in different growth conditions were included. By using the ordinary least squares method, a linear model was fitted, and one for predicting the nonlinear diameter at breast height and other to predict the nonlinear volume. Based on the level of significance of the model parameters, their estimates of goodness of fit, the distribution of residuals, and the predictive ability of them, it can be inferred that these are valid to predict the d, h and v as a function of dt. All models explained the data variability.
Key words: Allometry; cuts; equations; tropical species; forest management; regression
En el control y supervisión del manejo forestal para cuantificar cortas clandestinas, se requiere la estimación del diámetro normal (d) para caracterizar el arbolado original y estimar los volúmenes extraídos. Cuando el árbol ya no existe, no se tiene la medida del mismo, de la altura (h) y del volumen (v), pero es factible estimarlo en función del diámetro del tocón (dt). Esta relación alométrica se utiliza para calcular los volúmenes faltantes. El objetivo de la presente investigación fue desarrollar ecuaciones predictivas de las relaciones d-dt, h-dt y v-dt de ocho especies forestales tropicales de Quintana Roo (caoba, cedro rojo, chacáh, chechem, ramón, sacchacáh, tzalam y chicozapote), mediante un muestreo dirigido y la medición directa de 1 169 pares de datos d-dt, y la medición indirecta de la altura (h) de árboles. Se incluyeron todas las categorías diamétricas y de alturas posibles en diferentes condiciones de crecimiento. Se ajustaron modelos lineales y no lineales para predecir las variables d, h y v a partir del dt, con el método de mínimos cuadrados. El nivel de significancia de los parámetros de los modelos, sus estimadores de bondad de ajuste, la distribución de residuales, y la capacidad predictiva de los mismos indican que los modelos son válidos para predecir y explicar la variabilidad del d, h y v en función del dt.
Palabras clave: Alometría; cortas; ecuaciones; especies tropicales; manejo forestal; regresión
Introduction
In the quantification of clandestine cuttings or revisions in areas under management, knowing the normal diameter (d) and volume (v) is basic to characterize the original tree structure and from this, to estimate the extracted volumes (López et al., 2003; Pompa et al., 2011) and even the biomass or the amount of captured carbon.
This is achieved through allometric models that estimate the d as a function of the stump diameter (dt) and a volume rate that depends on the d or dt (Diéguez et al., 2003). The estimation of d as a function of dt can be done by regression processes and thus be used to calculate the volumes (Jenkins et al., 2004; Pompa et al., 2011), as Diéguez et al. (2003) did, who adjusted d and v equations for six forest species in Galicia, Spain, using linear and allometric models transformed by logarithms. The results obtained showed adequate relationships between variables, but it was the dt variable that best predicted the dependent variables indicated, in addition to the inclusion of stump height (ht), no improvement was obtained in the predictions.
Benítez et al. (2004) carried out a study in plantations of Casuarina equisetifolia L. of the province of Camagüey, Cuba. In this work a mathematical model was developed that allowed to determine the d from dt. The logarithmic equation  accurately explains 94 % of the variability of the information.
Bava and López (2006) with data of d, dt and total height (h) adjusted d predictor models in in regard to the other two variables. Given the heteroskedasticity found, the procedure was repeated with the transformed variables and they selected a logarithmic model of the form:

Where:
Log = Logarithm
d = Normal diameter
dh = Diameter at stump height
h = Total height
This model allows to determine the d of the trees that were cut from the dimensions of the stump, and can be used both to determine the original structure of the forest and for the characteristics of an already realized harvest.
Corral et al. (2007) suggest a linear adjustment for the first classes of d, due to the good results for pine species of northern Mexico with the model:
Diéguez et al. (2003), Jenkins et al. (2004) and Pompa et al. (2011) calculated the d in linear function of the dt, but did not include the ht as an explanatory variable because it considers that the dt invariably occurs at a constant ht of 0.3 m, which is not always the case, especially with trees in rugged topographies or various techniques of felling used.
The same authors indicate that the variations in ht and the dendrometric type of the first log of the tree should be considered when adjusting models of the stump to d ratio and, because of their tapering, it is necessary to test nonlinear models with ht as predictive variable. It has been shown that the truncated neophyte adequately models the stump (Díaz et al., 2007; Pompa et al., 2011), and has even been recommended for biomass estimation (Navarro et al., 2000).
To achieve this, the authors considered the stump as the portion of the tree at ground level to a height less than or equal to 1.3 m (Raile, 1977), because this section follows a dendrometric pattern of the truncated neiloid type. Since h is related to ht, that is, when the normal diameter (d) is equal to the diameter of the stump (dt), it is expected that ht = 1.3 m, whereby:

that is, empirically there is:
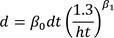
Where:
β0 and β1 = Coefficients to be determined through regression
The first parameter of the function describes the ratio of d to dt along this section of the shaft, while the latter represents the shape according to the dendrometric characteristics of the neiloid. It is expected that this model will meet the condition that dt = d when ht = 1.3, for which β0 must be close to 1.
Quiñonez et al. (2012) adjusted 12 mathematical models to predict d from dt for Pinus arizonica Engelm., P. ayacahuite Ehrenb. ex Schlitl., P. durangensis Martínez, P. leiophylla Shiede ex Schltdl. & Cham., P. teocote Shiede ex Schltdl. & Cham., and Quercus sideroxyla Humb. & Bonpl. in Durango, Mexico. For this, they used linear and nonlinear models. The adjustment of the models indicates that there is a linear trend between the variables d and h, as a function of dt; while for v the relation is logarithmic. The equations obtained can be applied in the reconstruction of scenarios after a forestry intervention or the occurrence of catastrophic natural phenomena. The equations obtained for the species are of the form:

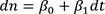
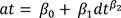
To predict height as a function of stump diameter, literature is scarce. Quiñonez et al. (2012) fitted the models recommended by Diéguez et al. (2003), Benítez et al. (2004) and Corral et al. (2007), who propose a linear or exponential relationship between the dt and the dn or v of the trees. The best results were obtained with the following expression:

Given the data distribution of the functional relationship between dt and h, it is also suggested to test a relation with a non-linear parameter with these formula:
For volume, forest engineers use the regression of the volume of the trees on their diameter, which means that by measuring the diameter (independent variable) and replacing its value in a relation defined by the tree class, the volume is obtained and even without calculations, appreciate the volume by using the graphs of the dependence function, volume = f (diameter) (Prodan et al., 1997).
For biological data such as volume, the heteroscedasticity of the residues almost always corresponds to a power ratio between the residual variance and the size of the trees. It is assumed, then, that among the explanatory variables of the weighted regression, there is one (typically the diameter of trees) such that v is a power function of such variable. Without loss of generality, it can be assumed that this variable is dt, so that:

Where:
β0 > 0
β1 ≥ 0
Consequently, the power function is of the form:

Where:
β0 = Real number, different from 0
β1 = Natural number, different from 1 (Picard et al., 2012)
This model is regularly used, known as allometric model (Prodan et al., 1997).
The aim of this work was to develop equations that describe the relationship between normal diameter (d), height (h) and volume (v) with the diameter of the stump (dt) of eight tropical forest species in Quintana Roo.
Materials and Methods
Around 20 species are commercially important in the forest harvests of Quintana Roo State; Swietenia macrophylla King (caoba), Cedrela odorata L. (cedro), Lysiloma latisiliquum (L.) Benth. B. (tzalam), Metopium brownei (Jacq.) Urban L. & N (chechem negro), Dendropanax arboreus (L.) Decne & Planch. (sacchacáh), Bursera simaruba (L.) Sarg. B. (chacáh rojo), Simarouba glauca DC. C. (negrito) and Manilkara zapota (L.) Van Royen (chicozapote) are outstanding. These species are naturally distributed in populations in the whole state, since they are more abundant at the center and south.
Based upon the former, data were taken at the Felipe Carrillo Puerto, X-Hazil, Chan Santa Cruz, Naranjal Poniente, Caobas and Bacalar ejidos, which are located there (Figure 1).
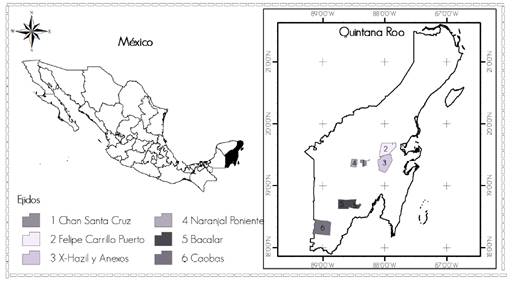
Figure 1 Geographic location of the study area for eight tropical forest species in Quintana Roo, Mexico.
A total of 1 169 pairs of dt, d and h data from trees of the eight species of commercial importance were collected by means of directed sampling and direct measurement for downed and indirect trees (relascopy) for standing trees (mahogany 137, red cedar 82, chacah 190, chechem 133, ramón 215, sacchacáh 128, tzalam 109 and chicozapote 175). All diametric categories and possible heights were included under different growing conditions.
For felled trees, the diameter with bark was measured with a Sweden Digitech Professional 80 cm Haglöf caliper at 0.30 m, 0.60 m, 0.90 m, 1.30 m and 2.5 m, then the diameter measurement was performed by sections at a variable length until reaching the tip and obtaining the total height. While for standing trees the diameter was directly measured at 0.30 m, 0.60 m, 0.90 m, 1.30 m and 2.5 m all with bark. With the Parapente Nr. 172305 Bitterlich telerelascope, diameters were taken at higher heights in sections of approximately 2.5 m in length, in tachymetric units and the height in percentage.
The volume of each section was calculated using the Smalian formula and the tip was cubed like a cone. The total volume of the tree resulted from the sum of the volume of each log and the volume of the tip, as indicated:

Where:
Vtrozas = Volume of the logs (m3)
VPunta = Volume of the tip (m3)
go = Basimetric area of the greater diameter of the log (m2)
g1 = Basimetric area of the smaller diameter of the log (m2)
gn = Basimetric area of the diameter of the tip (m2)
L = Length of the log (m)
Eleven linear and nonlinear models, which were proposed by Pompa et al. (2011), Quiñonez et al. (2012), García-Cuevas et al. (2016) and others mentioned by Prodan et al. (1997) were tested (Table 1).
Atypical data were detected in the scatter diagram of the observed data and were removed.
A PROC MODEL was used for the fit with the method of greatest verisimilitude with complete information (FIML) to produce consistent estimators (SAS, 2015). The selection of the best model was based on the goodness of fit criteria: root mean square error (RCME), level of significance of the estimators (Pr> ІtІ), adjusted coefficient of determination (R2adj), and distribution of residuals against predicted. This analysis was useful to determine if the adjustments correspond to the tendency of the data (Huang, 2002; García-Cuevas et al., 2016).
Table 1 Predictive models of normal diameter (d), total height (h) and stem volume (v) analyzed as a function of stump diameter (dt) for eight tropical forest species of Quintana Roo.

The compliance with the regression assumptions was verified with the Shapiro-Wilk (SW) test for normality, with which we tested the hypotheses H0: the observations have normal distribution; versus H1: the observations have no normal distribution, rejecting the assumption of normal distribution (p <0.05) (Balzarini et al., 2008) and graphically for the homoscedasticity of residuals (SAS, 2015).
In the adjustments it is common to find problems of heteroskedasticity, therefore, a function that weights the residual variance (Residual/((x)φ)0.5) was included (Crecente et al., 2009) by means of an exponential function according to the methodology suggested by Harvey (1976), where x is the form of the variable used and φ is derived from the linear regression of the natural logarithm (ln) of the residuals of the dependent variable as a function of the ln of x.
The equations of the best fit do not always estimate the real values with greater precision, so it must be taken into account that the regression analysis aims to develop the model that describes the population as a whole with greater fidelity (Hair et al., 1999). Therefore, the use of a theoretical measure to evaluate the regression with respect to the difference between the effective dependent variable and its predictive value (error or bias) is important and is frequently used in forest models (Gadow and Hui, 1999; Castedo and Álvarez, 2000; Diéguez et al., 2003; Corral et al., 2007)).
For the accuracy of the predictions, the average bias (Ē) was estimated, which indicates the individual deviation of the model with respect to the observed values (Diéguez et al., 2003) and. the aggregate difference (DA %), which indicates the deviation for the entire sample; the root of the mean error square (RCME); the adjusted coefficient of determination (R2adj), which reflects the total variability that is explained by the model and that take into account the total number of estimated parameters (Diéguez et al., 2003; Barrio et al., 2004; Trincado and Leal, 2006). One model will be better than another if it has a higher value of Ē, RCME and a larger value of R2adj.
Results
Tables 2, 3 and 4 combine the results obtained for the best fitted equations; only in the total height of Chacáh are two equations exhibited, since equal results were obtained in the criteria of goodness of fit.
Analysis for d-dt
For the eight species, the dispersion of observed data of d, h and v as a function of dt (Figure 2) was plotted. A linear trend was obtained for the stump diameter-normal diameter ratio.
The estimation of the parameters of the best fitted equations as well as their goodness of fit criteria for each species are shown in Table 2. A better fit was calculated with model 2 from the analyzed models, which allowed to predict the normal diameter as a function of the diameter of the stump with greater accuracy.

Figure 2 Observed and predicted data dispersion of the stump diameter-normal diameter for eight tropical forest species of Quintana Roo.
Model 1 also shows satisfactory fit, but for Chacáh, Chechem, Sacchacáh, Tzalam and Chicozapote, parameter β0 was not significant, and thus it is not advisable.
For Model 2, the root mean square error (RMSE) (RCME for its acronym in Spanish) was reduced and the parameters of the equations are significant, and therefore it is inferred that they are valid to predict d from dt (Table 2).
Table 2 Summary of the best models to predict normal diameter from the stump diameter for eight tropical forest species of Quintana Roo.

GL = Degrees of freedom; Pr>ІtІ = Level of significance for the estimated parameters; RMCE = Root mean square error; R2adj = Adjusted coefficient of determination; DW = Durbin-Watson indicator; SW = Shapiro Wilk test; Pr<W = Level of significance for the Shapiro Wilk test; Ē = Bias or mean difference; DA % = Aggregate difference.
Another important criterion for checking the goodness of fit of the models is the value of the adjusted coefficient of determination (R2adj). In this case, the highest values obtained are for model 2, which in all cases explains above 92 % the variation of the data (Table 2). Similar results were reported by Pompa et al. (2011) with the same model, with values of 0.96 for P. durangensis.
The graphical analysis of residuals for model 2 (Figure 3) does not present systematic trends indicating heterogeneity of variances (heteroskedasticity).
In order to verify compliance with the assumptions of the regression, it is inferred that there are normal errors in model 2, because the values of the Shapiro-Wilk test (SW: Normal) are close to 1 (Velazco et al., 2006). As there are sufficiently large samples, according to the central limit theorem, these samples tend to approximate to normality (Martínez-González et al., 2007).

Figure 3 Residual dispersion of model 2 to predict normal diameter as a function of stump diameter for eight tropical forest species of Quintana Roo.
In regard to precision measurements, high predictive capacity is observed according to the small mean root mean square error and mean bias values, and a high R2adj value (Table 2). Negative biases indicate in how many units the prediction is overestimated at individual tree level and positive biases, underestimation. This is above that obtained by Pompa et al. (2011) with RMSE values greater than 5.7 and greater than 2.39 for P. durangensis.
The graphical analysis of predicted values vs observed data shows that model 2 predicts with high accuracy the normal diameter as a function of the stump diameter for the eight species (Figure 2).
Analysis for h-dt
The trend of the data is concave and asymptotic for total stump-height diameter, except Sacchacáh where it is observed rather linear (Figure 4).
Table 3 shows the estimation of the parameters of the best adjusted models, as well as their goodness of fit criteria. In order to estimate height, five models were fitted, which yielded satisfactory results for Mahogany (3), Cedar (7), Chacah (3 and 9), Chechem (10), Ramón (6), Sacchacáh (3), Tzalam (7) and Chicozapote (3).
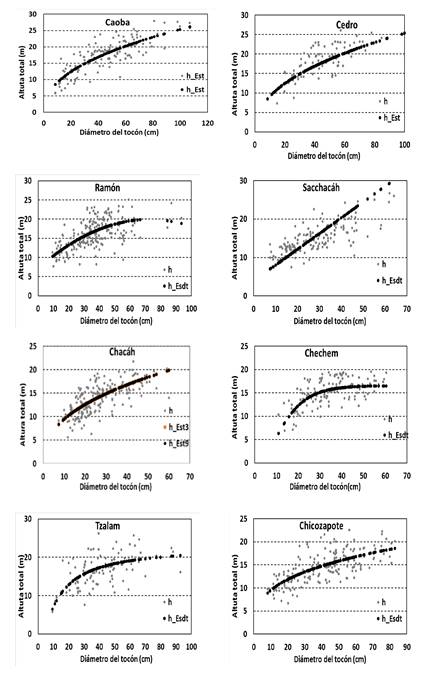
Diámetro normal = Normal diameter; Diámetro del tocón = Stump diameter =; Altura total = Total height.
Figure 4 Observed and predicted data dispersion of the stump diameter-total height for eight tropical forest species of Quintana Roo.
The coefficients of the equations had a high level of significance, so it is inferred that the equations are valid to predict total height as a function of stump diameter.
The value of the adjusted determination coefficients (R2adj) for Mahogany, Cedar, Chacáh and Sacchacáh explain between 52 and 68 % of the variation of the data and for the other species only between 37 and 45 %.
Total height as a function of stump diameter is difficult to model, as described by Diéguez et al. (2003), who faced limitations to adjust equations in Pinus pinaster Aiton, P. radiata D. Don and P. sylvestris L. in Galicia, Spain. In Mexico, Quiñonez et al. (2012) also had problems adjusting equations in P. arizonica, P. ayacahuite, P. durangensis, P. leiophylla, P. teocote and Quercus sideroxyla in Durango. For them the best model was the linear one, but with R2adj between 0.47 and 0.77, residue distributions showing heteroscedasticity, overestimation in the first height categories and one of the predicted values in some species.
Table 3 Summary of the best models to predict total height from the stump diameter for eight tropical forest species of Quintana Roo.
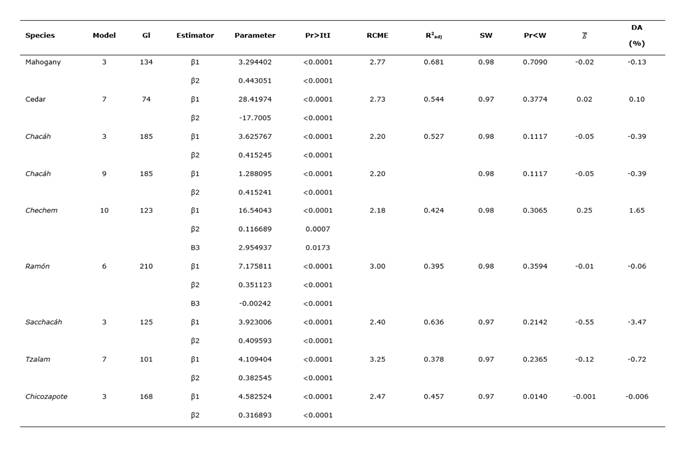
GL = Degrees of freedom; Pr>ІtІ = Level of significance for the estimated parameters; RMCE = Root mean square error; R2adj = Adjusted coefficient of determination; DW = Durbin-Watson indicator; SW = Shapiro Wilk test; Pr<W = Level of significance for the Shapiro Wilk test; Ē = Bias or mean difference; DA % = Aggregate difference.
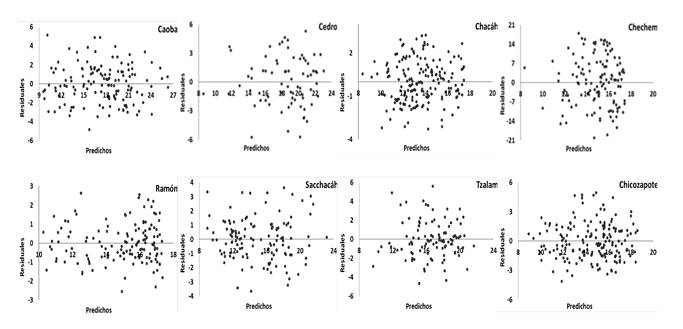
The graphical analysis of the residuals for the models (Figure 5) does not present systematic tendencies that indicate heteroscedasticity.
There is normality of errors in the Shapiro-Wilk (SW: Normal) test for Chicozapote because their values are close to 1 and with a high reliability level (Pr <DW). In Mahogany, Cedar, Chacah, Chechem, Ramón, Sacchacáh and Tzalam, reliability is not significant, but there is a sufficiently large sample and according to the central limit theorem, these samples tend to approximate to normality (Martínez-González et al., 2007).
In regard to the accuracy of the predictions, it is observed that there is good predictive capacity according to the small values of the root mean square error, bias, aggregate deviation and greater R2adj (Table 3).
The graphical analysis of the predicted values vs. the observed data shows the fidelity with which the generated equations predict the total height as a function of the diameter of the stump (Figure 4).
Anaysis for v-dt
The trend of the data is potential for stump-volume diameter, where all diametric classes for individual trees of the eight species are represented (Figure 6).

Volumen = Volume; Diámetro del tocón = Stump diameter =; Caoba =Mahogany; Cedro = Cedro
Figure 6 Observed and predicted data dispersion of the stump diameter-volume for eight tropical forest species of Quintana Roo.
The allometric model described with high level of reliability the volume as a function of the diameter of the stump (Table 4). For the eight species, the coefficients of the equations were significant. In all cases the values of R2adj were high and explained between 86 and 93 % of the variation of the observed data. The above agrees with what was obtained by Pompa et al. (2011) and Quiñonez et al. (2012), who determined for this relation coefficients of determination between 0.78 and 0.96 %.
Table 4 Summary of the best models to predict volume- stump diameter for eight tropical forest species of Quintana Roo.
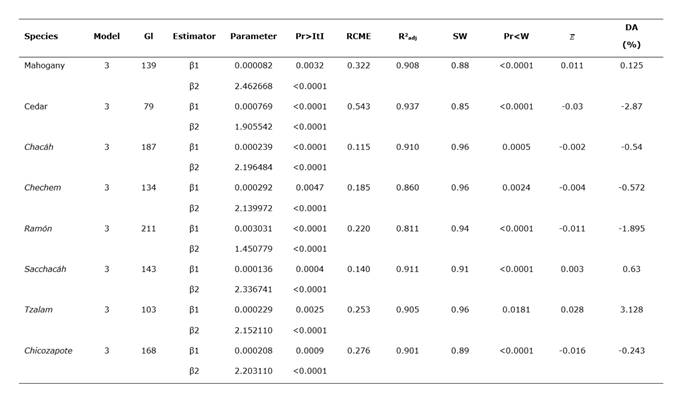
GL = Degrees of freedom; Pr>ІtІ = Level of significance for the estimated parameters; RMCE = Root mean square error; R2adj = Adjusted coefficient of determination; DW = Durbin-Watson indicator; SW = Shapiro Wilk test; Pr<W = Level of significance for the Shapiro Wilk test; Ē = Bias or mean difference; DA % = Aggregate difference.
Graphical analyzes of residuals do not present systematic trends indicating heterogeneity of variances (Figure 7).
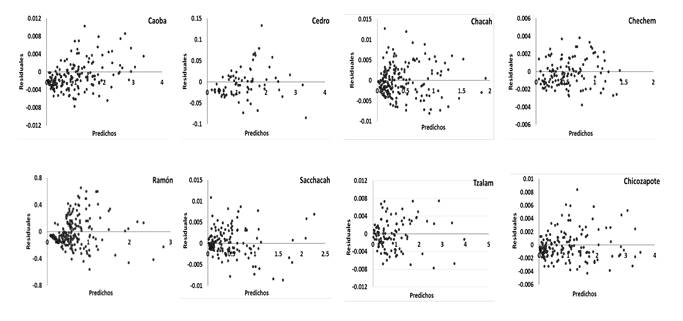
Figure 7 Residual dispersion of model 2 to predict volume as a function of stump diameter for eight tropical forest species of Quintana Roo.
It is assumed that there are normal errors in all cases, because the values of the Shapiro-Wilk (W: Normal) test are close to 1 and with a high level of reliability (Pr <DW). In addition, the central limit theorem is satisfied for large samples, since these samples tend to approximate to normality (Martínez-González et al., 2007).
The fitted equations have high predictive capacity according to the small root values of mean square error, bias, aggregate deviation and R2adj (Table 4).
Conclusions
Equations that allow to estimate normal diameter of felled trees from variables such as stump diameter and the height of the stump and for height and volume from stump diameter were obtained. The equations are reliable, they are highly accurate and practical, since the elements that must be included in them are variables easy to measure at the field.
Acknowledgements
The authors wish to thank the Gobierno del Estado de Quintana Roo for the support provided through the project “Estudios para realizar acciones de tablas de volúmenes de ocho especies forestales maderables” (SINCOPT-232179Y).
REFERENCES
Balzarini M., G., L. González, M. Tablada, F. Casanoves, J. A. Di Rienzo y C. W. Robledo. 2008. Infostat: Manual del Usuario, Editorial Brujas, Córdoba, Argentina. 336 p. [ Links ]
Barrio A., M., J. G. Álvarez G., I. J. Díaz M. y C. A. López S. 2004. Relación altura diámetro generalizada para Quercus robur L. en Galicia. Cuadernos de la Sociedad Española de Ciencias Forestales 18: 141-146. [ Links ]
Bava J., O. y P. M. López B. 2006. Predicción del diámetro a la altura de pecho en función de las dimensiones del tocón de árboles de lenga (Nothofagus pumilio) en Tierra del Fuego, Argentina. Quebracho 13:87-92. [ Links ]
Benítez N., J. Y. et al. 2004. Estimación del diámetro normal a partir del diámetro del tocón en plantaciones de Casuarina equisetifolia Forst. de la Provincia Camagüey, Cuba. Revista Chapingo: Serie Ciencias Forestales y del Ambiente 10(1): 25-30. [ Links ]
Corral R., J. J., M. Bario A., O. A. Aguirre C. and U. Diéguez A. 2007. Use of stump diameter to estimate diameter at breast height and tree volume for major pine species in El Salto, Durango (México). Forestry 80(1): 29-40. [ Links ]
Castedo, F. y J. G. Álvarez. 2000. Construcción de una tarifa de cubicación con clasificación de productos para Pinus radiata D. Don en Galicia basado en una función de perfil del tronco. Investigación Agraria. Sistemas y Recursos Forestales9(2): 253-268. [ Links ]
Crecente C., F., A. Rojo A. and U. Diéguez A. 2009. A merchantable volume system for Pinus sylvestris L. in the major mountains ranges of Spain. Annals of Forest Science 66:1-12. [ Links ]
Díaz F., R., M. Acosta M., F. Carrillo A., E. Buendía R., E. Flores A. y J. Etchevers B. 2007. Determinación de ecuaciones alométricas para estimar biomasa y carbono en Pinus patula Schl. et Cham. Madera y Bosques 13(1): 25-34. [ Links ]
Diéguez, A. U., M. Barrio A., F. Castedo D., y M. Balboa M. 2003. Estimación del diámetro normal y del volumen del tronco a partir de las dimensiones del tocón para seis especies forestales comerciales de Galicia. Investigación Agraria. Sistemas y Recursos Forestales 12(2): 131-139. [ Links ]
Gadow, K. V. and G. Hui. 1999. Modelling forest development. Kluwer Academic Publishers. Dordrecht, The Netherlands. 205 p. [ Links ]
García-Cuevas, X. et al. 2016. Ecuaciones para predecir el diámetro normal en función del diámetro del tocón para Abies religiosa (Kunth) Schltdl. et Cham. Revista Mexicana de Ciencias Forestales 7 (37): 95-103. [ Links ]
Hair, J. F., R. E. Anderson, R. L. Tatham y W C . Blach 1999. Análisis multivariante. Quinta edición. Prentice Hall Iberia. Madrid, España. 832 p. [ Links ]
Harvey, A. C. 1976. Estimating regression models with multiplicative heteroscedasticity. Econometrica 44: 461-465. [ Links ]
Huang, S. 2002. Validating and localizing growth and yield models: procedures, problems and prospects. In: Proceedings of IUFRO Workshop on Reality, Models and Parameter Estimation: the Forestry Scenario. June 2-5, 2002. Simbra, Portugal. http://rd4.dfid.gov-uk/PDF/Outputs/Forestry/R6915BTOR_Sesimbra_pdf (20 de julio de 2017). [ Links ]
Jenkins, J., D. Chojnacky, L. Heath and R. Birdsey. 2004. Comprehensive database of diameter-based biomass regressions for North American tree species. USDA. Gen. Tech. Rep. NE-319. Newtown Square, PA, USA. 45 p. [ Links ]
López S., C. A et al. 2003. A height-diameter model for Pinus radiata D. Don in Galicia (Northwest Spain). Annals of Forest Science 60:237-245. [ Links ]
Martínez-González, M. A., A. Sánchez-Villegas y J. Faulin-Fajardo. 2007. Bioestadística amigable. 2ª. Ed. Ediciones Díaz Santo. Barcelona, España. 919 p. [ Links ]
Navarro M., S. A. et al. 2000. Predicción de volúmenes de fuste para Pinus cembroides Zucc., en el Sureste de Coahuila. Foresta-AN. Nota Técnica No. 3. UAAAN. Saltillo, Coahuila. 16 p. [ Links ]
Picard N., L. Saint-Andre L. and M. Henry. 2012. Manual de construcción de ecuaciones alométricas para estimar el volumen y la biomasa de los árboles. Del trabajo de campo a la predicción. Organización de las Naciones Unidas para la Alimentación y la Agricultura y El Centre de Coopération Internationale en Recherche Agronomique pour le Développement. Rome, Montpellier, France. 223 p. [ Links ]
Picos M., J. y M. A. Cogolludo A. 2008. Apuntes de Dasometría. Escola Universitaria de Exeñería Técnica Forestal. Universidad de Vigo. Vigo, España. 191 p. [ Links ]
Pompa G., G. M. et al. 2011. Un modelo dendrométrico para estimación del diámetro normal a partir de las dimensiones del tocón. Agrociencia 45: 379-387. [ Links ]
Prodan, M., R. Peters, F. Cox y P. Real. 1997. Mensura forestal. Serie de investigación y evaluación en desarrollo sostenible. San José, Costa Rica. Instituto Interamericano de Cooperación para la Agricultura (IICA), GTZ. San José, Costa Rica 561 p. [ Links ]
Quiñonez B., G., F. Cruz C., B. Vargas L. y F. J. Hernández. 2012. Estimación del diámetro, altura y volumen a partir del tocón para especies forestales de Durango. Revista Mexicana de Ciencias Forestales 3(9): 23-39. [ Links ]
Raile, G. 1977. Estimating D.B.H. from stump dimensions. USDA For. Ser. Res. General Technical Report NC-48. Asheville, NC USA. pp: 30-33. [ Links ]
Statistical Analysis System (SAS). 2015. SAS/STAT® ver. 14.1 User’s Guide. SAS Institute Inc. Cary, NC. https://support.sas.com/documentation/onlinedoc/stat/141/nlmixed.pdf (18 de noviembre de 2016) [ Links ]
Trincado, G. y C. Leal D. 2006. Ecuaciones locales y generalizadas de altura-diámetro para pino radiata (Pinus radiata). Bosque 27(1)23-34. [ Links ]
Velazco B., E. et al. 2006. Manual para la elaboración de tablas de volumen fustal en pinos. Libro técnico Núm. 1. Instituto Nacional de Investigaciones Forestales, Agrícolas y Pecuarias. México, D. F., México. 34 p. [ Links ]
Received: February 22, 2017; Accepted: July 19, 2017
 Este es un artículo publicado en acceso abierto bajo una licencia Creative Commons
