


Services on Demand
Journal
Article
 text in
  English (pdf)
 Article in xml format
 Article references
 Send this article by e-mail
Indicators
-
 Cited by SciELO
 -
 Access statistics
Related links
-
 Similars in
SciELO
Similars in
SciELO
Share

 Permalink
Revista mexicana de ciencias forestales
Print version ISSN 2007-1132
Rev. mex. de cienc. forestales vol.8 n.42 México Jul./Aug. 2017
Articles
Soil respiration in four land use systems
1Facultad de Ciencias Forestales, Universidad Autónoma de Nuevo León, México.
2Facultad de Economía, Universidad Autónoma de Nuevo León, México.
Soil respiration (Sr), or carbon dioxide (CO2) emission, is considered to be the second most important factor in the flux of carbon. Land use change has altered the global carbon cycle; this can aggravate global warming. The objective was to evaluate CO2 efflux variation on a daily and a seasonal basis in Vertisol under four land use systems -thornscrub, grassland, agricultural and Eucalyptus spp. plantation-, through weekly measurements in morning and afternoon samplings during one year, using a portable EGM-4 analyzer; the soil temperature and soil moisture were also measured. The Sr for morning was 3.21 µmol CO2 m-2 s-1 (agricultural), 3.86 µmol CO2 m-2 s-1 (plantation), 4.61 µmol CO2 m-2 s-1 (grassland) and 6.17 µmol CO2 m-2 s-1 (thornscrub); the values of the afternoon Sr increased for all land use systems. Significant differences (P≤0.05) in land use and sampling time were determined. The soil temperature ranged between 12 °C and 35.4 °C, and the soil moisture, between 6.9 % and 47 %. In Vertisols, CO2 efflux varies according their use, being higher in afternoon and in correlation with the moisture. Scrubs and grassland systems, which are more common in the northeast Mexico, showed the highest values for Sr.
Keywords: Global warming; CO2 efflux; Tamaulipas thornscrub; soil respiration; land use systems; Vertisol
La respiración del suelo (Rs) o emisión del dióxido de carbono (CO2) es considerada como el segundo flujo de carbono más importante, por su magnitud en los ecosistemas terrestres. El cambio de uso de suelo ha modificado el ciclo global del carbono, lo que puede agudizar el calentamiento global. El objetivo del estudio fue evaluar las variaciones diurnas y estacionales en el flujo de CO2 en Vertisoles bajo cuatro sistemas de uso de suelo en el noreste de México; matorral, pastizal, agrícola y plantación de Eucalyptus spp. Se realizaron mediciones semanales durante un año, en muestreos de mañana y tarde, con un analizador portátil EGM-4; además, y se midieron la temperatura del suelo y su humedad. La Rs por la mañana fue de 3.21 µmol CO2 m-2 s-1 (agrícola), 3.86 µmol CO2 m-2 s-1 (plantación), 4.61 µmol CO2 m-2 s-1 (pastizal) y 6.17 µmol CO2 m-2 s-1 (matorral), los valores se incrementaron con la misma tendencia para la Rs de la tarde. Se determinaron diferencias significativas (P≤0.05) en los usos de suelo y hora de muestreo. La temperatura osciló de 12 °C a 35.4 °C y la humedad del suelo en valores de 6.9 % a 47 %. En Vertisoles, las emisiones de CO2 varían según su uso, los más altos se presentan en la tarde y correlacionado con la humedad. Los sistemas de matorral y pastizal presentaron los valores más altos en la Rs, los cuales son más comunes en el noreste de México.
Palabras claves: Calentamiento global; flujo de CO2; Matorral Espinoso Tamaulipeco; respiración de suelo; sistemas de uso de suelo; Vertisol
Introduction
Soil respiration (Sr), or CO2 efflux, is an important component of the carbon cycle and is considered the second largest flow of carbon between the soil and the atmosphere (Cantú et al., 2010; Srivastava et al., 2012). CO2 soil production is a result of biological processes (Moitinho et al., 2015), such as the respiration of roots and soil organisms, as well as of the decomposition of organic matter (Millard et al., 2008) and, to a lesser extent, of the chemical oxidation of carbon compounds (Lloyd and Taylor, 1994). The speed at which soil carbon is emitted in the form of CO2 determines the net flow between the soil and the atmosphere (Schwendenmann et al., 2007). Small changes in the respiration of the soil affect the global dynamics of carbon (Wei et al., 2014).
The soils are the largest carbon reservoir (1500 PgC) (Lal, 2008), since they store 80 % of the global terrestrial carbon (Nielsen et al., 2011), and can act as a source or sink of the atmospheric CO2 and influence the global climate change processes (Goudde et al., 2016). The carbon stored in the soils is a major component, as the carbon content of these is higher than that of the atmosphere and biosphere (Mishra et al., 2009). The overall rate of carbon efflux from the ecosystems to the atmosphere is approximately 75 to 100 PgC yr-1, which is 10 times more than the amount emitted by fossil fuels (Buczko et al., 2015).
The main factors that regulate soil the respiration of the soil are its temperature and humidity (Davidson et al., 1998), the precipitation (Hussain et al., 2011) and the type of vegetation (Scholze et al., 2003); these are of interest due to their effect on the increases in soil respiration, given the uncertain global climate change scenario.
Carbon emissions resulting from changes in land use represent the second largest anthropogenic source of carbon dioxide efflux into the atmosphere and are the component with the highest level of uncertainty in the global carbon cycle (Scharlemann et al., 2014), as they lead to loss of soil carbon (Smith et al., 2016).
Soils occupy 8.3 % of the national territory, are considered to be the most productive in the country (Torres et al., 2016). In northeastern Mexico, their surface holds agricultural or livestock production activities and supports the native vegetation of regional economic importance (Llorente, 2004). The name Vertisol comes from the Latin vertere (turn), which refers to the constant internal recycling of soil material (IUSS, 2007); these are clay soils that tend to clump together easily when moist (Ghosh et al., 2011).
The objectives of this study were to evaluate the diurnal and seasonal variations of CO2 efflux in a Vertisol under four land use systems in northeastern Mexico and their relationship with the environmental variables, in order to compare the emission of CO2 in the various land use systems.
Materials and Methods
Study area
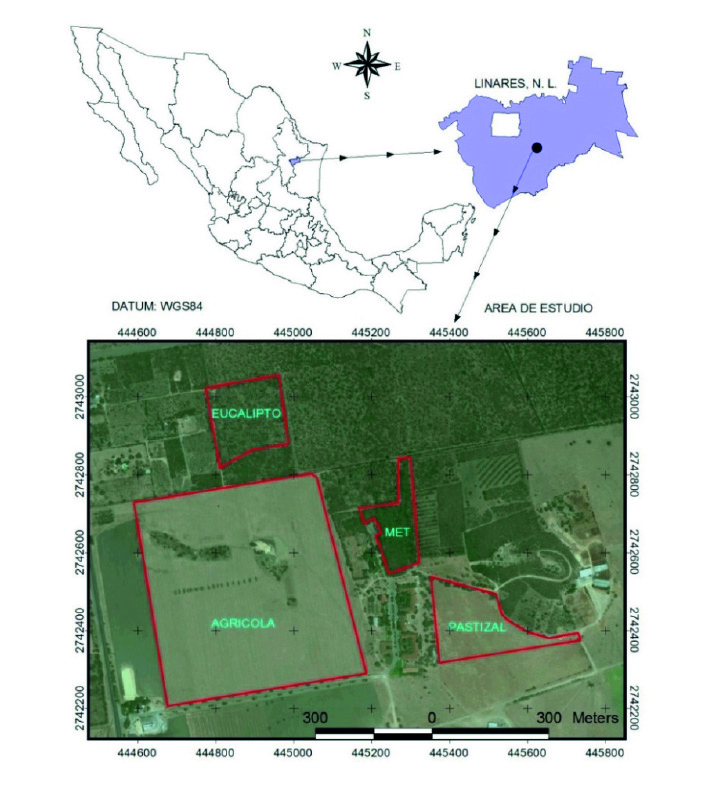
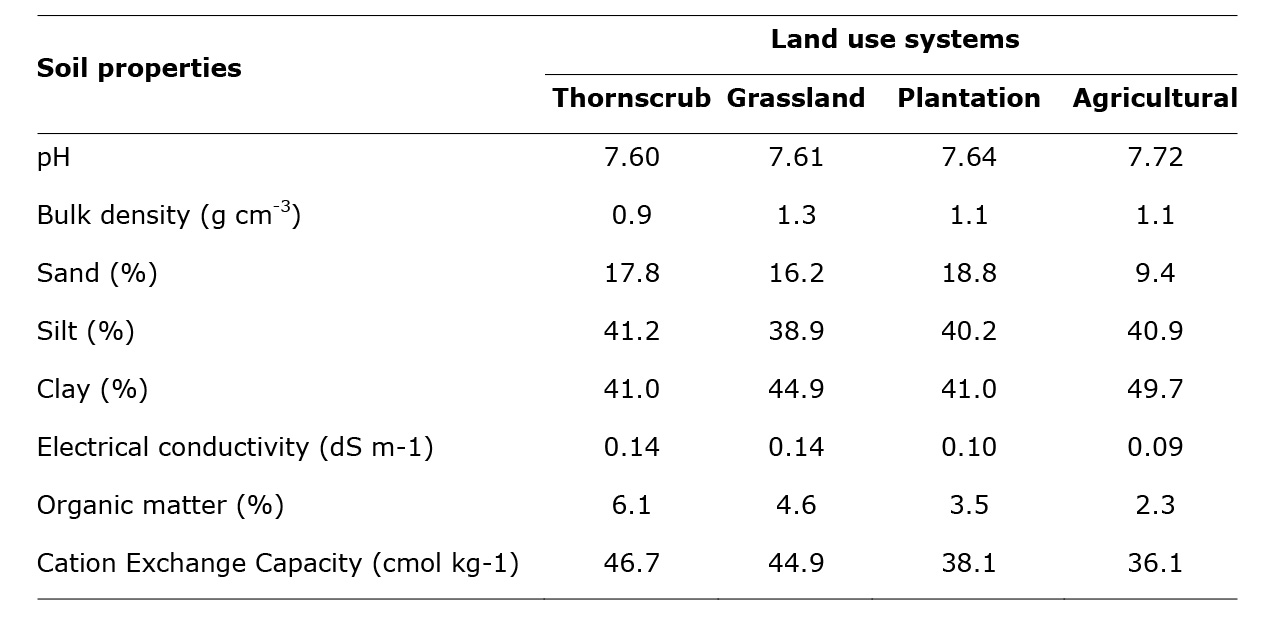
The research was conducted in the municipality of Linares, Nuevo León, in northeastern Mexico, on the campus of the Faculty of Forest Sciences at the Autonomous University of Nuevo León (Universidad Autónoma de Nuevo León), which is located at the coordinates 24°47'51.22'' N and 99°32'29.71'' W, at an altitude of 380 m (Figure 1). The climate is tropical and semi-arid with a warm summer and an average monthly temperature ranging from 14.7 °C in January to 22.3°C in August. The average annual precipitation is 805 mm, with a bimodal distribution (González et al., 2010). The predominant soil type is Vertisol, which is characterized by its depth, its dark-gray color, its fine clayey-loamy texture and its high content of montmorillonite, which contracts and expands notably in response to changes in the moisture content of the soil (Woerner, 1991). Table 1 shows some of the physical and chemical characteristics of Vertisol for a depth of 0-30 cm in each of the land use systems.
Experimental plots
Four land use systems were located: 1) Tamaulipas thornscrub (MET), which corresponds to the native arboreal vegetation, characterized by the predominance of thorny species --Celtis pallida Torr., Acacia rigidula Benth., Randia aculeata L., Condalia lycioides (A.Gray) Weberb., C. obovata Hook., Bernardia myricaefolia Benth. & Hook.f., Forestiera angustifolia Torr., and Karwinskia humboldtiana (Schult.) Zucc., among others (Inegi, 2009) --; 2) grassland area, integrated by an intensive livestock system and rotation of paddocks with Dichanthium annulatum (Forssk.) Stapf; 3) agricultural area, crop rotation, planting Sorghum bicolor (L.) Moench. and Triticum spp., under a system of zero tillage with criteria of sustainable production; and 4) eucalyptus plantation, composed of Eucalyptus camaldulensis Dehnh. and E. microtheca F.Muell., established in 1983 for research purposes and initially planted under a Taungya system (Cantú et al., 2010).
Measurements of CO 2 efflux, temperature and soil moisture
Soil respiration was determined in situ, using the Parkinson closed dynamic chamber (1981), with a portable EGM-4 analyzer. This system is equipped with a non-dispersive infrared gas (IRGA) and a soil respiration chamber (SCR-1) to measure the CO2 efflux (EGM-4 PP Systems, Massachusetts, USA). Weekly measurements were taken from March 13, 2015, to March 07, 2016, twice a day (at 8:00 and 14:00 h, i.e. morning and afternoon). Readings were carried out for each system, with four random repetitions at a minimum distance of 5 m between them for the grassland, thornscrub and plantation systems, while on the agricultural area a total of 32 measurements were taken per date between rows of plants. The camera was placed directly on the ground, and the duration of the measurements was approximately 120 seconds, depending on the rate of increase of the CO2 concentrations in the chamber.
The flow of CO2 was estimated in micromoles of carbon dioxide per square meter per second (µmol CO2 m-2 s-1). The soil temperature was measured in conjunction with the breathing, by means of a sensor (STP-1) built into the soil respiration chamber. The moisture content was determined through gravimetry using the NOM-021 RECNAT-2000 AS-5 method (Semarnat, 2002) at a depth of 0-15 cm.
Environmental Conditions
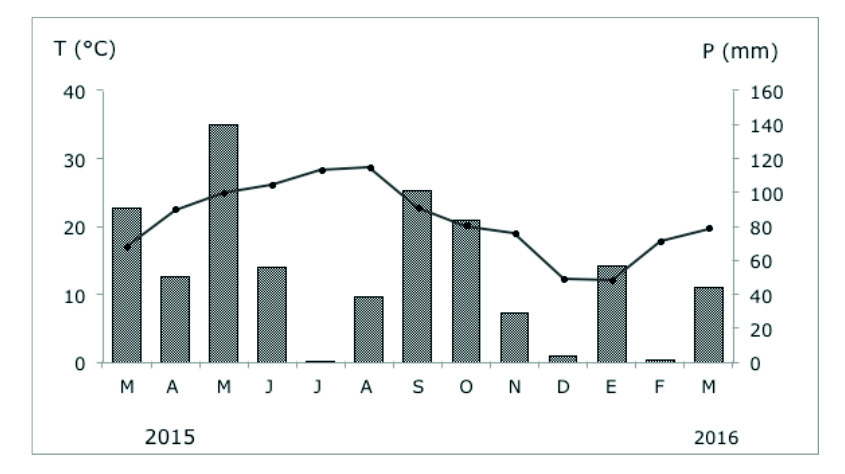
The precipitation (mm) and the air temperature (°C) were registered daily using a portable DAVIS VANTAGE PRO2 PLUS Precision Weather Station (PWS) located at a distance of 100 m from the study area (Figure 2). During the experimental period, a total precipitation of 695 mm occurred, and the temperature ranged between 6.6 °C (in January 2016) and 36.5 °C (in August 2015).
Statistical Analyses
The variance analysis was utilized to assess the effect on the CO2 flows by land use (U factor) and sampling time (T factor), and also according to their interaction (U*T) for each date and for all the observations. The CO2 efflux data were subjected to a logarithmic transformation in order to meet the normality assumptions and variance homogeneity. A Tukey’s test was applied in order to establish the statistically significant differences (P≤0.05) in soil respiration between the land use systems in the morning and in the afternoon. Spearman’s correlation analysis was utilized to relate soil respiration to the environmental variables, which did not meet the normality assumptions. All the statistical analyses were carried out with the Statistical Package for Social Sciences (SPSS) for Windows, standard version 13.0 (SPSS Inc., Chicago, IL).
Results and Discussion
The total CO2 efflux interval ranged between 0.06 and 48.7 µmol CO2 m-2 s-1. According to the variance analysis, differences (P≤0.05) were found in the soil respiration, temperature and soil moisture for the land use factor (UF); there were no differences in soil moisture for the sampling time factor (TF), and no significant differences were found in any of the studied variables for the UF*TF interaction (Table 2). The Sr is highest in the morning samplings carried out in the thornscrub (6.17 µmol CO2 m-2 s-1) and differs from that of the other land uses, followed by the grassland (4.61 µmol CO2 m-2 s-1), the plantation (3.86 µmol CO2 m-2 s-1) and the agricultural area (3.21 µmol CO2 m-2 s-1). The values increased to 4.23, 4.33, 5.93 and 8.40 µmol CO2m-2s-1, respectively, for the afternoon measurements. A thronscrub>grassland>plantation>agricultural area behavior was observed both in the morning and in the afternoon.
Table 2 Variance analysis of soil respiration, moisture and temperature for the model with two classification criteria (land use and sampling time) and Levene contrast.
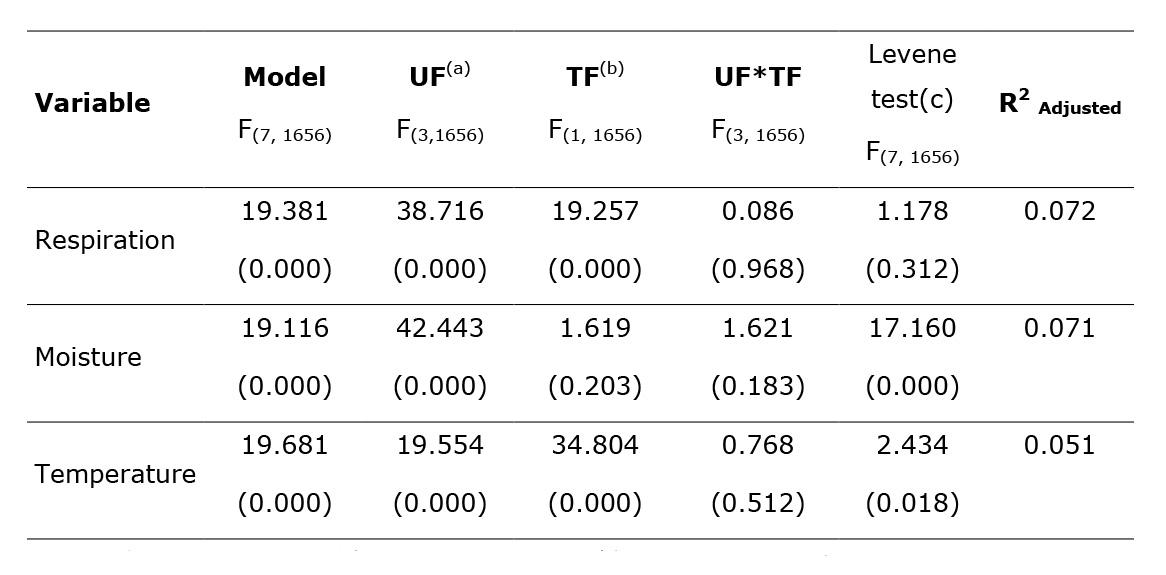
UF(a) = Land use; TF(b) = sampling time; (c) = Contrasting the null hypothesis of variance homogeneity.
Values between parentheses show the p value (P≤0.05).
Tukey’s test (P≤0.05) evidenced statistically significant differences in the Sr (P≤0.05) for the morning and afternoon samplings between the various land use systems (Figure 3). No differences were found between the thronscrub and the plantation in either sampling schedule. Thus, while the agricultural system has the lowest levels of CO2 emission, it is not statistically different from the emissions of the eucalyptus plantations. Schwendenmann et al. (2007) cite no differences in the Sr between a forest and a grassland, with values of 5.7 and 5.2 µmol CO2 m-2 s-1, respectively, and they ascribe the high production of underground biomass to the grassland.
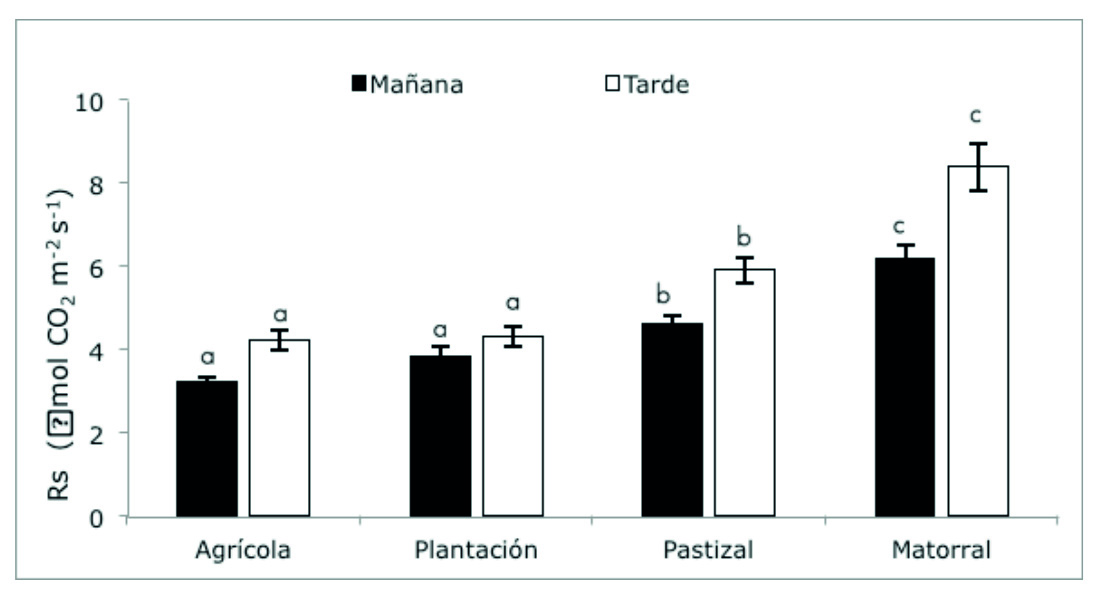
Bars with different letters at the same sampling time differ significantly at P≤0.05.
Figure 3 Mean (n=52) soil respiration values (µmol CO2 m-2s-1) in the morning and in the afternoon in the four land uses with standard error bars.
The values of the Sr were observed to be higher in the measurements taken in the months of April and May, and in September and October; in these, the thornscrub reached a maximum with 37 μmol de CO2 m 2 s-1, on May 18, 2015, unlike in July-August and December-February, when the soil respiration was less than 10 μmol de CO2 m-2 s-1. These results show the variability of the Sr throughout a year (Figures 4 and 5), which indicates that different levels of CO2 emissions can be found in the same soil type according to the use of the land and is influenced by the interaction of the soil moisture. Vallejo et al. (2005) point out that the changes in the land use and management indicate changes in the carbon contents that are consistent with the organic matter contents registered in the present study. The same tendency to an increase in soil respiration with larger amounts of organic matter is observed for the various land uses. According to Vásquez et al. (2013), low contents of organic matter reflect a reduced microbial activity, resulting in a lower CO2 emission. On their part, Scharlemann et al. (2014) report losses of 25 to 50 % organic carbon due to disturbances that alter the physical-chemical characteristics of the soils and thus modify the carbon reserves (Weissert et al., 2016).
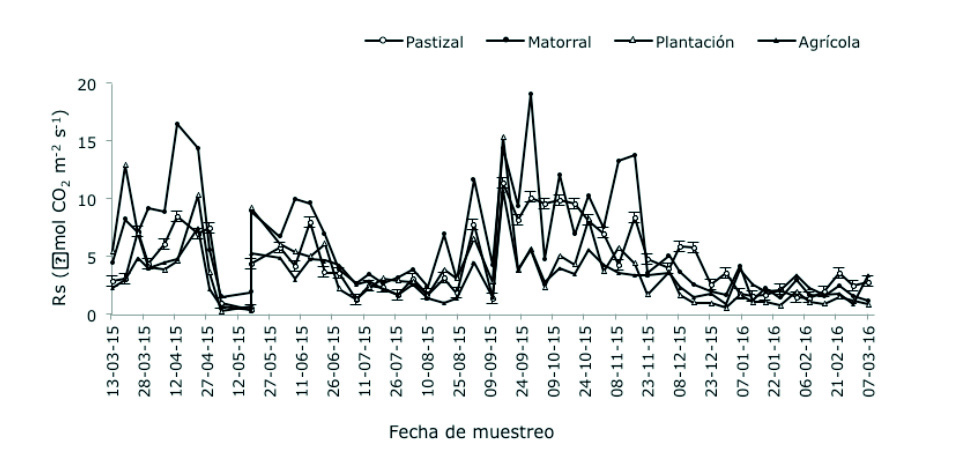
Figure 4 CO2 efflux (µmol CO2 m-2 s-1) in the morning samples during the study period for the four land uses.
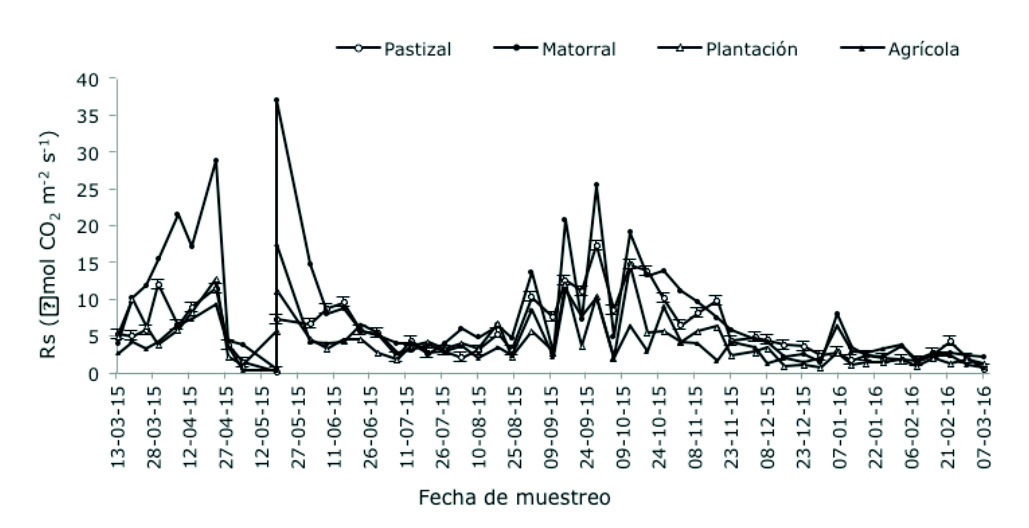
Figure 5 CO2 efflux (µmol CO2 m-2 s-1) in the afternoon samples during the study period for the four land uses.
Cantú et al. (2010) assessed the CO2 flows in 2001 under similar conditions in five land use systems for Vertisol. The morning Sr rate ranged between 0.7 and 8.4 µmol CO2 m-2 s-1, and the afternoon rate, between 0.6 and 14.4 µmol CO2 m-2 s-1. These results are consistent with the fact that the agricultural area had the lowest CO2 efflux (1.9 and 2.5 µmol CO2 m-2 s-1 in the morning and in the afternoon, respectively). Nevertheless, they differ in that the grassland had the highest emission (3.5 µmol CO2 m-2 s-1 in the morning, and 5 in the afternoon).
Table 3 summarizes the results of the two-way variance analysis of the Sr by sampling site for the land use (UF) and the sampling time (TF) factors and their interaction (UF*TF). Based on the 52 samples that were carried out, significant differences (P≤0.05) were determined in the soil respiration on 41 dates by land use; differences (P≤0.05) were found on 18 dates between the morning and the afternoon Sr. As for the UF*TF interaction, significant differences (P≤0.05) occurred in 13 of the 52 samplings.
Table 3 ANOVA of soil respiration by land use (U), sampling time (T) and their interaction by sampling date.

Relationships between the Sr and environmental variables
The relationship between the morning and afternoon Sr rates and the environmental variables soil temperature, soil moisture, relative air moisture, maximum and minimum ambient air temperatures, and monthly precipitation for each land use system was determined based on Spearman’s correlation (P≤0.05) (Table 4). No correlation was observed between Sr and the soil temperature for the morning samplings in the grassland and agricultural systems, or in the afternoon samplings for the agricultural area. These observations may respond to the fact that the vegetal cover moderates the microclimate conditions by maintaining the soil moisture (Gomes et al., 2016). The soil temperature interval ranged between 12.3 °C (thronscrub) and 33.1 °C (plantation) for measurements taken in the morning, and between 13.7 °C (thornscrub) and 35.4 °C (plantation) for those taken in the afternoon (Figure 6). There is little temperature variation between the land use systems to indicate a clear tendency in regard to Sr. Studies prove that temperature is an important factor because of its effect on the soil biota (Iglesias et al., 2010).
Table 4 Spearman’s correlation coefficient, Rho values for the soil respiration in the morning and afternoon samplings, according to the various land uses and environmental variables (n=52).
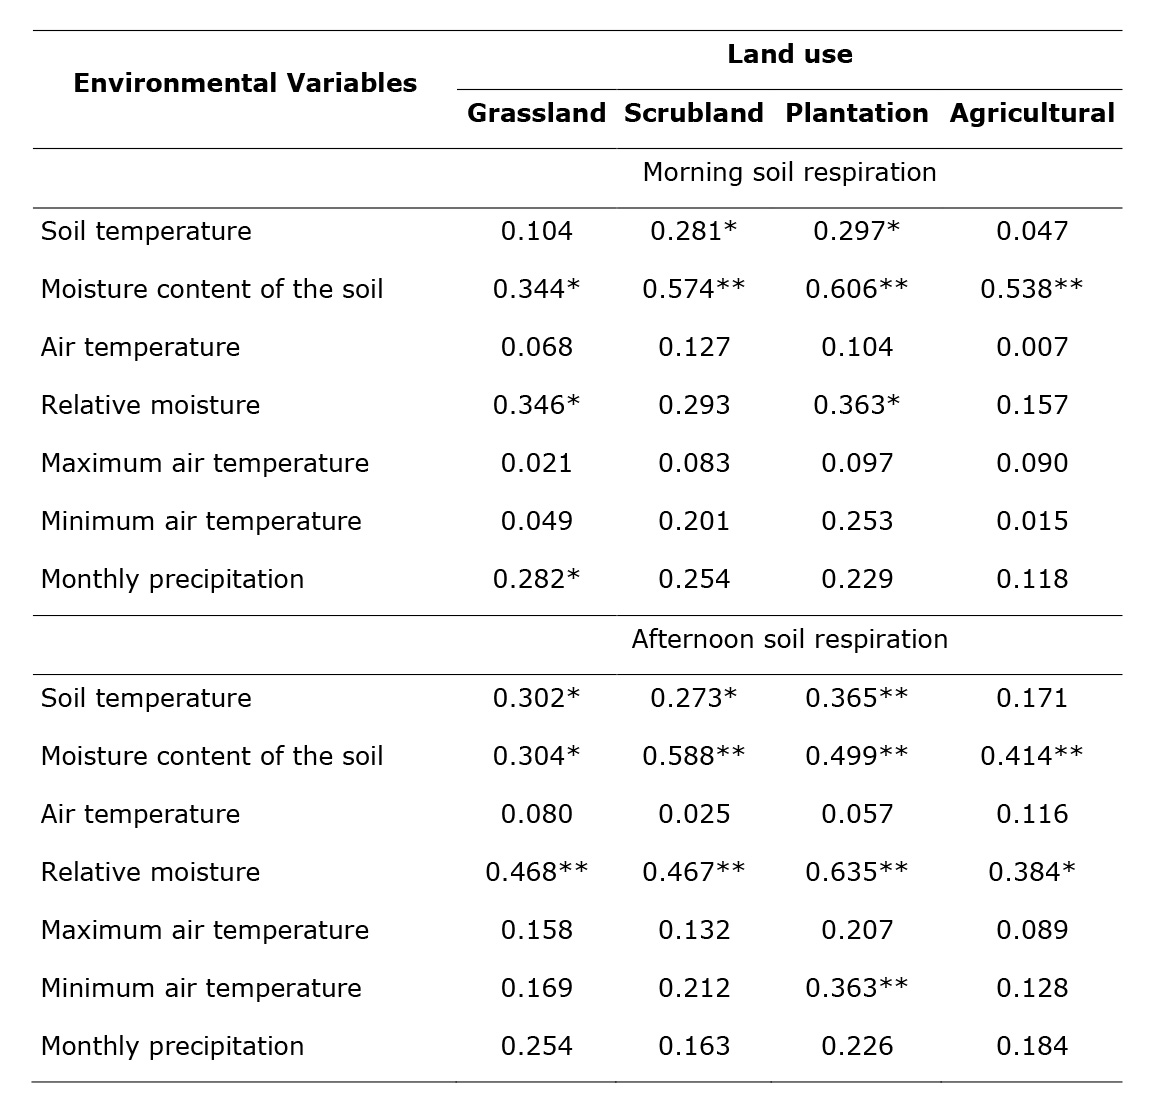
* Indicates that there is a significant difference (P≤0.05) and that a correlation between the variables exists; * * Indicate that there is a significant difference (P≤0.01) and that a correlation between the variables exists.
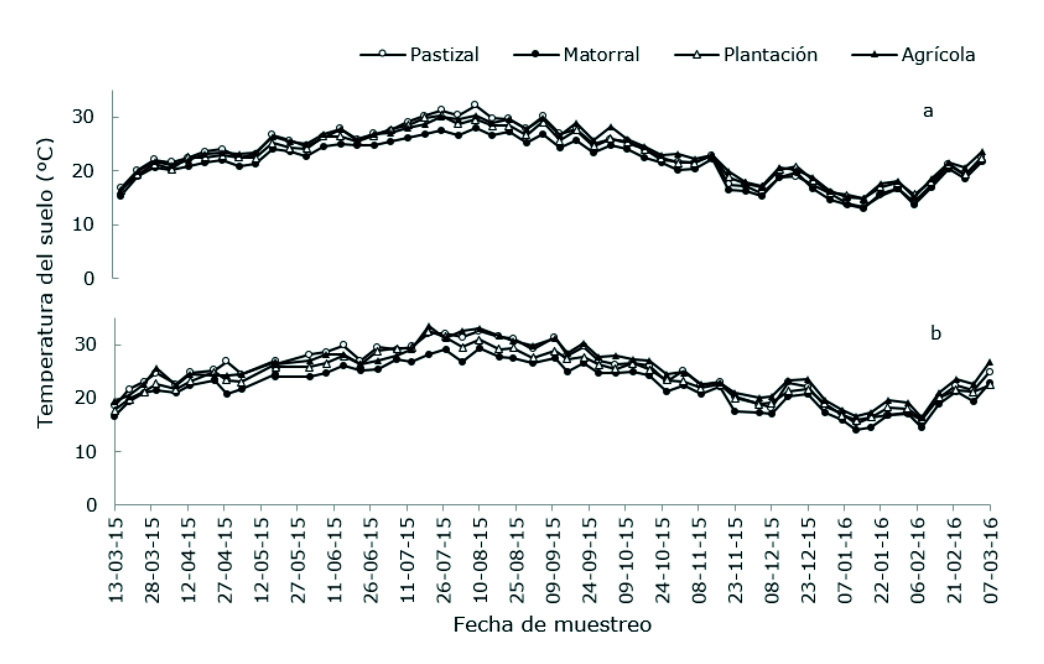
Figure 6 Soil temperature (°C) for the four land uses in the morning (a) and afternoon (b) samplings carried out during the study period.
A high, positive correlation was estimated for the soil moisture variable in all the systems in both the morning and afternoon measurements. The average soil moisture content was 18.9, 21.1, 21.5 and 23.7 % for plantation, grassland, thornscrub and agricultural area, respectively, in the morning samplings, and 18.7, 20.9, 21.6 and 22.6 % in the afternoon samplings (Figure 7). In this respect, according to Millard et al. (2008), the overall respiration rate decreases is limited in sites with 5 to 12 % moisture contents; on the other hand, Rosík et al. (2013) register a soil moisture threshold of 12 to 19 % when the CO2 begins to dissociate from the changes in temperature. Furthermore, Cantú et al. (2010) point out that it is important to research the CO2 efflux for Vertisols with gravimetric contents below 15 % due to the cracks in the structure of Vertisols, which cause measurement errors. In this regard, a notable reduction of the Sr to values under 5 µmol CO2 m-2 s-1 was observed with moisture contents below 15 %. Srivastava et al. (2012) prove that the factors that most influence the CO2 efflux are the soil moisture and the soil temperature.
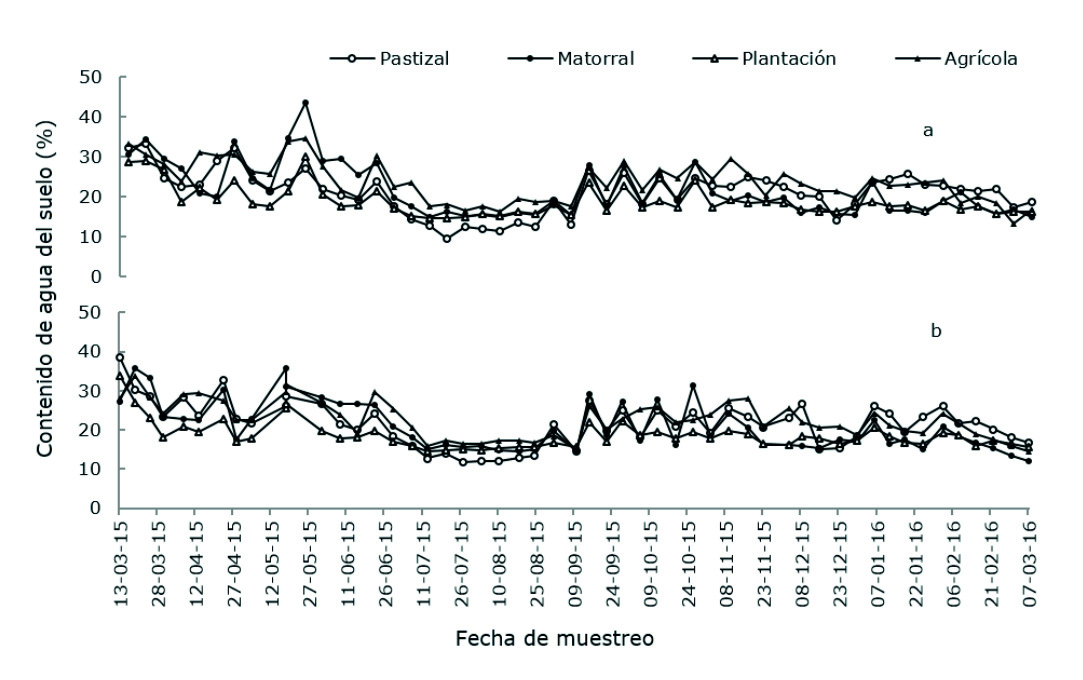
Figure 7 Water content of the soil (°C) in the morning (a) and afternoon (b) samplings during the study period for the four land uses.
In this study, the soil moisture was observed to be the variable with the highest correlation with CO2 efflux for both the morning and the afternoon samplings, since soil respiration increases with higher moisture contents in response to the microbial activity of the soil (Davidson et al., 2006). Likewise, the changes in cover in the various land use systems regulate the soil temperature and moisture; these changes in the vegetation have an impact on the CO2 exchange (Scholze et al., 2003), particularly in dry regions, where moisture is the most limiting factor for the activity of desert organisms (Bowling et al., 2011). According to Riveros-Iregui et al. (2007), the moisture content is the factor that controls soil respiration because it inhibits the diffusion of CO2.
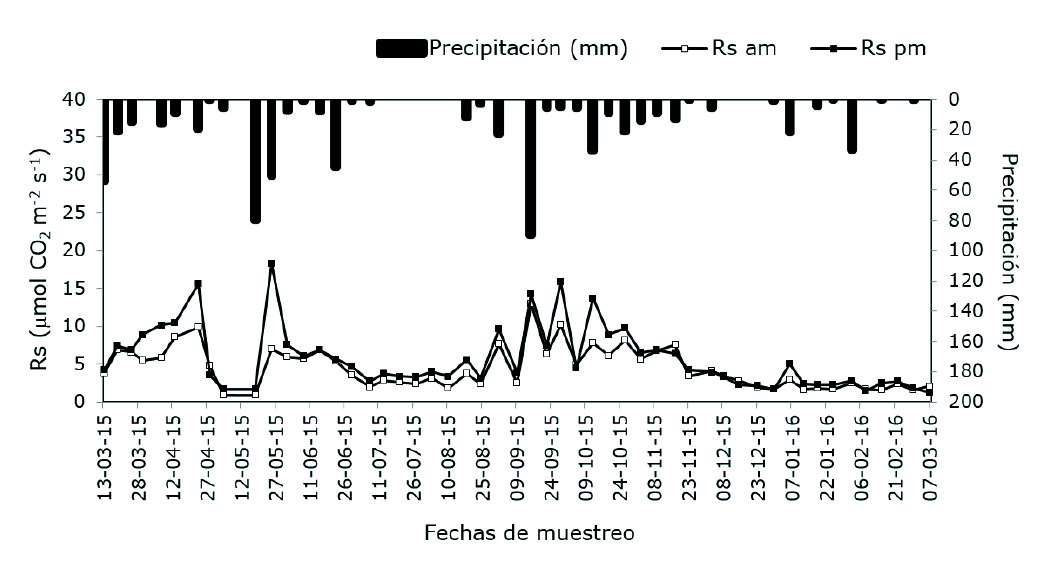
As for precipitation, the Sr was correlated with the data for rainfall at the time when the measurements were taken; therefore, correlation with the Sr was obtained only for mornings in the grassland. However, it is a major factor, given the variation in precipitations forecasted by climate change projections (IPCC, 2007). Various studies have demonstrated that the dynamics of precipitation and the availability of water in the soils will affect the global carbon balance (Hussain et al., 2011). Campos (2014) points out that global warming may have a negative effect on the water availability of the soil and thereby reduce soil respiration. This tendency of the Sr to augment with increased precipitation results from the fact that the amount of water that enters the porous space of the soil eliminates the edaphic CO2 (Moitinho et al., 2015), as shown in Figure 8, where a rising tendency of soil respiration is observed after rainfall both in the morning and in the afternoon, as a result of a phenomenon known as the Birch effect (Johnson et al., 2013).
Conclusions
Analyses of Vertisol under four land use systems show differences in soil respiration. Thornscrub is the system with the highest CO2 emission, followed by the grassland; these two are the most common land uses in northeastern Mexico. The agricultural area and Eucalyptus plantation are the systems with the lowest CO2 emission. There is a high, positive correlation between Sr and soil moisture in all land use systems, while no relation is found between soil temperature and Sr in the agricultural or grassland systems. Likewise, soil respiration rates vary considerably at the daily and seasonal scales: the highest is for the afternoon in autumn and in spring, when the precipitation is heaviest. CO2 flows follow this order: thornscrub>grassland>plantation>agricultural. Semi-arid regions are sensitive to the variability of precipitation. Thus, increased CO2 emission in Vertisols in response to environmental changes may have implications on the global carbon balance.
Acknowledgments
The authors wish to express our gratitude to the Faculty of Forestry and the Agriculture and Livestock Research Center of the Autonomous University of Nuevo León (Universidad Autónoma de Nuevo León) for the facilities provided for the development of this research; to the PAICYT CT263-15 research project, to the Conacyt project Fondo Ciencia Básica SEP-CONACYT, 250732(Basic Science Fund SEP-CONACYT, 250732), and to Joel Bravo, Eng., for his support in the collection of climate data.
REFERENCES
Bowling, D. R., E. E. Grote and J. Belnap. 2011. Rain pulse response of soil CO2 exchange by biological soil crusts and grasslands of the semiarid Colorado Plateau, United States. Journal of Geophysical Research 116 (3): 1-17. [ Links ]
Buczko, U., S. Bachmann, M. Gropp, G. Jurasinski and S. Glatzel. 2015. Spatial variability at different scales and sampling requirements for in situ soil CO2 efflux measurements on an arable soil. Catena 131: 46-55. [ Links ]
Campos C., A. 2014. Trends in soil respiration on the eastern slope of the Cofre de Perote Volcano (Mexico). Catena 114: 59-66. [ Links ]
Cantú S., I., H. González R. and M. V. Gómez M. 2010 CO2 efflux in Vertisol under different land use systems. Tropical and Subtropical Agroecosystems 12: 389-403. [ Links ]
Davidson, E. A., E. Belk and R. D. Boone. 1998. Soil water content and temperature as independent or confounded factors controlling soil respiration in a temperate mixed hardwood forest. Global Change Biology 4 (2): 217-227. [ Links ]
Davidson, E. A ., I. A. Janssens and Y. Lou. 2006. On the variability of respiration in terrestrial ecosystems: Moving beyond Q10. Global Change Biology 12 (2): 154-164. [ Links ]
Ghosh, S., P. Lockwood, H. Daniel, N. Hulugalle, K. King and P. Kristiansen. 2011. Changes in Vertisol properties as affected by organic amendments application rates. Soil Use and Management 27: 195-204. [ Links ]
Gomes, L. de C. et al. 2016. Trees modify the dynamics of soil CO2 efflux in coffee agroforestry systems. Agricultural and Forest Meteorology 224: 30-39. [ Links ]
González R., H. et al. 2010. Composción y estructura de la vegetación en tres sitios del estado de Nuevo león, México. Polibotánica 29: 91-106. [ Links ]
Goudde, C. M., P. J. Thorburn, J. S. Biggs and E. A. Meier. 2016. Understanding the impacts of soil, climate, and farming practices on soil organic carbon sequestration: A simulation study on Australia. Frontiers in Plant Science 7(661): 1-15. [ Links ]
Hussain, M. Z. et al. 2011. Summer drought influence on CO2 and water fluxes of extensively managed grassland in Germany. Agriculture, Ecosystems and Environment 141 (1-2): 67-76. [ Links ]
Iglesias, B., M. J., M. H. Garnett and P. Ineson. 2010. Soil biology and warming play a key role in the release of old C from organic soils. Soil Biology and Biochemistry 42: 960-967. [ Links ]
Instituto Nacional de Estadística y Geografía (Inegi). 2009. Guía para la interpretación de cartografía uso del suelo y vegetación Escala 1:250000 Serie III. Instituto Nacional de Estadística y Geografía. México, D.F., México. 74 p. [ Links ]
Grupo Intergubernamental de Expertos sobre el Cambio Climático (IPCC). 2007. Cambio climático 2007: Informe de síntesis. Contribución de los grupos de trabajo I, II y III al cuarto informe de evaluación del Grupo Intergubernamental de Expertos sobre el Cambio Climático. IPCC. Ginebra, Suiza. 104 p. [ Links ]
Unión Internacional de Ciencias del Suelo (IUSS). 2007. Base Referencial Mundial del Recurso Suelo. Primera actualización 2007. Informes sobre Recursos Mundiales de Suelos No. 103. IUSS, Grupo de Trabajo WRB. FAO. Roma, Italia. 117 p. [ Links ]
Johnson, M. S. et al. 2013. Soil CO2 dynamics in a tree island soil of the pantanal: The role of soil water potential. PLoS ONE 8 (6): 1-14. [ Links ]
Lal, R. 2008. Carbon sequestration. Philosophical Transactions of the Royal Society B. 363 (1492): 815-830. [ Links ]
Llorente, M. 2004. Caracterización física y química de Vertisoles del noreste de México sometidos a distintas formas de manejo. Tesis de maestría. Facultad de Ciencias Forestales, Universidad Autónoma de Nuevo León. Linares, N. L., México. 98 p. [ Links ]
Lloyd, J. and J. A. Taylor. 1994. On the temperature dependence of soil respiration. Functional Ecology 8 (3): 315-323. [ Links ]
Millard, P., A. J. Midwood, J. E. Hunt, D. Whitehead and T. W. Boutton. 2008. Partitioning soil surface CO2 efflux into autotrophic and heterotrophic components, using natural gradients in soil δ13C in an undisturbed savannah soil. Soil Biology & Biochemistry 40 (7): 1575-1582. [ Links ]
Mishra, U., R. Lal, B. Slater, F. Calhoun, D. Liu, and V. M. Meirvenne. 2009. Predicting soil organic carbon stock using profile depth distribution functions and ordinary kriging. Soil Science Society of America Journal 73(2): 614-621. [ Links ]
Moitinho, M. R. et al. 2015. On the spatial and temporal dependence of CO2 emission on soil properties in sugarcane (Saccharum spp.) production. Soil and Tillage Research 148: 127-132. [ Links ]
Nielsen, U. N., E. Ayres, D. H. Wall and R. D. Bardgett. 2011. Soil biodiversity and carbon cycling: A review and synthesis of studies examining diversity-function relationships. European Journal of Soil Science 62 (1): 105-116. [ Links ]
Riveros-Iregui, D. A. et al. 2007. Diurnal hysteresis between soil CO2 and soil temperature is controlled by soil water content. Geophysical Research Letters 34 (17): 1-5. [ Links ]
Rosík, J., T. Fabiánek and I. Marková. 2013. Soil CO2 efflux in Young norway spruce stands with different silviculture practices Acta Universitatis Agriculturae Et Silviculturae Mendelanae Brunensis 61 (6): 1845-1851. [ Links ]
Scharlemann, J. P., E. V. Tanner, R. Hiederer and V. Kapos. 2014. Global soil carbon: understanding and managing the largest terrestrial carbon pool. Carbon Management 5 (1): 81-91. [ Links ]
Scholze, M., W. Knorr and M. M. Heimann. 2003. Modelling terrestrial vegetation dynamics and carbon cycling for an abrupt climatic change event. The Holocene 13 (3): 327-333. [ Links ]
Schwendenmann, L., E. Pendall and C. Potvin. 2007. Surface soil organic carbon pools, mineralization and CO2 efflux rates under different land-use types in Central Panama. In: Tscharntke, T., C. Leuschner, M. Zeller, E. Guhardja and A. Bidin (eds.). The stability of tropical rainforest margins, linking ecological, economic and social constraints of land use and conservation. Springer. Verlag, Berlin, Germany. pp. 109-131. [ Links ]
Secretaria de Medio Ambiente y Recursos Naturales (Semarnat). 2002. NOM-021-RECNAT-2000. Norma Oficial Mexicana que establece las especificaciones de fertilidad, salinidad y clasificación de suelos. Estudios, muestreo y análisis. Secretaria de Medio Ambiente y Recursos Naturales. Segunda edición. México, D.F., México. 85 p. [ Links ]
Smith, P. et al. 2016. Global change pressures on soils from land use and management. Global Change Biology 22: 1008-1028. [ Links ]
Srivastava, M., S. D. Sharma and M. Kudrat. 2012. Effect of crop rotation, soil temperature and soil moisture on CO2 emission rate in indo-gangetic plains of India. International Journal of Agriculture and Forestry 2 (3): 117-120. [ Links ]
Torres, G. et al. 2016. Manejo agronómico de los Vertisoles en México. Terra Latinoamericana 34: 457-466. [ Links ]
Vallejo, V. R., F. Díaz F. y D. de la Rosa. 2005. 8. Impactos Sobre Los Recursos Edáficos. In: Moreno R., J. M. (coord.). Impactos del cambio climático en España. Ministerio de Medio Ambiente. Tarragona, España. pp. 355-398. [ Links ]
Vásquez, J. R., F. Macías y J. C. Menjivar. 2013. Respiración del suelo según su uso y su relación con algunas formas de carbono en el departamento del Magdalena, Colombia. Bioagro 25 (3): 175-180. [ Links ]
Wei, S. et al. 2014. Effect of soil temperature and soil moisture on CO2 flux from eroded landscape positions on black soil in Northeast China. Soil and Tillage Research 144: 119-125. [ Links ]
Weissert, L. F., J. A. Salmond and L. Schwendenmann. 2016. Variability of soil organic carbon stocks and soil CO2 efflux across urban land use and soil cover types. Geoderma 271: 80-90. [ Links ]
Woerner, M. 1991. Los suelos bajo vegetación de matorral del noreste de México, descritos a traes de ejemplos en el campus universitario de la UANL, Linares, N.L. Reporte Científico No. 22. Facultad de Ciencias Forestales, Universidad Autónoma de Nuevo León. Linares, N. L., México. 116 p. [ Links ]
Received: March 16, 2017; Accepted: July 21, 2017
 Este es un artículo publicado en acceso abierto bajo una licencia Creative Commons
