


Serviços Personalizados
Journal
Artigo
 texto em
  Inglês (pdf)
 Artigo em XML
 Referências do artigo
 Enviar este artigo por email
Indicadores
-
 Citado por SciELO
 -
 Acessos
Links relacionados
-
 Similares em
SciELO
Similares em
SciELO
Compartilhar

 Permalink
Revista mexicana de ciencias forestales
versão impressa ISSN 2007-1132
Rev. mex. de cienc. forestales vol.7 no.37 México Set./Out. 2016
Articles
Selection of outstanding mahogany (Swietenia macrophylla King.) trees in a natural stand based on multivariate methods
1Consultores para la Investigación Aplicada y el Desarrollo Forestal, S. C. México. Correo-e: bn_gutierrez@hotmail.com
2Departamento Forestal. Universidad Autónoma Agraria Antonio Narro. México.
3Campo Experimental Chetumal. Centro de Investigación Regional Sureste (CIRSE). INIFAP. México.
4Programa Forestal. Colegio de Postgraduados. Campus Montecillo. México.
5Campo Experimental Uruapan. Centro de Investigación Regional Pacífico Centro (CIRPAC). INIFAP. México.
A methodology to select phenotypically outstanding trees in a natural stand of tropical species based on multivariate methods using the technique of principal components analysis (PCA) and with support of the software System Visualization Stand (SVS) is described here. This study was conducted on a natural stand of mahogany (Swietenia macrophylla) of 50 ha, located in a semiervergreen forest. A base population of 427 mahogany trees with a normal diameter higher than 7.5 cm was defined. The method of PCA was used with data of eight variables of stem, cup and buttress. The variables stem normal diameter, total height and crown diameter, were the ones that better identified the characteristic phenotype of the selected trees in the first component, explaining 79.4 % of the total variance. The application of SVS allowed the spatial analysis of possible scenarios and the selection of 30 plus trees, when setting down as restriction a minimum distance of 70 m between selected trees. The selection differential for the characteristics of economic interest gave positive values. The normal diameter had a higher selection differential (84 %) than that of the crown diameter with 61 %. The PCA-based method proved to be effective since the plus trees selected by it were the best in the field. These results allow recommending the PCA method for selecting superior trees in a natural stand of tropical species, where conditions limit the use of classic methods of selection such as the comparative one.
Key words: Principal components analysis; plus tree; phenotype characteristics; selection differential; genetic gain; Swietenia macrophyla King
Se describe una metodología para seleccionar árboles fenotípicamente superiores en rodales naturales de especies tropicales mediante métodos multivariados, con la técnica de análisis de componentes principales (ACP) y la de agrupamiento, con apoyo del programa “Stand Visualization System” (SVS). El estudio se efectuó en un rodal de 50 ha de caoba (Swietenia macrophylla) dentro de una selva mediana subperennifolia, donde se definió una población base de 427 árboles con un diámetro normal mayor a 7.5 cm. Se utilizó el método de ACP con datos de ocho variables de estructura del árbol. Las correspondientes al diámetro normal del fuste, altura total y diámetro de copa fueron las que mejor identificaron las características fenotípicas de los ejemplares superiores en el primer componente, al explicar 79.4 % de la varianza total. La aplicación del SVS permitió el análisis espacial de escenarios posibles y finalmente la ubicación de 30 árboles sobresalientes. El diferencial de selección para las características de interés económico dio valores positivos y entre ellos destaca el diámetro normal que corresponde a 84 % de la población base, y el de copa con 61 %. El método basado en ACP resultó efectivo porque los árboles elegidos por este conducto fueron los mejores en campo, por lo que se puede recomendar dicho procedimiento para escoger a los árboles superiores en rodales naturales de especies tropicales, donde las condiciones limitan el uso de los métodos clásicos de selección como el comparativo.
Palabras clave: Análisis de componentes principales; árbol superior; características fenotípicas; diferencial de selección; ganancia genética; Swietenia macrophylla King
Introduction
Genetic tree breeding has become a significant part of intensive forest management. The first phase in a program of this type for native species is generally the selection of higher or high yielding phenotypes in natural populations (Ledig, 1974), so their identification is fundamental, since on them depends the hereditary gain that is scope.
The most important knowledge on the subject was born in the late 1950s with the genus Pinus (Zobel and Talbert, 1988), suggesting that the criteria used for pine trees do not entirely coincide with those for tropical hardwoods. Maldonado and Escobar (2000) addressed this topic in recent years, and used a subjective scoring method to choose the best specimens of Schizolobium parahyba (Vell.) S. F. Blake known as “frijolito”, in Santander, Colombia; Murillo et al. (2010) worked on forestry plantations based on the classical method of comparison (Zobel and Talbert, 1988).
However, in natural stands of tropical species it is often not feasible to apply the aforementioned procedures because they are made up of a mixture of many species, and the candidate trees are so dispersed that there are no close controls to check them. In addition, some individuals can vigorously sprout and those growing near the one of interest have a common root system and the same genotype (Zobel and Talbert, 1988).
In practice, the selection in these environments is made from different criteria (Salazar and Boshier, 1989); for example, a series of numerical degrees or values assigned to variables such as height, volume, branch size, crown width, branch angle, pruning ability (i. e., refers to lower branches drying and falling rapidly naturally) and stem shape (Brown and Goddard, 1961; Wright, 1964). This causes the breeder to choose the trees according to a subjective judgment, without the support of a statistical analysis that eliminates such condition, and that does not meet the objective of genetic improvement.
In programs of this type, it is usually desired to improve several characteristics at the same time, so that from the first phase of the process, upper trees are sought in more than one of them (Stonecypher, 1970). However, information from the first generation is often rather visual (Torres, 2000). An efficient evaluation method is the selection index, because it has the advantage of being oriented to genotypes based on multiple phenotypic elements (Zobel and Talbert, 1988). In this context, the index can be approached through the multivariate method that is based on the main component analysis (PCA), whose first main component (PC) determines the proportion and own vector of the phenotypic values under study, which contribute to the new index (Cerón and Sahagún, 2005).
The current use of the selection index through PC in forest genetic improvement is minimal, and among the few cases can be mentioned the tree seedlings of Pinus greggii Engelm. Parl for the conversion of a provenance test to a seed stand (Cornejo et al., 2009), and the transformation of a progeny test of P. greggii var. greggii Engelm. ex Parl. a seed orchard (Gutiérrez et al., 2010). There is little evidence on the particular in the Mexican tropics in natural forests, due to the limitations to the application of the classic methods of selection, by the subjectivity that can happen from the lack of statistical support.
Based on all of the above, the present study aimed to evaluate the efficacy of multivariate methods in the selection of phenotypically superior trees of Swietenia macrophylla King.
Materials and Methods
Study area
This research was carried out in a natural stand of mahogany (Swietenia macrophylla) located in the middle subperennifolia forest in Ejido X-Hazil and Annexes, Felipe Carrillo Puerto municipality, in the state of Quintana Roo, Mexico, at an altitude of 16 m. The delimitation of the area was made through paths in the perimeter of the property and access roads, to georeferentiate the vertices with a sampling error of ± 3 m. The study area is located between the coordinates 19°21’58.74” N and 88°02’58.74” W, on an area of 50 ha.
Within the study area, 30 circular sampling sites of 500 m2 (radius = 12.61 m) were systematically established, and in each one of them was determined: physical condition of the tree of diverse species; presence of mahogany specimens with a ≥ 7.5 cm normal diameter at 1.30 m above the ground; diameter and total height averages; dominant species; existence of disturbances caused by extraction activities, fires and hurricanes. In each center of the site a wooden stake with a metal plate was placed to indicate the site number and its coordinates. The identification of the trees that formed the base population (427 mahogany trees), was done by means of a reconnaissance in the stand of 50 ha, with walks in roads and paths.
The 427 trees of interest were placed individually with coordinates and were measured with the following variables: normal diameter of the stem; tree cup diameter (m), calculated as the average of the projection of it on the ground in the two most distant points and the smaller cup diameter measured perpendicular to the larger diameter; total height (m); height of clean stem (m), to the point where the crown or commercial height begins; slenderness index, calculated as the ratio of total height between height of the clean trunk; number of buttresses and their height; and phytosanitary status with a two-level visual scale, healthy or diseased.
Selection of trees
The selection of plus trees was made through multivariate analysis: principal components (PCA) and clustering. The value of each variable was standardized with the following formula:
Where:
Zij = New standardized value
Xij = Value of the i observation in the j variable
Sj = Typical or standard deviation of the values of the j variable
In order to calculate the useful variables in the selection of trees, the first step was to apply the PCA with the procedure PRINCOMP of the Statistical Analysis System (SAS, 1999) version 9.1 package. By means of an iterative process, this analysis allows to find the least number of those that integrate the first main component (PC) and that better identify the phenotype, provided that the final variance is equal to or greater than 70 % of the total variation. During this analysis, variables that do not show a high correlation within the PC are eliminated.
The above is important because the success of the selection of the appearance, expressed as advance or genetic gain, depends initially on it (Quijada, 1980). As more characteristics are considered, it will be more difficult to obtain advances in some of them individually, because each character has a different hereditary pattern; therefore, different intensities of selection are necessary, so that in choosing individuals that meet the requirements of a particular variable, another character that has included undesirable phenotypes in the first characteristic could be affected. In addition, unequal characters may be inversely correlated (White et al., 2007), so it is recommended that the number of variables to be taken into account is less than or equal to five.
The second step is to specify the candidate trees to be chosen, through the CLUSTER SAS process, which is executed with the values that the PCA has assigned to each one. To define the optimal number of groups, the Average, Twostage K = 3, Ward Pseudo, Density K = 3, Single and Centroid methods were tested. The most effective method is the one with the highest cubic grouping (CCA) values and the pseudo F statistic (which measures the separation between all sets at the current level). In order not to lose the identification of each individual, a code is assigned according to the groups generated.
It is recommended that there be three groups: one that meets the highest values of the variables that integrate the first component and that corresponds to the candidate trees; the next one containing the intermediate trees, which if necessary could be used as candidate trees; And the third includes those who record the lowest values of the variables that integrate the first component, which must be discarded and not chosen.
The final step is the location and marking of the trees, for which the Stand Visualization System (SVS) Version 3.36 program was used (McGaughey, 1997, 1999). In order to feed the program and obtain a real representation of the position and dimension of each tree within the stand, the coordinates, the normal diameter and the total height of each of the 427 were considered, which allowed to obtain a vision of the distribution pattern (Figure 1). In order to maximize the distance between the selected individuals and to avoid future problems of consanguinity, a minimum separation between trees of 70 m was established as criterion, as recommended by Bramlett et al. (1977). The SVS also allows to contemplate different scenarios when making the selection and discarding trees as the ones of interest. Thus, when some were located at a distance of less than 70 m between them, only the individuals with the best characteristics in normal diameter, total height and commercial height were taken.

Figure 1 Natural mahogany (Swietenia macrophylla King.) stand in Felipe Carrillo Puerto, Quintana Roo, Mexico (50 ha).
In selecting trees it is important to be clear that the phenotypic expression has a close relationship to the environment and the genetic component (dominance and epistasis). The factors of the first type could be very intense and in some cases even onfused with the latter (Cruz, 2005). The above causes two types of errors: a) I, when selecting individuals which are not genetically privileged; and b) II, when a program does not include individuals which are genetically higher than the population mean (Murillo et al., 2010), and also when individuals are not chosen that, despite having a smaller normal diameter, their total height reaches the upper canopy (dominant) and the quality of its stem is exceptionally good for wood production (Murillo et al., 2003).
The probability of committing the type I error can be reduced with field validation of the selected trees and the elimination of the selected ones that in the field are located in more productive areas (that lead to a more successful development compared to the rest of the trees). The probability of type II error can be reduced by incorporating some of the intermediate group as outstanding trees that were not initially classified as such due to the fact that in the field they were in limiting environmental conditions (which do not favor its fullness), but that they present good characteristics with respect to the general population.
These considerations are basic for improvement, since type I error causes an increase in undesirable materials in the base population and a decrease in the genetic progress; the type II error also causes a potential reduction in genetic gain, since high-value genotypes are not included in the population subject to manipulation.
In addition to the above, a Pearson correlation analysis was made between the variables of economic importance (total height, normal diameter, clean stem height and crown diameter), as well as the calculation of the mean and coefficient of variation (CV) Of the base population and select trees. To make an estimate of the possible advance in the next generation, similar to the selection differential (S) proposed by White et al. (2007), a comparison was made between averages of the 427 individuals and that of the 30 trees. Finally, with the value of the differential and the standard deviation of the original population, the intensity of selection (i) was calculated, according to Quijada (1980).
The expected genetic gain (GG) of the normal diameter and height of the selected trees was estimated as follows:
Where:
S = Selection differential in %,
h 2 = Heritability in the strict sense (Murillo et al., 2010)
In order to estimate the expected genetic gain, the values of heritability of 0.54 for the diameter and of 0.55 for the total height and height of the stem were calculated by Navarro and Hernández (2004).
Results and Discussion
The Principal Component Analysis showed that normal diameter, total height and crown diameter lead more accurately to the selection of major trees, representing 79.4 % of the total variance with the first main component (CP); (Table 1), and for the effects sought, they are the best because they had the highest correlation coefficients, in comparison with the other assessed variables (Table 2).
Table 1 Eigen vectors of the variables used for the selection of candidate mahogany (Swietenia macrophylla King.) trees in Felipe Carrillo Puerto, Quintana Roo State, Mexico.

Table 2 Pearson’s correlations between the variables used for the selection of candidate mahogany (Swietenia macrophylla King.) trees in Felipe Carrillo Puerto, Quintana Roo State, Mexico.

** Significant = P < 0.0001
The Ward Pseudo method was the one that best grouped the trees with the highest value of the cubic criterion of grouping (CCA = 0.5), and with that of the pseudo F that was equal to 1 156. According to the values assigned to the trees by the GPA, three groups were established. The trees in Group 1 showed average values higher than those of Groups 2 and 3, in normal diameter (77.14 vs. 51.79 and 33.32 cm), total height (19.80 vs. 17.43 and 15.86 m) and crown diameter (12.44 vs. 9.61 and 6.25 m), respectively. Thus, this set was conformed by the 34 largest individuals, candidates to be chosen as selected trees from the total of 427 evaluated in the study area.
However, when performing a spatial analysis with SVS support to see the resulting scenario with the 34 chosen trees, it was observed that when applying the criterion of a minimum distance of 70 m to avoid problems of inbreeding, the final base population would be very small and not enough to start an improvement program in this species. Therefore, it was decided to include the best trees of Group 2, in order to have a total of 46 candidates. The selection of the trees of Group 2 was made based on their superiority in total height, and to a lesser degree on their normal diameter; This is because height has a lesser effect on competition or growth environment, whereas normal diameter is highly sensitive to competition and usually has extremely low heritability values (Murillo et al., 2010).
The election of candidate trees in Group 2 was not only done to complete an acceptable base of select trees, but also to avoid making type II error by using very strict criteria. The Eigen vectors of CP 1 showed that the members of groups 1 and 2 have positive values and are eligible. Otherwise it occurred in the trees of Group 3 with negative vectors, which eliminated them as optional, so the sample was restricted to the other two sets (Figure 2). The 46 trees chosen by ACP were identified in the SVS data (Figure 3); from them, when identifying those that fulfilled with a minimum distance of 70 m, it was possible to gather 30 outstanding trees (Figure 4), which is equivalent to approximately one tree for each 1.6 ha, representing 7 % of the initial population.

Figure 2 Cluster of trees in the 1 and 2 principal components in a mahogany (Swietenia macrophylla King.) natural stand in Felipe Carrillo Puerto, Quintana Roo State, Mexico.
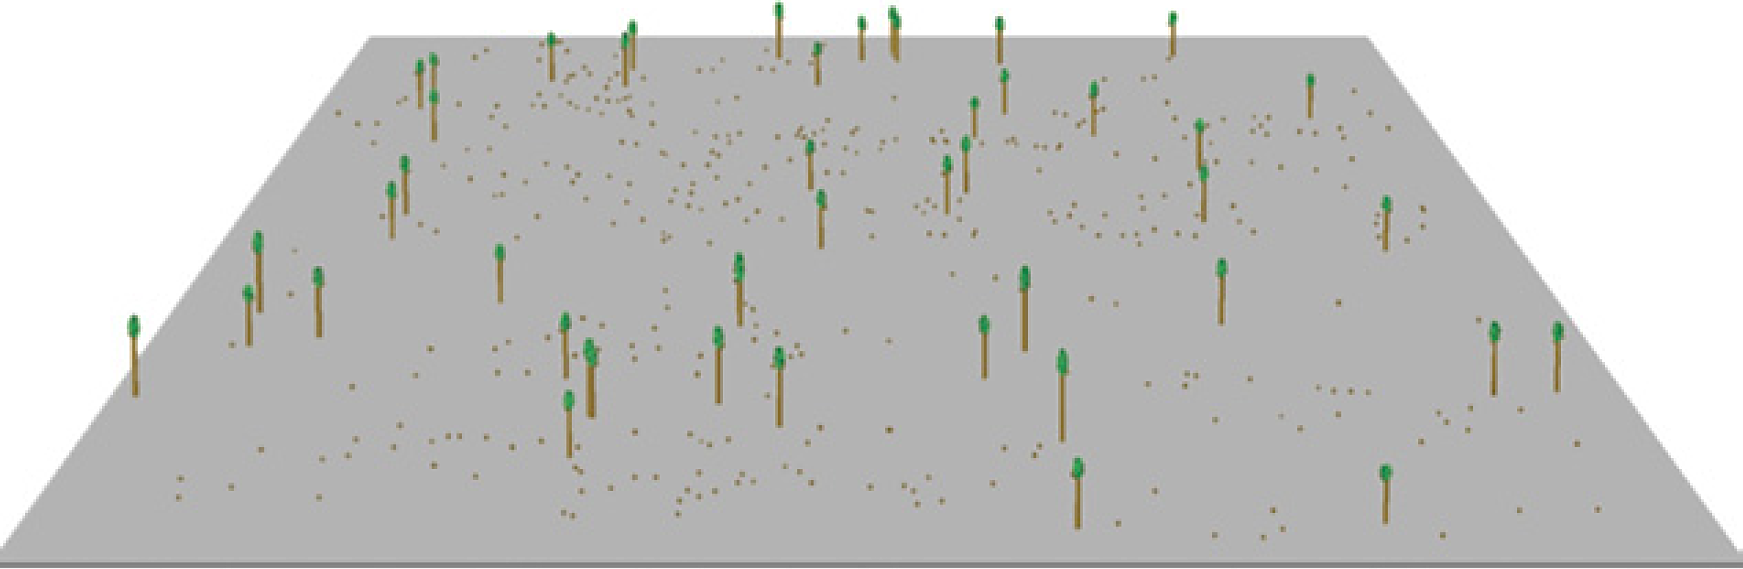
Figure 3 Candidate trees in the mahogany (Swietenia macrophylla King.) natural stand in Felipe Carrillo Puerto, Quintana Roo State, Mexico.
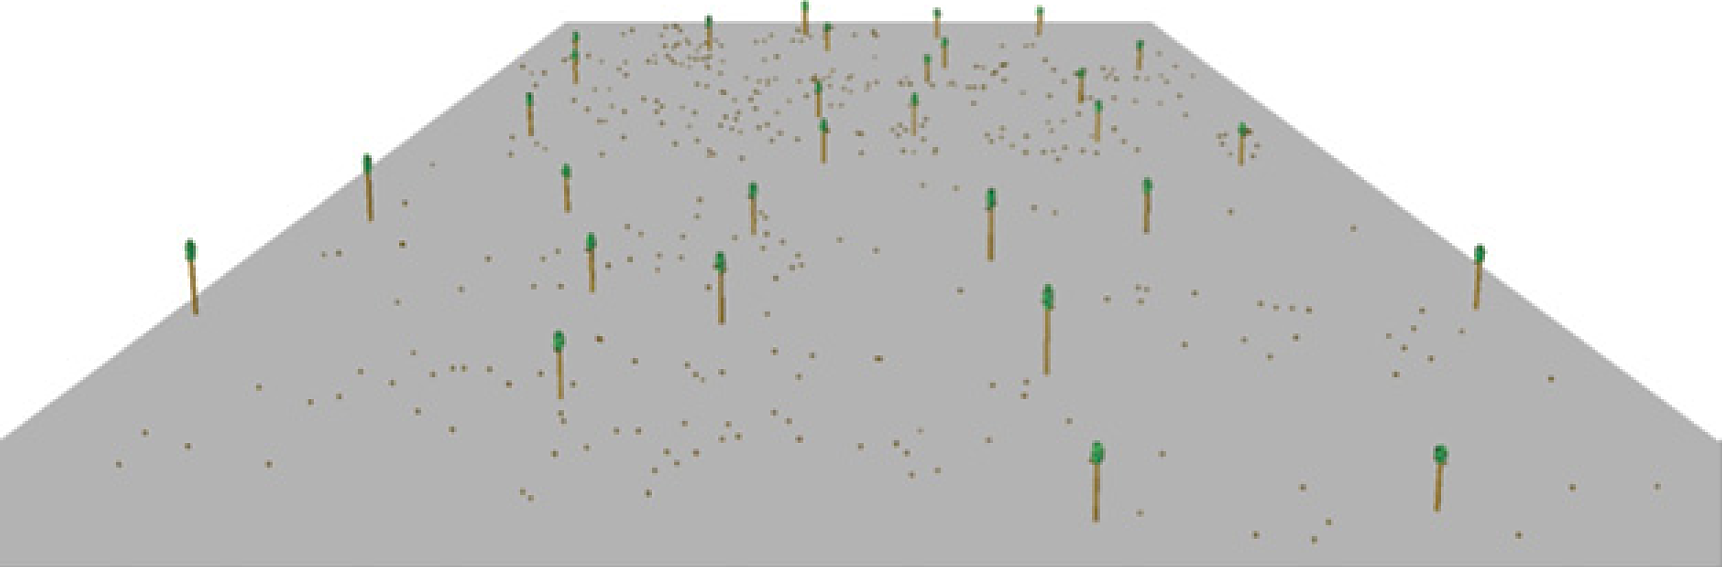
Figure 4 Selected trees in the mahogany (Swietenia macrophylla King.) natural stand in Felipe Carrillo Puerto, Quintana Roo State, Mexico.
Like Cerón and Sahagún (2005), Cerón et al. (2006), Cornejo et al. (2009) and Gutiérrez et al. (2010), in this study the first component explained in the best way the contribution of the variables in the total variation. Those taken for the selection in this work have also been used for Pinus radiata D. Don (Mertens, 1983), Gliricidia sepium (Jacq.) Kunth ex Walp. (Salazar and Boshier, 1989) and Pinus greggii var. greggii (Cornejo et al., 2009; Gutiérrez et al., 2010), but, in this paper, the lowest number of variables was considered, which showed a positive phenotypic correlation (Table 3). Therefore, it would not be a problem to be strict when applying the selection based on one character since it would not be negative for another.
Table 3 Phenotypic characteristics of the base population and selected mahogany (Swietenia macrophylla King.) population in Felipe Carrillo Puerto, Quintana Roo State, Mexico.
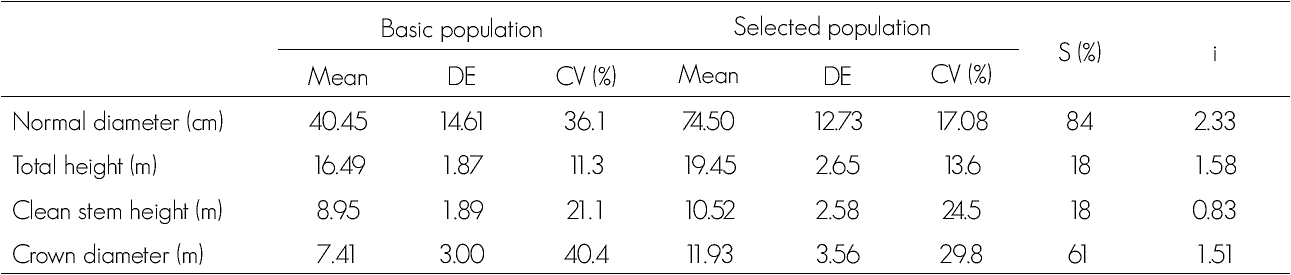
CV = Coefficient of variation; DE = Standard deviation; S = Selection differential; i = Selection intensity.
The number of selected trees affects the genetic base, because if it is small there is a narrow possibility that could lead to problems of inbreeding. The final decision of such an amount also depends on the variability of the selected trees, on the seed productivity of each individual, and on the immediate needs for seeds in both quantity and quality (Ledig, 1974; Quijada, 1980). The less prolific a species is in seed production, the greater number of individuals will be required to meet plant production goals. The 30 trees selected here are considered enough for a small breeding program (López, 2006), which is close to the ssumption of Zobel and Talbert (1988) who considered that 20 upper trees is a correct proportion for the establishment of seed orchards.
The normal diameter showed the highest irregularity in the base population, according to the standard deviations and the coefficient of variation, while the crown diameter occurred in the selected population. The former decreased considerably in this group with respect to normal and crown diameter; on the other hand, the total height and the clean stem exhibited a slight increase in the major trees (Table 3). The selection differential for the characteristics of economic interest indicates positive values; normal diameter with the highest value, corresponding to 84 % of the base population, is followed by the cup diameter with 61 %. In the total height and clean stem, the numbers were low because they represented only 17 % of the base population.
Regarding the estimated genetic gain, it was estimated that the normal diameter would be 45.36 % higher in the new generation relative to the parent (selected trees). At full height and clean stem, the next generation would only be 9.9 % higher. The value for normal diameter coincides with the data published by Cornelius (1994) based on the analysis of 24 works on the effectiveness of the selection of trees in breeding programs, in which he recorded that the genetic advantage reported and obtained when using better material is greater than 15 % for growth in height and normal diameter, while in total height and height of clean stem determined higher figures than those calculated here. Those of the present study are conservative, since the calculation was made only from the sexual reproduction by means of the seeds of the selected individuals; however, if reproduction were asexual (cloning), the gains would be greater.
The highest value of selection intensity here was for the normal diameter with 2.33; Total height and cup diameter reached mean values of 1.58 and 1.51; And the clean stem height, the lowest selection intensity value (Table 3). This concept was equivalent to two standard deviations in normal diameter, which shows that a broad gain in this characteristic can be achieved by choosing the best phenotypes of the population. According to Wright (1976), a differential of two to three standard deviations is realistic when practiced in natural forests. The intensity of selection indicates to what extent the superior trees are phenotypically better with respect to the original population from where they were taken (Zobel and Talbert, 1988).
Conclusions
Principal component analysis (PCA) and cluster analysis allowed the selection of the best 30 trees, whose superiority over the base population was 34 cm in normal diameter, 2.9 m in total height and 1.5 m in commercial height. The method based on multivariate analysis is convenient because it is simple, it provides statistical support to forest breeding programs because it favors the presence of multiple characteristics. The selection was effective because the trees chosen by the PCA were the best in the field. The results make the proposed method recommendable because the objective was reached satisfactorily and estimates the percentage value of expected genetic gain, although it should be taken into account that there is a tendency to underestimate or overestimate the true values.
The selection through PCA and clustering is strengthened by the use of the SVS program that makes possible the spatial management of trees and the different scenarios in the selection of trees, which means that this information is important in decision making as far as tropical trees are concerned.
Conflict of interests
The authors declae no conlfict of interests.
Contribution by autor
Benito N. Gutiérrez Vázquez: analysis of field data, writing, structure and presentation of results in the manuscript; Eladio H. Cornejo Oviedo: analysis of field data, assessment of the statistical analysis and review of the document; Bartolo Rodríguez Santiago: planning, design and supervisions of field work, review of the document and analysis of the application of results; Javier López Upton: analysis of the application of results and review of the document; Mario H. Gutiérrez Vázquez: assessment of the applicability of field work data, assessment and support in statistical fit; Martín Gómez Cárdenas: assessment of the applicability of field work data and review of the document; Amelia Flores Montaño: analysis of the application of results and review of the document.
Referencias
Bramlett, D. L., E. W. Belcher Jr., G. L. DeBarr, J. L. Hertel, R. P. Karrfalt, C. W. Lantz, T. Miller, K. D. Ware and H. O. Yates III. 1977. Cone analysis of Southern pines: a guidebook. USDA Forest Service Gen. Tech. Rep. SE-13. Asheville, NC, USA. 28 p. [ Links ]
Brown, C. L. and R. E. Goddard.1961. Silvicultural consideration in the selection of plus tree phenotypes. Journal of Forestry 59: 420-426. [ Links ]
Cerón R., J. J. y J. Sahagún C. 2005. Un índice de selección basado en componentes principales. Agrociencia 39: 667-677. [ Links ]
Cerón R., J. J. , J. Crossa, J. Sahagún C. , F. Castillo G. and A. Santacruz V. 2006. A selection index method based on Eigen analysis. Crop Science 46:171-1721. [ Links ]
Cornelius, J. 1994. The effectiveness of plus-tree selection for yield. Forest Ecology and Management 67:23-34. [ Links ]
Cornejo O., E. H., E. Bucio Z., B. Gutiérrez V., S. Valencia M. y C. Flores L. 2009 Selección de árboles y conversión de un ensayo de procedencias a un rodal semillero. Revista Fitotecnia Mexicana 32: 87-92. [ Links ]
Cruz C., D. 2005. Principios de genética cuantitativa. Universidad Federal de Vicosa. Vicosa, Minas Gerais, Brasil. 394 p. [ Links ]
Gutiérrez V., B., E. H. Cornejo O., A. Zermeño G., S. Valencia M. y R. Mendoza V. 2010. Conversión de un ensayo de progenies de Pinus greggii var. greggii a huerto semillero mediante Eigen-análisis. Bosque 31:45-52. [ Links ]
Ledig, F. T. 1974. Analysis of methods for the selection of trees from wild stand. Forest Science 20:2-16. [ Links ]
López U., J. 2006. Consideraciones en el manejo de germoplasma forestal. In: Ruiz T., N. A. (ed.). Producción y Conservación de Semillas Forestales. XIII Curso Internacional de Actualización en Tecnología de Semillas. Universidad Autónoma Agraria Antonio Narro. Saltillo, Coah., México. pp. 66-72. [ Links ]
Maldonado B., E. y M. L. Escobar M. 2000. Selección de árboles plus de frijolito (Schizolobium parahybum) para mejorar genéticamente la especie en Santander-Colombia. In: Salazar, R. (ed.). 2do. Simposio de Avances en la Producción de Semillas Forestales en América Latina. Turrialba, Costa Rica. pp. 39-45. [ Links ]
McGaughey, R. J. 1997. Visualizing forest stand dynamics using the Stand Visualization System. Proc. ACSM/ASPRS 4:248-257. [ Links ]
McGaughey, R. J. 1999. Stand Visualization System. http://faculty.washington.edu/mcgoy (30 de abril de 2011). [ Links ]
Mertens, P. 1983. Criterios de selección de P. radiata D. para árboles y rodales semilleros. CICAFOR, INFF y CTB. Cajamarca, Perú. 27 p. [ Links ]
Murillo, O., J. L. Rojas y Y. Badilla. 2003. Reforestación clonal. 2a ed. Taller de Publicaciones. Instituto Tecnológico de Costa Rica. Cartago, Costa Rica. 36 p. [ Links ]
Murillo, O. , F. Picado, Y. Badilla y J. Vallejos. 2010. Metodología para la selección e incorporación de árboles plus en programas de mejoramiento genético forestal. Revista de Agronomía Costarricense 34:105-19. [ Links ]
Navarro, C. and G. Hernández. 2004. Progeny test analysis and population differentiation of Mesoamerican mahogany (Swietenia macrophylla). Revista de Agronomía Costarricense 28:37-51. [ Links ]
Quijada, M. 1980. Selección de árboles forestales. In: Mejora genética de árboles forestales; curso de capacitación FAO/DANIDA sobre la mejora genética de árboles forestales. FAO. Departamento de Montes. Mérida, Venezuela. Núm. 20. pp.169-179. [ Links ]
Salazar, R. y D. Boshier. 1989. Establecimiento y manejo de rodales semilleros de especies forestales prioritarias en América Central. CATIE-ROCAP. Serie Técnica No. 148. Turrialba, Costa Rica. 78 p. [ Links ]
Stonecypher, R. W. 1970. Mejoramiento forestal de caracteres múltiples. Unasylva 24:48-51. [ Links ]
Statistical Analysis System Institute (SAS).1999. SAS/STAT Guide for personal computers. Version 6. Cary, NC, USA. 518 p. [ Links ]
Torres, J. 2000. Evaluación genética y económica de dos ensayos de progenie de Pinus radiata D. Don a base de un índice de selección multicriterio. Universidad de Chile. Revista Ciencias Forestales 14:1-7. [ Links ]
White, T. L., T. W. Adams and D. B. Neale. 2007. Forest genetics. CABI Publishing, Cambridge, MA, USA. 682 p. [ Links ]
Wright, J. W. 1964. Mejoramiento genético de los árboles forestales. FAO. Roma, Italia. 436 p. [ Links ]
Wright, J. W. 1976. Introduction to forest genetics. Academic Press. New York, NY, USA. 463 p. [ Links ]
Zobel, B. J. y J. T. Talbert. 1988. Técnicas de mejoramiento genético de árboles forestales. Ed. Limusa. México, D. F., México. 545 p. [ Links ]
Received: January 15, 2016; Accepted: July 21, 2016
 Este es un artículo publicado en acceso abierto bajo una licencia Creative Commons
