


Serviços Personalizados
Journal
Artigo
 texto em
  Espanhol (pdf)
 Artigo em XML
 Referências do artigo
 Enviar este artigo por email
Indicadores
-
 Citado por SciELO
 -
 Acessos
Links relacionados
-
 Similares em
SciELO
Similares em
SciELO
Compartilhar

 Permalink
Revista mexicana de ciencias forestales
versão impressa ISSN 2007-1132
Rev. mex. de cienc. forestales vol.7 no.36 México Jul./Ago. 2016
Articles
1 Centro Nacional de Investigación Disciplinaria en Conservación y Mejoramiento de Ecosistemas Forestales, INIFAP. México.
2 Facultad de Filosofía y Letras, Colegio de Geografía, Universidad Nacional Autónoma de México. México.
In the conifer forests of the states of Puebla, Tlaxcala and Hidalgo, Mexico, leaf fall problems have been registered, mainly due to attack by the Lophodermium spp. fungus. Alterations of the current climate conditions will play a significant role in the future distribution of the fungus. The objective of the present work was to determine the current potential distribution, in climate change (CC) scenarios, of Lophodermium spp. in the vegetation of the states mentioned above. The Genetic Algorithnm for Rule-set Production (GARP) was applied to generate the potential distribution models based on various climate coverages (both current and with CC scenarios), and of sites of occurrence of the fungus. The results suggest that areas with a high potential are located on the Sierra Norte de Puebla. The current potential surface area with a high category is larger during the development period (March-June), with 83 197 ha, compared to the growth phase (September-December), with 74 829 ha. With the CC scenario RCP4.5 (for the year 2039), the high class surface area was presented as in a development stage, with 159 4333 ha. In contrast, with scenario RCP8.5, the surface area during the growth phase was larger, with 138 810 ha. A higher risk of occurrence of the fungus was observed under the current and CC RCP4.5 scenarios in its development phase, and under scenario RCP8.5 in its growth phase.
Key words: Pine needles; GARP algorithm; pine forest; climate change; current distribution; Lophodermium spp
En los bosques de coníferas de los estados de Puebla, Tlaxcala e Hidalgo, México se han registrado problemas de caída foliar, principalmente, por ataques de Lophodermium spp. Las alteraciones en las condiciones climáticas actuales tendrán un papel importante en la distribución futura del hongo. El objetivo del presente trabajo fue determinar la distribución potencial actual y con escenarios de cambio climático (CC) de Lophodermium spp. en la vegetación de las entidades antes mencionadas. Se aplicó el algoritmo Genetic Algorithm for Rule-set Production (GARP, por sus siglas en inglés) para generar los modelos potenciales de la distribución, a partir de diversas coberturas climáticas (actuales y escenarios de CC), y sitios de presencia del organismo. Los resultados sugieren que las áreas con alto potencial se ubican en la Sierra Norte de Puebla. La superficie de distribución potencial actual con categoría alta es mayor en el periodo de desarrollo (marzo-junio), 83 197 ha, con respecto a la fase de crecimiento (septiembre-diciembre), 74 829 ha. Con el escenario de CC, RCP4.5 (año 2039) la superficie con clase alta se presentó en el periodo de desarrollo, el cual fue de 159 433 ha; en contraste en el escenario RCP8.5 la extensión de la época de crecimiento fue superior, con un valor de 138 810 ha. La etapa de desarrollo del hongo en los escenarios actual y de CC RCP4.5 tuvo superficies con más potencial de presencia del organismo, y en la de crecimiento fue con el escenario RCP8.5.
Palabras clave: Acículas de pino; algoritmo GARP; Bosque de pino; cambio climático; distribuciónactual; Lophodermium spp
Introduction
Lophodermium pinastri (Schrader) Chev. is known as the causative agent of the fall of (Cibrián et al., 2007). This fungus remains on the tree throughout its life cycle and attacks weak, poorly developed individuals (González, 2004). The needles are infected at the end of the summer or in fall, and the pathogenous agent remains within them during the following winter. In the subsequent spring, the fungus starts growing once more, on infected needles that develop brownish spots with yellow edges, which cause the death of their tissues at the end of the season (Cibrián et al., 2007; French, 1988).
Dispersion occurs as a result of the action of wind and rain after the histerothecia are formed, absorb moisture, mature and release their ascospores. Infection occurs, again, via the vegetative mycelium in the tissue of the leaves during winter (Alvarado, 2005; Cordón, 2009). Minter (2015) points out that Lophodermium is very abundantly distributed in various pine forests across the world and generally occurs where there is air pollution and at altitudes of over 1 800 masl. According to Hattemer (1964) and Alvarado (2005), apothecia develop mainly in dead needles that fall on the ground, where they release spores that infect the green leaves.
Approximately 3 000 hectares with symptoms of leaf drying associated with Lophodermium sp. were detected in the municipalities of Zacatlán, Aquixtla and Tetela de Ocampo, in the state of Puebla. If this issue is neglected, the fungus may spread to several states of the Mexican Republic.
On the other hand, climate change will produce hydric stress in forest species, as well as a higher incidence of pests and diseases, reduced pollination and reduced productivity, among other impacts (Allen, 2009; Conafor, 2013; IPCC, 2014). Climate change is expected to bring about large scale movements of species toward new distribution areas; therefore, new forest restructuring strategies will be necessary to compensate the adaptation discrepancies between populations in order to maintain the productivity and good health of forests (Yanchuk and Allard, 2009).
The impact of climate change on forest pests and diseases will affect their development, survival, reproduction, distribution and spreading, as well as the alterations in the physiology of organisms, and changes in the relationships between the pests with other species and with the environment (FAO, 2005; Menéndez, 2007; Moore and Allard, 2008; Samaniego, 2009; Sturrocka et al., 2011).
Climate models simulate the complex interactions between the atmosphere, the ocean, the earth’s land surface, snow and ice, the global ecosystem and a variety of chemical and biological processes (IPCC, 2013). Scenarios are tools for characterizing the future socioeconomic developments of climate change, their risks and the implications of the policies to be implemented (IPCC, 2014). Climate change scenarios are representations of what will happen as a consequence of changes in the Greenhouse Gases (GHG) caused by human influence and by natural forces in the climate system (IPCC, 2014).
Within the framework of the fifth phase of the Coupled Model Intercomparison Project (CMIP5), the new set of scenarios of recent simulations of climate models are the Representative Concentration Pathways (RCPs), which update the recently developed general atmospheric circulation models (IPCC, 2014). These new models are divided into four groups: RCP2.6, RCP4.5, RCP6.0 and RCP8.5, and they refer to the global energy radiation, expressed in terms of W m-2, resulting from the increase in the amount of greenhouse gases (Cavazos et al., 2013).
This research, which stems from the need to model the impact that climate change will have on the distribution of forest pests and diseases, as well as from the importance of the phytopathogenous fungi of the Sierra Norte de Puebla, had as its main objective to determine the potential distribution of the causative agent of the falling of pine needles (Lophodermium spp.) under climate change scenarios in the Sierra Norte de Puebla and its neighboring regions. The GARP algorithm was used to model the potential distribution of Lophodermium according to the current and future climate conditions. The RCP scenarios generated by the IPCC served as a foundation for modeling the potential future distribution of the fungus.
Materials and Methods
Study area and physical description
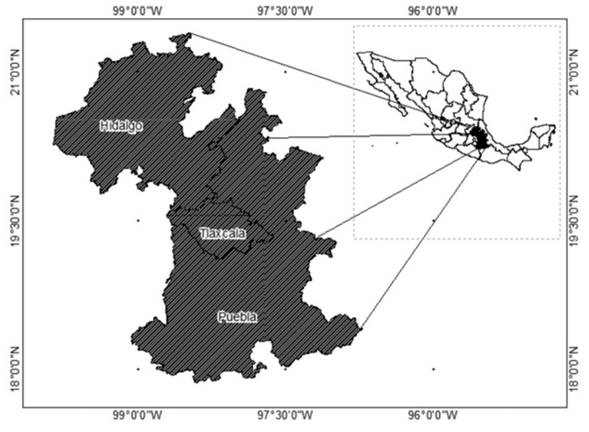
The study area comprises the states of Hidalgo, Puebla and Tlaxcala, located between the extreme coordinates 96° 35’ 00’’ W, 18° 05’ 00’’ N, and 99° 30’ 00’’ W and 21° 25’ 00’’ N (Figure 1).
The vegetation is dominated by pine (Pinus spp.), oak (Quercus spp.), pine-oak, oak-pine, sacred fir (Abies religiosa (Kunth) Schltdl. et Cham.) and Pinchot juniper (Juniperus spp.) forests, and by crasicaule species (Cervantes et al., 1990).
In general, three major climate groups are present in the study area: temperate, semiwarm and semiarid (García and Conabio, 1998). The mean annual temperature ranges between 10 and 16 °C, while the mean annual precipitation ranges between 500 and 1 000 mm, although these values change in terms of the type of climate (Vidal, 1990; Conabio, 2015). The soil types are varied, with predominance of Acrisols, Luvisols, Regosols and Lithosols (Conabio, 2015).
Generation of digital environmental coverages
The environmental layers used in the potential distribution model of Lophodermium spp. were: monthly climate layers (accumulated precipitation, mean temperature, mean relative humidity and evapotranspiration), topographic layers (altitude, exposure and slopes), vegetation (pine and mixed forests) and sites of occurrence of the fungus. All the coverages were referenced to the WGS84 Datum geographical coordinate system.
Current climate layers. Historical data (2011 to 2014) were obtained from 12 weather stations -six for the state of Hidalgo, three for Puebla, three for Tlaxcala and 12 for Veracruz- of the National Weather System and the National Water Commission. The databases were analyzed and processed in order to generate monthly layers for mean temperature, accumulated precipitation, mean relative humidity and evapotranspiration. The latter was estimated using Thornthwaite’s formula (1948). The Visual FoxPro 6.0™ software (Microsoft Corporation, 2000) was used to calculate the averages for the years 2011-2014 and to interpolate the data using the Inverse Distance Weighted method (ESRI, 2016). The output resolution was 100 m.
Lophodermium spp. have two major biological phases: one of growth, known as infectation (in late summer and fall), and one of development (in spring) (Cibrián et al., 2007). Coverages were generated for both -one in September through December, and the other in March through June.
Climate layers under climate change scenarios. Coverages for climate change scenarios were obtained from short-term (2015-2039) and long-term (2075-2099) projections of 15 global circulation models for Mexico (Cavazos et al., 2013). Scenarios RCP4.5 and RCP8.5 were utilized for the 2039 horizon and are available at the website of Instituto Nacional de Ecología y Cambio Climático (the National Institute of Ecology and Climate Change, (http://escenarios.inecc.gob.mx).
Thematic layers. Thematic layers (topography and vegetation) are taken from the website of the Instituto Nacional de Estadística y Geografía of Mexico (National Institute of Statistics and Geography) (Inegi, 2013). Based on the digital elevation model, the altitude, exposure and slope layers were generated; the output resolution was 100 m.
Presence record layer. Lophodermium spp. records were made based on field samplings; for this purpose, the trees showing symptoms of the causative agent of leaf fall in pines were geographically located using a Garmin™ gpsmap 64s geolocator. other records of areas affected by Lophodermium spp. provided by the state management of Conafor in Puebla were also included. they were all (127) converted to vectorial format (*.shp) for their integration and processing using the GARP model.
GARP modeling
Stochastic solutions generated by GARP modeling were utilized for the potential distribution models, under both current and climate change scenarios. For the parametric optimization of the models, the convergence limit was established at 0.001, with a maximum of 1 000 iterations. If the value for the convergence limit is equal to zero, the model will be stopped until the maximum number of iterations is reached. Iterations refer to the generations in which the sets of rules are tested, reproduced and mutated (Martínez, 2010). Out of the total number of presence points (127), 50 % were used for training, and the rest, for model validation.
Distribution models were generated from the coverages of mean temperature, accumulated precipitation, mean relative humidity, evapotranspiration of the March-June and September- December periods, as well as of altitude, slope and exposure. The GARP analysis concluded with a predictive spatial analysis of the distribution of the fungus. Each prediction is derived from the application of different algorithms. The procedure described by Anderson et al. (2003) was followed, and the best 10 out of a total of 100 models generated to identify the area pattern in a stable manner were taken into account.
The 10 best models were integrated into a consensus map with 10 categories, in which the maximum number corresponds to the area with most probability of occurrence of the fungus. The map was classified into potentiality categories: low, in which 1 to 3 models converge; medium, with convergence of 4 to 7 models, and high, with convergence of 8 to 10 models, from the highest to the lowest degree of adjustment. The last step was the spatial modeling of the potential distribution in the March-June and September-December periods. The areas of potential distribution of Lophodermium were restricted to temperate forests with the help of the vegetal coverage of Inegi Series IV.
Model adjustment and selection
Errors of commission and omission were calculated for each model by comparing the test points with the generated models. Errors of commission are tolerated, as they may imply that the predicted area is adequate for the species but is absent due to some other type of factors (such as sampling error, barriers, competition, etc.), although there is also the possibility of a true error of commission due to inadequacy of the predicted area for the taxon. The 10 best models were selected based on the optimal distribution of the error for each individual replica and the least number of errors of omission. Models with a predetermined omission error value with a 20 % tolerance (Stockwell and Peters, 1999; Anderson et al., 2003; Paredes et al., 2011) were used to create the final map.
Results and Discussion
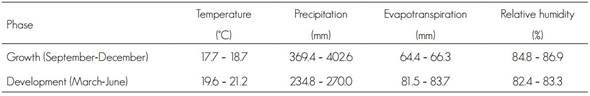
Current climate characterization
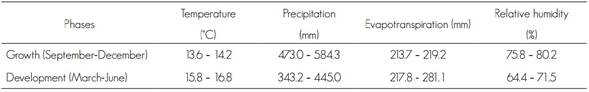
The current values of the temperature, precipitation, evapotranspiration and relative humidity variables for the growth and development stages of Lophodermium spp. are shown in Table 1. In average, the temperature was above 3.5 °C in the development period and during evapotranspiration (35.05 mm), in relation to the development phase, during which precipitation and relative humidity were higher, with 199.45 mm and 15.75 %, respectively.
According to González (2004), who carried out a study of incidence and severity of Lophodermium spp. in Pinus oocarpa Schiede ex Schltdl and Pinus maximinoi H. E. Moore in Guatemala, from August 2003 to January 2004, a high relative humidity (87 to 89 %) favored the development of the pathogen. Furthermore, he suggested that low temperatures (< 14 °C) and high relative humidity are decisive factors for spore ripening and release, which increases the risk of infection in pine trees. For their part, Prihatini et al. (2015), in Tasmania, identified a community of fungi associated to Lophodermium in the needles of Pinus radiata Don., with annual precipitations ranging between 714 and 1 439 mm and temperatures of 5.3 to 8.6 °C. Abundant precipitations (>400 and < 1000 mm) and high relative humidity levels favor the growth of the fungus (González, 2004; Prihatini et al., 2015); this agrees with the characteristics of the sites where the pathogen was recorded to occur in the present study.
Current potential distribution of the Lophodermium spp. fungus
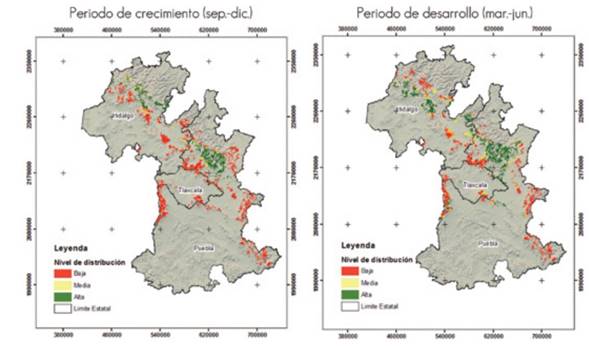
According to the results, the climate conditions required by Lophodermium spp. exist in the Sierra Norte de Puebla; therefore, the pathogen has a great potential of occurring and spreading to new conifer stands, both in Puebla and in Tlaxcala and Hidalgo. Figure 2 shows that the high potential distribution is located mainly in the Sierra Norte de Puebla and in the state of Hidalgo.
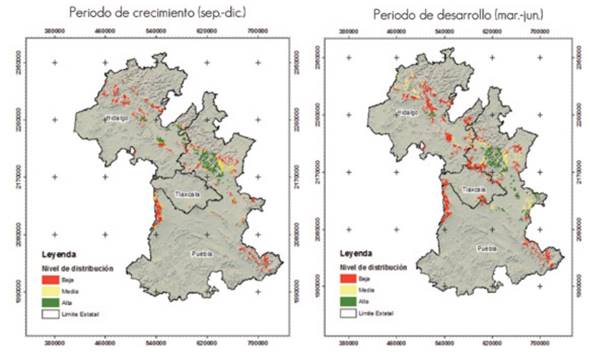
Periodo de crecimiento (sept-dic) = Growth period (Sept.-Dec.); Periodo de desarrollo (mar-jun) = Development period (March-June).
Figure 2 Current potential distribution of Lophodermium spp. in the study area, in its growth and development phases.
The surface areas with low, medium and high probabilities of current potential distribution of the species are shown in Table 2.
Table 2 Current potential distribution (ha) of Lophodermium spp. for the two phases of the biological cycle.
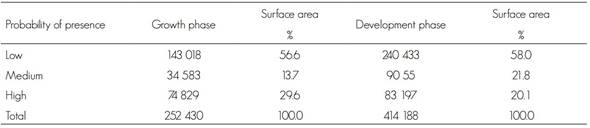
During the growth stage, 56.6 % of the surface area was classified as having a low presence of the fungus and a low distribution in the states of Puebla and Hidalgo. The medium probability of presence of Lophodermium spp. corresponded to 13.7 % of the surface, while 29.6 % has a high probability, mostly in the Sierra Norte de Puebla and, to a lesser extent, in southeastern Hidalgo.
During the development stage, 58.0 % of the surface was estimated to have a low probability of presence and was distributed mainly in the states of Puebla, Tlaxcala and Hidalgo. The medium potential distribution represents 21.8 % of the surface, in Puebla and Hidalgo; the high probability of presence was 20.1 % and was located mostly in the Sierra Norte and in central Puebla.
The surface area of the current potential distribution was 60.9 % of the total in the development phase, and 39.1 % in the growth phase. These results suggest that conditions of higher temperature and evapotranspiration and lower precipitation and relative humidity favor the development of Lophodermium. However, during the growth phase, the conditions of high humidity and a lower temperature are also adequate for its propagation (González, 2004; Alvarado, 2005). Cool and humid conditions and a high density of the plants also favor the fungus; furthermore, the presence of rain provides enough humidity for the opening of the histerothecia, although this also occurs under dry conditions (González, 2004; Alvarado, 2005). This explains why the climate conditions of the Sierra Norte de Puebla, Hidalgo and Tlaxcala are favorable for the development of the fungus, in a more humid and cooler period, as well as its development in warmer and less humid environments.
Potential distribution of Lophodermium spp. under climate change scenarios
The climate projections for 2039 show that the values of the variables in the conifer forests will change, which will benefit the presence of the fungus in the stands of the Sierra Norte de Puebla and municipalities of the neighboring states. Thus, the fungus will have better possibilities of spreading beyond its present limits to new areas covered by conifers.
Climate conditions by 2039 under scenario RCP4.5
Table 3 summarizes the projected temperature, precipitation and evapotranspiration for the year 2039 under scenario RCP4.5. It also registers the contrasts in the various stages, as one of them is humid while the other is dry.
Table 3 Climate characterization of the growth and development phases of the fungus under climate change scenario RCP4.5 (year 2039).
During the growth period of the fungus, the average differences in the variables between the present time and the year 2039 under climate change scenario RCP4.5 are significant, with positive changes in temperature and relative humidity of 6.35 °C and 12.3 %, respectively, and negative changes in precipitation (194 mm) and evapotranspiration (225 mm).
In the fungus development period, the average differences of the variables of real time to 2039 will have the same magnitude. Also, increase in temperature (6.0 °C) and relative humidity (12.3 %) will be observed, as well as reductions in rain precipitation (196 mm) and evapotranspiration (235 mm).
The changes previously described for climate variables in the future will have an impact on the potential distribution of Lophodermium spp. for the year 2039, as the environmental conditions are expected to be favorable to it; consequently, the risk of infection by the fungus in the studied forests will increase.
Spatial distribution of Lophodermium spp. under scenario RCP4.5 (year 2039)
The forests are likely to be vulnerable to attack by the pathogen in conifer forests in the studied region, according to the results obtained for climate change scenario RCP4.5. Figure 3 shows the potential distribution maps for the growth and development phases by the year 2039, under scenario RCP4.5. A high potential distribution is observed in the Sierra Norte de Puebla, toward the northwest.
Periodo de crecimiento (sept-dic) = Growth period (Sept.-Dec.); Periodo de desarrollo (mar-jun) = Development period (March-June).
Figure 3 Potential distribution of Lophodermium spp. in its growth and development phases by the year 2039 in the study area under scenario RCP4.5.
Table 4 shows the surface areas corresponding to the high, medium and low potential distributions under climate change scenario RCP4.5 (year 2039).
Table 4 Potential distribution (ha) of Lophodermium spp. for the two phases of the biological cycle by the year 2039 under scenario RCP4.5.
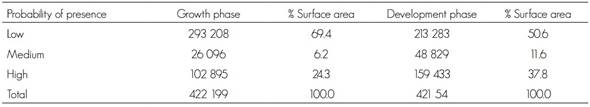
During the growth phase, 69.4 % of the total distribution of the fungus will have a low probability of presence, scattered in the three states; while the medium and high potential distribution will be 6.2 % 24.3 % and, respectively. On the other hand, the potential distribution increases in the high and medium categories, but decreases in the low category in relation to the growth phase (Table 4). According to the results, the distribution areas remain in the Sierra Norte de Puebla and in central Hidalgo.
Scenario RCP4.5 predicts a high risk due to the presence of the pathogen in its development phase in the following municipalities: Meztitlán (27 714 ha), Nicolás Flores (17 033 ha), Atotonilco (16 412 ha) and others, in Hidalgo; Ixtacamaxtitlán (55 690 ha), Aquixtla (53 191 ha), Tepetzintla (48 744 ha) and Zautla (46 926 ha), in Puebla, and Altzayanca (3 016 ha), Huamantla (2 607 ha), Terrenate (1 338 ha), in Tlaxcala. As for its growth phase, the municipalities at high risk will be: Eloxochitlán (16 257 ha), Tlahuiltepa (15 235 ha), Metztitlán (15 213 ha), San Agustín Metzquititlán (10 653 ha) and Zacualtipán (10 653 ha), in Hidalgo; Ixtacamaxtitlán (55 014 ha), Aquixtla (43 932 ha), Zacapoaxtla (40 143 ha) and Zautla (39 225 ha), in Puebla; there will be no high risk of the presence of the pathogen in Tlaxcala.
Climate conditions by 2039 under scenario RCP8.5
Table 5 summarizes the temperature, precipitation and evapotranspiration values for the year 2039 under scenario RCP8.5.
Table 5 Climate characterization of the growth and development phases of the fungus under climate change scenario RCP8.5 (year 2039).
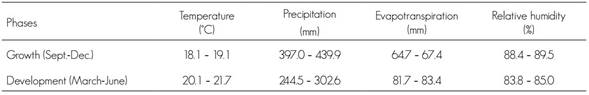
The average differences between the present time and the year 2039 for the growth phase are visible: the temperature will have an additional change of 6.95 °C; the precipitation will decrease by 148 mm; evapotranspiration, by 225 mm, and the relative humidity, by 17.25 %.
Likewise, considerable differences are predicted for the development phase of the fungus between the current time and 2039: the temperature will change by 6.75 °C, and the precipitation will decrease by 170 mm; evotranspiration, by 235 mm, and the relative humidity, by 26 %.
Spatial distribution of Lophodermium spp. under scenario RCP8.5 (year 2039)
According to the results obtained for scenario RCP8.5, pine forests will be highly vulnerable due to attack by the fungus in the studied region. Figure 4 shows the potential distribution of Lophodermium spp. in its growth and development phases maps for the year 2039 under scenario RCP8.5. In general, the high and medium potential distributions are located in the Sierra Norte de Puebla toward the northeast, while the low potential distribution is located mainly at the center of the study area.
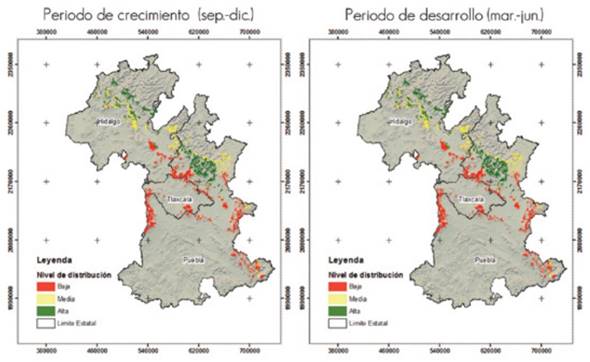
Periodo de crecimiento (sept-dic) = Growth period (Sept.-Dec.); Periodo de desarrollo (mar-jun) = Development period (March-June)
Figure 4 Potential distribution of Lophodermium spp. in its growth and development phases in the study area by the year 2039 under scenario RCP8.5.
The surface areas with high, medium and low probabilities of distribution under climate change scenario RCP8.5 (year 2039) are shown in Table 6.
Table 6 Potential distribution (ha) of Lophodermium spp. In the two phases of the biological cycle for the year 2039 under scenario RCP8.5.
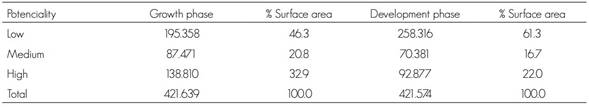
Under climate change scenario RCP8.5, 46.3 % of the total surface area will have a low probability of presence of the fungus in the growth phase, while the high and medium probabilities represent 32.9 % and 20.8 % of the surface area, respectively. As for the development phase of Lophodermium spp., the surface area decreases in the high and medium categories, and increases in the low category with respect to the growth phase, as shown in Table 6.
According to scenario RCP8.5, the climate conditions will be adequate for the presence of Lophodermium spp. The relative humidity is close to, and the temperature, higher than those cited by González (2004), 87 % and 14 °C, respectively, with a severity percentage of 42 %.
Under scenario RCP8.5, the municipalities with high risk due to the presence of the fungus in its development phase will be: Metztitlán (23 728 ha), Tulancingo (12 730 ha), Atotonilco (11 281 ha) and Cuautepec (10 415 ha), in Hidalgo; Aquixtla (45 242 ha), Ixtacamaxtitlán (41 562 ha), Tepetzintla (39 060 ha), Zautla (36 895 ha) and Tetela de Ocampo (36 461 ha), in Puebla, and Altzayanca (3 016 ha), Huamantla (2 607 ha), Terrenate (1 338 ha) and Españita (952 ha), in Tlaxcala. In the growth phase of the fungus, the municipalities at high risk will be San Agustín Metzquititlán (23 575 ha), Zacualtipán (23 575 ha), Tlahuiltepa (18 887 ha), Metztitlán (18 629 ha) and Eloxochitlán (15 475 ha), in Hidalgo, and Ixtacamaxtitlán (62 242 ha), Aquixtla (45 032 ha), Zacapoaxtla (41 738 ha), Zautla (41 333 ha), Xochiapulco (41 103 ha) and Tetela de Ocampo (38 670 ha) in Puebla; there will be no high probability of presence of the fungus in Tlaxcala.
Based on the results of the distribution models of Lophodermium spp. under scenarios RCP4.5 and 8.5, the projected environmental conditions will be favorable for the fungus in the late 2030s, for the number of affected pine forests will increase. The differences in the surface areas between the development and growth phases and between scenarios is low in terms of percentage. This indicates that the climate variables of relative humidity, temperature and precipitation predicted for scenarios RCP4.5 and 8.5 are similar to those registered by González (2004), who points out a high incidence and severity of the fungus.
The values estimated in this work agree with those obtained by Tchebakova et al. (2016), who registered a larger amount of forest areas damaged by Lophodermium spp. in the short term (year 2020); although they used different climate change scenarios from those utilized in the present study (B1 and A2: model HadCm3), they cite a tendency toward favorable conditions for the development of Lophodermium spp. No comparison was made with this study for the long term; however, we should note that, according to these authors, the surface area of damaged forests will decrease by 2080, due to the particular characteristics of their study area.
On the other hand, the predictive models of species distribution have increased in number, as they are a tool that allows relatively accurate estimations for the future (Martínez et al., 2004 quoted by Paredes et al., 2011). These models generate an intermediate zone between the surface areas currently and potentially occupied by the species (Jiménez-Valverde et al., 2008), or what might be an approximation to the distribution area.
The GARP algorithm for the distribution of Lophodermium spp. determined a spatial similarity between the areas where it occurs and those with optimal conditions for its development, e.g. the region of the Sierra Norte de Puebla for both phases at the present time. On the other hand, under climate change scenarios, the results suggest that the surface areas with favorable environmental conditions for the presence and development of the fungus will be wider. Future climate scenarios foresee that the availability of moisture in the forests will be strongly affected; this will have a direct impact on the life cycle of Lophodermium. This may be explained by the fact that warmer temperatures produce greater losses of water by evapotranspiration and reduce the ability of the plants to use this vital fluid more efficiently (Mortsch, 2006).
Conclusions
Lophodermium will have a wide potential distribution in the near future due to climate changes. The results show that new areas of the pine forests will be affected, as the climate conditions will favor the growth and development of the fungus beyond its current distribution. The main climate factors determining the presence of the fungus in pine trees are moderate precipitations, cold temperatures and relatively high humidity.
The use of the GARP algorithm allows quantitative determination of the probabilities of presence of Lophodermium both currently and under future scenarios. This work represents an effort to model the potential distribution of Lophodermium in order to plan timely actions for mitigating the impact of this fungus on the forest resources of the study area.
Acknowledgements
The authors wish to express their gratitude to the Comisión Nacional Forestal (the National Forestry Commission) for funding the “Determination, distribution and control of the causative agent named Leaf Fall in Pine Trees of Puebla” Project as well as to the Sistema Meteorológico Nacional (the National Meteorological System) and to the Comisión Nacional del Agua (the National Water Commission) for providing the databases of their weather stations.
REFERENCES
Alvarado, R. D. 2005. Enfermedades y agentes abióticos en árboles en México; conceptos, diagnosis y manejo. Colegio de Postgraduados. Montecillos, Edo. de Méx., México. 275 p. [ Links ]
Allen, C. D. 2009. Muerte regresiva del bosque inducida por el clima: ¿un fenómeno mundial en aumento? Unasylva 60(231-232):43-49. [ Links ]
Anderson, R. P., D. Lewc and A. Townsend P. 2003. Evaluating predictive models of species’ distributions: criteria for selecting optimal models. Ecological Modelling 162:211-232. [ Links ]
Cavazos, T., J. A. Salinas, B. Martínez, G. Colorado, P. de Grau, R. Prieto G., A. C. Conde Á., A. Quintanar I., J. S. Santana S., R. Romero C., M. E. Maya M., J. G.Rosario de La C., M. del R. Ayala E., H. Carrillo T., O. Santiesteban y M. E. Bravo. 2013. Actualización de escenarios de cambio climático para México como parte de los productos de la Quinta Comunicación Nacional. Informe Final del Proyecto al INECC. http://escenarios.inecc.gob.mx/index2.html (2 de diciembre de 2015). [ Links ]
Cervantes Z., Y., S. L. Cornejo O., R. Lucero M., J. M. Espinoza R., E. Miranda V. y A. Pineda V.1990 Provincias Fisiográficas de México. Extraído de Clasificación de Regiones Naturales de México II, IV.10.2. Atlas Nacional de México. Vol. II. Vectorial (shp). Escala 1:4000000. Instituto de Geografía, UNAM. México, D.F., México. [ Links ]
Cibrián T., D., D. Alvarado R. y S. E. García D. 2007. Enfermedades forestales en México. Forest diseases in Mexico. Universidad Autónoma Chapingo: CONAFOR-SEMARNAT, México; Foresty Service USDA, EUA; NRCAN Forest Service, Canadá y Comisión Forestal de América del Norte, COFAN, FAO. Chapingo, Edo. de Méx., México. 587 p. [ Links ]
Comisión Nacional para el Conocimiento y Uso de la Biodiversidad (Conabio). 2015. Temperatura media anual en México (1910-2009), escala: 1:1000000. Vectorial (shp) Comisión Nacional para el Conocimiento y Uso de la Biodiversidad. México, D. F., México. s/p. [ Links ]
Comisión Nacional Forestal (Conafor). 2013. Bosques, cambio climático y REDD+ en México. Guía Básica. Área de Proyectos y Mercados Forestales de Carbono. Zapopan, Jal., México. 87 p. [ Links ]
Cordón C., P. R. 2009. Caracterización fitosanitaria de las plantaciones del Programa de Incentivos Forestales (PINFOR) en los Departamentos de Alta Verapaz y el Petén, Guatemala. Tesis Maestría. Programa de Fitosanidad. Colegio de Postgraduados. Montecillo. Texcoco, Edo. de Méx., México. 57 p. [ Links ]
Environmental Systems Research Institute (ESRI). 2016. ArcGIS Desktop. http://www.esri.com/software/arcgis/arcgis-for-desktop . (10 de enero de 2016). [ Links ]
French, D. W. 1988. Forest and Shade Tree Pathology. University of Minnesota. Department of Plant Pathology. St. Paul, MN, USA. 271 p. [ Links ]
García, E. y Comisión Nacional para el Conocimiento y Uso de la Biodiversidad (Conabio). 1998. Climas (clasificación de Köppen, modificado por García). Vectorial (shp). Escala 1:1000000, México. D. F., México. s/p. [ Links ]
González S., M. L. 2004. Caracterización del complejo de patógenos causales del tizón de la acícula del pino en la Finca Saquichai, Cobán, Alta Verapaz. Facultad de Agronomía. Universidad de San Carlos. Guatemala, Guatemala. 42 p. [ Links ]
Hattemer, H. H. 1964. Geographic variation of resistance to Lophodermium pinastri in scots pine. In: Gerhold, H. D., R. E. Mcdermott and E. J. Schreiner (ed.). Breeding Pest-Resistant Trees: Proceedings of a NATO and N. S. F. Pennsylvania State University. Philadelphia, PA, USA. pp. 97-102. [ Links ]
Instituto Nacional de Estadística, Geografía e Informática (Inegi). 2013. Conjunto de datos vectoriales de uso del suelo y vegetación escala 1:250 000, Serie V (Capa Unión). http://www.inegi.org.mx/geo/contenidos/recnat/usosuelo/Default.aspx (26 de enero de 2016). [ Links ]
Jiménez-Valverde, A., J. M. Lobo and J. Hortal. 2008. Not as good as they seen: the importance of concept in species distribution modeling. Diversity and Distributions 14:885-890. [ Links ]
Food and Agriculture Organization of the United Nations (FAO). 2005. Adaptation of forest ecosystems and the forest sector to climate change. Forests and Climate Change Working Paper Num. 2. Rome, Italy. 87 p. [ Links ]
Intergovernmental Panel on Climate Change (IPCC). 2013. Bases físicas. Resumen técnico. http://www.ipcc.ch/pdf/assessment-report/ar5/wg1/WG1AR5_SummaryVolume_FINAL_SPANISH.pdf (20 de marzo de 2016). [ Links ]
Intergovernmental Panel on Climate Change (IPCC). 2014. Cambio Climático 2014. Impactos, adaptación y vulnerabilidad. Contribución del Grupo de trabajo II al Quinto Informe de Evaluación del Grupo Intergubernamental de Expertos sobre el Cambio Climático. https://www.ipcc.ch/pdf/assessment-report/ar5/wg2/ar5_wgII_spm_es.pdf (3 de marzo de 2016). [ Links ]
Martínez M., E., A. T. Peterson and W. W. Hargrove. 2004. Ecological niches as stable distributional constraints on mammal species, with implications for Pleistocene extinctions and climate change projections for biodiversity. Global Ecology and Biogeography 13:305-314. [ Links ]
Martínez, N. 2010. Apuntes sobre modelación de nichos ecológicos. Laboratorio de Evolución Molecular y Experimental, del Instituto de Ecología de la UNAM. ftp://148.231.212.8/Backups/Eaton/BiblioTesis/Modelado%20de%20nichos/Apuntes_ENM_W.pdf . (17 de diciembre de 2015). [ Links ]
Menéndez, R. 2007. How are insects responding to global warming? Tijdschrift voor Entomologie 150: 335-365. [ Links ]
Microsoft Corporation. 2000. Manual del programador, Parte 1: Programación en Visual FoxPro 6.0. Redmond, WA, USA. 83p. [ Links ]
Minter, D. W. 2015. Fungi of Ukraine, Rhytismatales. CABI Bioscience, Bakeham Lane, Egham, Surrey. UK. http://www.cybertruffle.org.uk/papers/rhytukra/index.htm#abs (11 de enero de 2016). [ Links ]
Moore, B. y G. Allard. 2008. Los impactos del cambio climático en la sanidad forestal. Sanidad y Bioseguridad Forestal. FAO. Roma, Italia. 42 p. [ Links ]
Mortsch, L. D. 2006. Impact of climate change on agriculture, forestry and wetlands. In: Bhatti, J. S., R. Lal, M. J. Apps and M. A. Price (eds.). Climate change and managed ecosystems. Taylor and Francis, CRC Press. Boca Ratón, FL, USA. pp. 45-67. [ Links ]
Paredes G., D. M., A. Ramírez B. and M. A. Martínez M. 2011. Distribución y representatividad de las especies del género Crotalus en las áreas naturales protegidas de México. Revista Mexicana de Biodiversidad 82(2): 689-700. [ Links ]
Prihatini, I., M. Glen, T. J. Wardlaw, D. A. Ratkowsky and C. L. Mohammed. 2015. Needle fungi in young Tasmanian Pinus radiata plantations in relation to elevation and rainfall. New Zealand Journal of Forestry Science. 45:25. DOI: 10.1186/s40490-015-0055-6. [ Links ]
Samaniego, J. L. 2009. Cambio climático y desarrollo en América Latina y el Caribe: una reseña. Comisión Económica para América Latina y el Caribe (CEPAL). Santiago de Chile, Chile. 148 p. [ Links ]
Stockwell, D. R. B. and D. P. Peters. 1999. The GARP modelling system: problems and solutions to automated spatial prediction. International Journal of Geographic Information Systems 13:143-158. [ Links ]
Sturrocka, R. N., S. J. Frankelb, A. V. Brownc, P. E. Hennond, J. T. Kliejunasb, K. J. Lewise, J. J. Worrallf and A. J. Woodsg. 2011. Climate change and forest diseases. Plant Pathology 60: 133-149. [ Links ]
Tchebakova, N. M., N. A. Kuzmina, E. I. Parfenova, V. A. Senashova and S. R. Kuzmin 2016. Potential climate-induced distributions of Lophodermium needle cast across central Siberia in the 21 century. Web Ecology 16: 37-39. [ Links ]
Thornthwaite, C. W. 1948. An approach toward a rational classification of climate. Geographical Review 38 (1): 55-94. [ Links ]
Vidal Z., R. 1990. Precipitación media anual. En Precipitación, IV.4.6. Atlas Nacional de México. Vol II. Escala 1:4000000. (shp). Instituto de Geografía, UNAM. México, D.F., México. s/p. [ Links ]
Yanchuk A. y Allard G. 2009. Los programas de mejoramiento de árboles para la salud de los bosques: ¿pueden seguir el mismo ritmo de los cambios climáticos? Unasylva 60(231/232):50-56. [ Links ]
Received: May 18, 2016; Accepted: August 13, 2016
 Este es un artículo publicado en acceso abierto bajo una licencia Creative Commons
