


Servicios Personalizados
Revista
Articulo
 texto en
  Español (pdf)
 Artículo en XML
 Referencias del artículo
 Enviar artículo por email
Indicadores
-
 Citado por SciELO
 -
 Accesos
Links relacionados
-
 Similares en
SciELO
Similares en
SciELO
Compartir

 Permalink
Revista mexicana de ciencias forestales
versión impresa ISSN 2007-1132
Rev. mex. de cienc. forestales vol.7 no.36 México jul./ago. 2016
Articles
1 Doctorado Institucional en Ciencias Agropecuarias y Forestales, Universidad Juárez del Estado de Durango. México.
2 Instituto de Silvicultura e Industria de la Madera, Universidad Juárez del Estado de Durango. México.
3 División de Estudios de Posgrado e Investigación. Instituto Tecnológico de El Salto. México.
4 Facultad de Ciencias Forestales, Universidad Juárez del Estado de Durango. México.
The objectives of the present study were to determine the volume of lumber yield per quality grade of four pine species, evaluate significant differences per lumber grade and assess the feasibility of using a discriminant function to separate the grade qualities of sawn wood (lumber) as a function of the round wood characteristics (logs). The sample size was 80 logs (20 of each species). Pinus durangensis gave the best yield of lumber with grade 2 and better, with a 6.56 %, followed by P. teocote (4.57), while P. strobiformis reached just 0.59 in that quality. The Kruskal-Wallis test encountered significant differences (P<0.05) in the yield volume per quality grade in 14 of the 25 evaluated species pairs. P. durangensis and P. strobiformis are the two species with more significant differences in yield per quality grade in comparison with the rest. The discriminant linear function correctly classified the 27, 15, 53, and 90 % of the boards in the quality grades 2nd and better, 3rd, 4th and 5th, respectively. The study results indicate that the species has a significant effect in the yield per quality grade of lumber; it was also observed that it is feasible to use a discriminant linear function to estimate the lumber yield of pine of grade 5, as a function of the log’s characteristics.
Key words: Pine forest; forest industry; round wood; productivity; volumetric yield; boards
Los objetivos del estudio fueron determinar el rendimiento volumétrico por clases de madera aserrada de cuatro especies de pino; evaluar diferencias significativas por clase de madera entre especies, así como la factibilidad de utilizar una función discriminante para separar las calidades de la madera aserrada (tablas), a partir de las características de la madera en rollo (trozas). El tamaño de la muestra fue de 80 trozas, 20 por cada especie. Pinus durangensis presentó el mayor rendimiento en madera aserrada de la clase dos y mejor con 6.56 %, seguida por P. teocote con 4.57 %, mientras que P. strobiformis tuvo solo 0.59 % de madera de esa clase. La prueba de Kruskal-Wallis evidenció diferencias significativas (P<0.05) en el rendimiento volumétrico por clase de madera en 14 de los 25 pares de especies consideradas. P. durangensis y P. strobiformis registraron más diferencias significativas en rendimiento por clase de madera, al ser comparadas con el resto de los taxa. La función lineal discriminante clasificó de manera correcta 27, 15, 53, y 90 % de las tablas dentro de las calidades 2a y mejor, 3a, 4a, y 5a, respectivamente. Los resultados del estudio indican que la especie tiene un efecto significativo en el rendimiento por clase de madera; también se observó que es factible usar una función lineal discriminante para estimar el rendimiento de madera de pino de clase 5 en función de las características de las trozas.
Palabras clave: Bosque de pino; industria forestal; madera en rollo; productividad; rendimiento volumétrico; tablas
Introduction
The quality of wood is evaluated in two ways: by its natural characteristics and by the precision of its dimensions (Eleotério et al., 1996). According to Bryant (1996), the yield of the quality grades of sawn lumber obtained from round wood from a particular species is not uniform in the sawmills of a specific region, as there are many factors that can influence the proportion of each grade or class of lumber produced; some of these are log size and quality, the characteristics of the sawn material (length and thickness), as well as the sawing, edging and lathing methods.
Steele et al. (1994) and Casado (1997) state that the characteristics of the log affect the quality and volume of the boards, and they identify certain characteristics like diameter, length, conicity and length of the log, which affect the yield of lumber. Thomas (2008) points out that accurate data of the size, shape and location of internal defects of the log are key information for improving the value and quality of the lumber. According to Zhang and Lei (2006), it is possible to predict the yield of lumber based on the characteristics of the trees, obtained directly in the forest sites, as predictive variables. Authors like Beauregard et al. (2002), Liu and Zhang (2005) and Álvarez et al. (2010) note that the diameter, length and conicity of the log are some of the variables affecting the yield of lumber.
Calculating the output based on the grade of lumber from commercial species and on the characteristics of the logs allowing discrimination between the grades or classes of wood are important tasks to predict the production of high quality boards in a particular region. This information is very useful during the decision-making processes, as well as for commercializing the logs or estimating the availability of sawn wood of a specific quality.
The objectives of the present work were to determine and evaluate significant differences in the volumetric yield by quality grade of lumber in four pine species, and to prove the feasibility of using a discriminant function to separate the qualities of the boards based on the characteristics of the logs in northwestern Durango.
Materials and Methods
Data
The study was carried out at the company named Industria Forestal Tezains (Tezains Forest Industry), property of the San Diego de Tezains ejido, in the municipality of Santiago Papasquiaro, Durango, whose facilities are located in the Western Sierra Madre in northwestern Durango. Its infrastructure includes a sawmill with a main tower and a nationally manufactured HULMAQTM resaw (band saw), with a 59.84 inch long flywheel, 8 inch wide, 17 caliber (1.47 mm) band saws, powered by two 100 HP engines, a HULMAQTM three-bracket logging carriage with two engines 10 HP one to drive it forward, with 1 425 rpm, and a 7.5 HP one with 1 730 rpm to drive in reverse. This equipment is supplemented with an edger to measure the width (12.70-30.48 cm), a semi- automatic Trimmer and a pendulum to measure the length of the boards. The sawmill has an installed capacity of 120 000 board feet per 8-hour shift; it has 25 workers, and its main product is 7/8”, 5/4”, 6/4” and 2” lumber.
20 logs of each of the following species were analyzed: Pinus durangensis Martínez, P. leiophylla Schltdl. et Cham., P. teocote Schltdl. et Cham. and P. strobiformis Engelm. The sample size was estimated based on the variation in the sawing coefficient, with a 95 % confidence interval of the mean of a pre-sample consisting of 32 logs (eight of each species), using the formula utilized by Barnes (1968):
Where:
n = Number of logs.
t = T value for a desired probability level (n-1) degrees of freedom
VC = Variation coefficient (%)
E = Permitted sampling error (%)
The logs had a fixed baseline length of 9.34 m (30 feet) and were selected at random from the pruning areas of the year 2014. Subsequently, logs with lengths of 16, 18 and 20 feet were chosen at the storage yard; certain proportionality in the number of logs per length among the various studied species. Each log was marked with paint in order to differentiate between species and identify these; the diameters without the bark were measured at both ends of the logs.
In order to determine the characteristics of the logs that make it possible to discriminate between the different quality grades of the boards, the following variables were considered: species, mean diameter, length, conicity and quality of the log. The Mexican Norm NMX-C-359-1988 (DGN, 1988) was utilized to classify pine logs, according to the following classification: Mexico 1 = first quality grade; Mexico 2 = second quality grade; Mexico 3 = third quality grade; Mexico 4 = fourth quality grade; Mexico 5 = fifth quality grade. In all cases, the logs must have a minimum diameter of length of 25 cm and 2.44 m, respectively. This classification was utilized because it agrees with the criteria used in the region. Table 1 shows the descriptive statistics of the analyzed logs by species.
Table 1 Descriptive characteristics of the logs analyzed in the study by species.
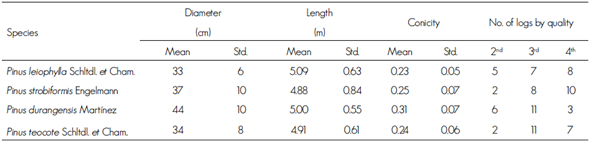
Std= Standard Deviation
Afterward, the logs were debarked and sawn in a sawmill with a main band saw tower and a HULMAQ brand resaw with 1.520 m long flywheels, 20.32 cm wide and 17 caliber (1.47 mm) band saws, powered by 100 HP motors. The sawmill has a log carrier car of three squares, HULMAQ brand with two motors, powered by a one for the advance of 10 HP and 1 425 r.p.m., and for the recoil it uses a 7.5 HP motor and gets 1 730 r.p.m. The trimmer allows to dimension width (12.70 - 30.48 cm), and a semiautomatic Trimmer and a pendulum to do it in the length of the tables.
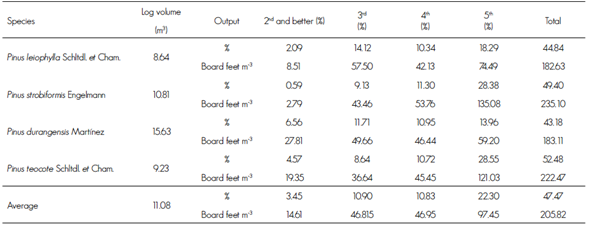
Once the timber was sawn, it was classified in to the following categories: 2nd and better, 3rd, 4th, 5th, 6th and 7th (short dimensions). However, this work studied only the 2nd and better, 3rd, 4th and 5th quality grades because these had an apparently appropriate sample size for the statistical analyses (Table 2). This classification corresponds with the categories of the Mexican Norm NMX-C-224-ONNCCE-2001.
Table 2 Volumetric yield by quality grade in percentages and in board feet per m3 of the lumber obtained from four pine species.
The sawn boards were 7/8”, 5/4”and 6/4” (2.22, 3.18 and 3.81 cm) thick, and broad boards were 3”x 3” and 4”x 4” (7.62 x 7.62 and 10.16 x 10.16 cm) thick. The widths of the timber ranged between 3” and 12” (10.16 a 30.48 cm), and their lengths ranged between 8’ and 20’ (2.4384 to 6.096 m) plus reinforcements. In order to distinguish the classified lumber yielded by each log, a control method based on marking each log with paint was applied. The information was recorded in a control format designed for this purpose.
Methods
The yield of lumber obtained per quality grade was determined based on the ratio of the volume of debarked round wood on the ramp before sawing and the resulting volume of sawn wood (Aguilera et al., 2005; Quirós et al., 2005; Valério et al., 2007). The formula used was the following:
Where:
Y = Yield of debarked lumber (%)
Vsc = Volume of sawn boards by quality grade (m3)
Vr = Log volume (m3 roll)
The evaluation of significant differences between species in the yield by lumber quality grade was carried out using the Kruskal-Wallis non-parametric test (Kruskal and Wallis, 1952), as the data were not normally distributed.
In order to identify the characteristics that discriminate between the different classes or quality grades of lumber, a discriminant analysis was carried out, using the DISCRIM procedure of the SAS/STAT system (SAS, 2009). The discriminant analysis allows the disaggregation of sets of data with excluding characteristics in two or more groups (diameter, conicity, and quality of the log, etc.) (Khattree and Naik, 2000). The technique consists essentially in obtaining a classification rule that will maximize the quotient of variance groups in relation to the total of the variance. When the distribution within each group is assumed to be normal multivariate, a parametric method can be used to develop a discriminant function, also known as classification criterion, and it can be determined by means of a generalized squared distance measure (Rao, 1973).
The classification criterion takes into account the probabilities of separation for each group, and can be used as the individual covariance between groups (producing a root mean square function), or as an aggregated covariance matrix (resulting in a linear function). Each observation is carried out for each class, considering the lowest value of the generalized square distance (SAS, 2009).
The discriminant analysis must be performed only when the means of the populations turn out to be statistically different (Álvarez et al., 2003). The MANOVA instruction of the DISCRIM procedure was utilized to carry out the equality of means analysis (SAS, 2009).
The multivariate normality test was carried out using the Mardia’s test for the bias and the kurtosis (Khattree and Naik, 1999), together with the macro %MULTNORM tool of the SAS system (SAS, 2009).
The covariance matrix assumption was proved using the plausibility radius; for this purpose, the POOL=TEST instruction of the DISCRIM procedure of SAS/STAT was specified (SAS, 2009).
Since the quality of the adjustment does not necessarily reflect the quality of the prediction, an evaluation of the classification rate of the discriminant function with an independent set of data would be most desirable (Myers, 1990; Wang et al., 2003; Kozak and Kozak, 2003). Because these data (an independent sample) are scarce, the cross-validation approach was adopted. This procedure consists in leaving out an observation and building a discriminant rule for the rest of the data -a rule utilized to classify the observation that was left out. This is repeated for each observation, and, finally, the number of erroneously classified observation for each population is counted, and the individual error indices are estimated in the same manner as the respective proportions (Khattree and Naik, 2000).
The performance of the discriminant functions of the data was evaluated using error indices (likelihood of erroneous classification) for the adjustment and the cross-validation with the SAS/STAT procedure (SAS, 2009). The priors utilized were 0.09, 0.23, 0.26 and 0.42 for the lumber quality grades 2, 3, 4 and 5, respectively, according to the production records of the sawmill.
Results and Discussion
Volumetric yield
The yield of lumber from the four pine species is shown in Table 2. Pinus durangensis had the highest lumber yield of the 2nd and better grade, with 6.56 % (27.81 board feet per m3), followed by P. teocote, with 4.57 % (19.35 board feet per m3). The mean for the four species was 3.45 % (14.61 board feet per m3). The yield of quality grade 3 boards of P. leiophylla and P. durangensis was 14.12 and 1.71 %, respectively. P. teocote and P. strobiformis had similar volumetric yields in lumber of quality grade 5, with 28.55 and 28.38 %, respectively.
Nájera et al. (2011) assessed the volumetric yield and the dimensional quality of pine wood in five sawmills in El Salto, Durango, Mexico, and obtained averages below those of the present work, with yields of 1.3 % for the 2nd and better grade and 20.4 % for the 5th grade.
Another study of pine log sawmills by Zavala and Hernández (2000) shows an average yield of 12 % for the 2nd and better grade, 18 % for the 3rd grade, 12 % for the 4th grade, and 9 % for the 5th grade, with an accumulated yield of 51 % of sawn wood. These yields are higher than those of the present research, a difference that may be ascribed to the quality of the logs that were used and to their diameters, which ranged between 30 and 55 cm (85.05 %), and between 25 and 30 cm (3.44 %), while the remaining 1.49 % had diameters of 55 to 70 cm.
The volumetric yield or sawing coefficient of the studied species ranged between 43.18 % and 52.48 %. These sawing coefficients are comparable to those cited by Zavala (1996) and Zavala (1981), in researches on pine log sawmills in Durango (40 to 53 %), and to those observed by Zavala (1987) in sawmills of Tlaxcala for Pinus spp. (51 to 52 %). However, the estimated sawing coefficients estimated for the four pine species studied were lower than those calculated by Nájera et al. (2012) for pine logs in two private sawmills located in the El Salto region of Durango (61.64 %). These differences may be attributed, among other factors, to differences in log size (diameter), conicity, or variations in the calibration, the leveling of the flywheels, and the tightening of the band saw, as well as to the expertise of the operator of the main band saw, which has a direct effect on the sawing coefficient.
In this work, a of 20.32 cm (8”) wide, 17 caliber band saw was utilized, whereas the previously mentioned sawmills used a 18.4 cm wide, 16 caliber band saw.
Table 3 shows the results of the Kruskal-Wallis test. Significant differences (P<0.05) were estimated for the volumetric yield by lumber quality grade between 14 of the 25 evaluated species pairs. The analysis indicates that P. durangensis had the highest volumetric yield for the 2nd and better quality grade; in contrast, P. strobiformis had the lowest volumetric yield.
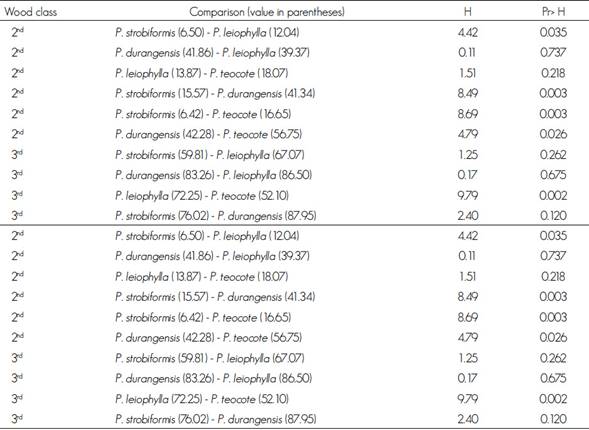
On the other hand, P. teocote and P. strobiformis are the species with the most significant differences in terms of volumetric yield by sawn wood class in regard to the rest of the studied species (9 and 8 cases, respectively). The low yield registered for P. strobiformis in the 2nd and better grade (0.59 %) is ascribed to the fact that in the state of Durango this wood is “penalized” due to the reddish graining of its sapwood, which is enough to classify it under the 3rd, 4th, and 5th grade.
The results coincide with those obtained by Erikson et al. (2000) in aged forests of northern Idaho, where differences in wood quality were found between Pinus contorta Douglas and Pinus ponderosa Douglas ex C. Lawson. More than 65 % of the sawn wood of the former species was rated as 2nd and better grade or as select, while approximately 50 % of the lumber of the latter species was rated 4th and 5th grade. These values are consistent with those obtained by Nocetti et al. (2010), who found significant differences between the classes of lumber of six timber-yielding species in Italy. In Mexico, to the date of the present study, no researches assessing the differences in lumber were found between taxa.
Discriminant analysis
The exact value of the F statistic of the Wilks Lambda test to prove the mean equality hypothesis was 7.49 (p value <0.0001); thus, it was assumed that the population means of the wood qualities are statistically different. On the other hand, the Mardia test yielded probabilities for the bias of 0.056, 0.027, 0.032, and 0.13 and for the kurtosis of 0.67, 0.85, 0.58 and 0.82, in the 2nd, 3rd, 4th, and 5th classes, respectively. Therefore, the hypothesis of mutivariate normality is considered acceptable.
Because the Chi-Square value (25.03) obtained in the equality of covariance matrices test was significant at the level of 0.01 (p value <0.01), the covariance matrices for the four wood qualities were considered to be different within the discriminant function.
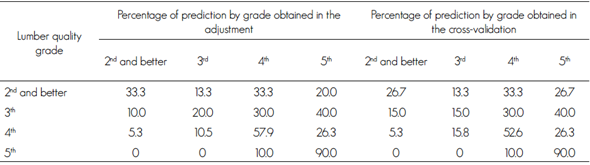
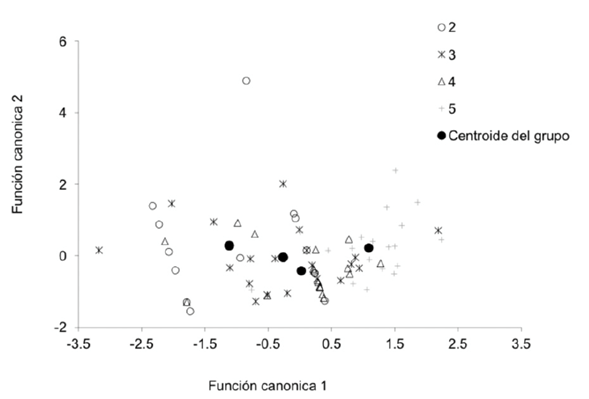
Table 4 shows the values of the discriminant linear function. According to the cross-validation, the discriminant linear function correctly classified 27, 15, 53, and 90 % of the observations as of 2nd and better, 3rd, 4th and 5th grade, respectively, when the log quality and mean diameter were used as predictive or independent variables. A similar behavior was observed in the results of the adjustment. This suggests that the discriminant function can be utilized to separate the 5th grade lumber with a very acceptable level of reliability (see aggregation of observations for the 5th quality grade in Figure 1). In order to classify the remaining lumber quality grades, the model must be either used with caution or avoided altogether, as the precision of the discriminant linear function turned out not to be sufficiently adequate, especially for separating the 2nd and better grade from the 3rd grade.
Similar results are documented by Zavala and Hernández (2000), who registered a direct relationship between log quality and the quality of the sawn wood of six pine species in a sawmill in San Pedro El Alto, Zimatlán, Oaxaca. These results are also consistent with those of Breinig et al. (2015), who obtained good adjustments for the classification of certain board quality grades using a discriminant linear function, while major deviations were observed for other grades.
The low reliability of the model for discrimination between these grades may be associated to the low yield of lumber produced by the assessed sample (3 % and 10 %, respectively): the sample size used for these classes may have been insufficient. Therefore, in future researches it is recommended to try the model with a larger board size for these two lumber quality grades. Also, the significant differences observed in the volumetric yield per grade of lumber in the studied species with the Kruskal-Wallis test would indicate the need to use the discriminant function separately for each species (Craig et al., 2005).
Table 5 shows the estimated parameters of the discriminant linear function for the four lumber quality grades.
Table 5 Estimation of the parameters of the discriminant linear functions.
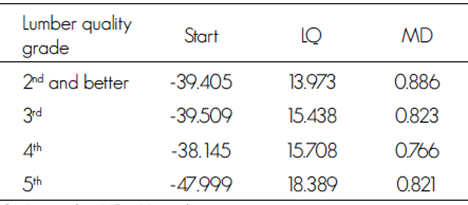
LQ = Log quality; MD = Mean diameter.
The use of the discriminant function for the classification of a board of one of the studied grades is based on the following equation, solved by lumber quality grade:
Where:
Di = Discrimination percentage estimated for the lumber quality grade of the board
i, X1 and X2 = Predictive variables (log quality and mean diameter, respectively)
bi0 ...bi1 = Estimated values of the parameters of the discriminant linear function for the lumber quality grade i (Table 4). Each observation is assigned to the group with the máximum Di value
Figure 1 illustrates a graphic expression of the discriminant function and shows that the average values of the log quality and mean diameter variables can be utilized to classify a new board within one of the four studied lumber quality grades; the discriminant function works well mainly for the 5th lumber grade.
Conclusions
Pinus durangensis showed the highest yield of lumber of the 2nd and better lumber quality grade, while P. strobiformis had the lowest yield. The pine species had a significant effect on the yield by lumber grade. The log quality and mean diameter variables turned out to be good predictors for boards of the 5th grade, within a discriminant linear function. It is advisable to study the effect of the sample size by lumber grade, as the low reliability of the discriminant model obtained for separating the 2nd and better grade from the 3rd grade may be associated to the scarce abundance of boards of these two quality grades.
Acknowledgements
The authors would like to express their gratitude to Conacyt for the financial support (105524) provided for studying the Doctorado Institucional en Ciencias Agropecuarias y Forestales (DICAF). The observations by an anonymous reviewer contributed to significantly improve the final version of this paper.
REFERENCES
Aguilera, A., L. Inzunza, R. Alzamora y L. Tapia. 2005. Evaluación del costo de producción para faenas de aserrío portátil. Bosque 26(2):107-114. [ Links ]
Álvarez, D., F. A. Egas, I. Estévez, P. Chávez y J. M. García. 2003. Análisis matemático para elevar la eficiencia en los aserraderos. Revista Chapingo. Serie Ciencias Forestales y del Ambiente 9(1):89-94. [ Links ]
Álvarez, D. , I. Estévez , A. Domínguez, O. García, J. Alaejos and J. C. Rodríguez. 2010. Improvement of the lumber recovery factory with low environmental impact in Pinar del Río, Cuba. The International Forestry Review 12(5): 303. [ Links ]
Barnes, R. 1968. Motion and time study: design and measurement of work. John Willey & Sons. New York, NY, USA. 799 p. [ Links ]
Beauregard, R. L., R. Gazo, and R. D. Ball. 2002. Grade Recovery, Value, and Return-to-Log for the Production of NZ Visual Grades (Cuttings and Framing) and Australian Machine Stress Grades. Wood and Fiber Science 34(4): 455-502. [ Links ]
Breinig, L., R. Leonhart, O. Broman, A. Manuel, F. Brüchert and G. Becker. 2015. Classification of wood surfaces according to visual appearance by multivariate analysis of wood feature data. Journal of Wood Science. 61(2): 89-12. Doi:10.1007/s10086-014-1410-6. [ Links ]
Bryant, R. C. 1996. Lumber its manufacture and distribution.. John Wiley & Sons, Inc. New York, NY, USA 535 p. [ Links ]
Casado, M. M. 1997. Tecnología de las industrias forestales. Tomo I. Serie Forestal 26. Universidad de Valladolid. Escuela Técnica Superior de Ingenierías Agrarias. Valladolid, España. 191 p. [ Links ]
Craig, T. B., P. H. Steele and V. O. Harding. 2005. Accelerated statistical prediction of lumber grades and part yields. Forest Products Journal 55(7-8):28-34. [ Links ]
Dirección General de Normas (DGN). 1988. Norma Mexicana NMX-C-359 - 1988. Industria Maderera - Trocería de Pino - Clasificación. DGN. SECOFI. México, D. F., México. 23 p. [ Links ]
Eleotério, J., R. L. Storck y S. J. Lopes. 1996. Caracterização de peças de madeira produzidas em serraria visando o controle de qualidade. Ciencia Florestal 6(1):89-99. [ Links ]
Erikson, R. G., T. M. Gorman, D. W. Green and D. Graham. 2000. Mechanical grading of lumber sawn from small-diameter lodgepole pine, ponderosa pine, and grand fir trees from northern Idaho. Forest Products Journal 50 (7-8): 59-65. [ Links ]
Kozak, A. and R. Kozak. 2003. Does cross-validation provide additional information in the evaluation of the regression models? .Canadian Journal of Forest Research 33: 976-987. [ Links ]
Khattree, R. and D. N. Naik. 1999. Applied multivariate statistics with SAS software. SAS Institute. Cary, NC and J. Wiley & Sons. New York, NY, USA. 338 p. [ Links ]
Khattree, R. andD. N. Naik . 2000. Multivariate data reduction and discrimination with SAS® Software. SAS Institute Inc., Cary, NC, USA. 558 p. [ Links ]
Kruskal W. H. and W. Wallis A. 1952. Source: Journal of the American Statistical Association 47 (260): 583- 621. [ Links ]
Liu, C. and S. Y. Zhang. 2005. Models for predicting product recovery using selected tree characteristics of black spruce. Canadian Journal Forest Resources 35: 930-937. [ Links ]
Myers, R. H. 1990. Classical and modern regression with applications. Duxbury Press. Belmont, CA, USA. 488 p. [ Links ]
Nájera L., J. A., O. A. Aguirre C., E. J. Treviño G., J. Jiménez P., E. Jurado Y., J. J. Corral R. y B. Vargas L. 2011. Rendimiento volumétrico y calidad dimensional de la madera aserrada en aserraderos de El Salto, Durango. Revista Mexicana de Ciencias Forestales 2(4): 75-89. [ Links ]
Nájera L., J. A. , G. H. Adame V., J. Méndez G., B. Vargas L., F. Cruz C., F. J. Hernández C. y G. Aguirre C. 2012. Rendimiento de la madera aserrada en dos aserraderos privados de El Salto, Durango, México. Investigación y Ciencia de la Universidad Autónoma de Aguascalientes (55): 11-23. [ Links ]
Nocetti, M., M. Bacher, M. Brunetti, A. Crivellaroand and J. W. G. van de Kuilen. 2010. Machine grading of Italian structural timber: preliminary results on different wood species. Istituto per la Valorizzazione del Legno e delle Specie Arboree. Sesto Fiorentino, FI, Italy. 8 p. [ Links ]
Quirós, R., O. Chinchilla y M. Gómez. 2005. Rendimiento en aserrío y procesamiento primario de madera proveniente de plantaciones forestales. Agronomía Costarricense 29(2): 7-15. [ Links ]
Rao, C. R. 1973. Linear statistical inference and its applications. John Wiley and Sons, Inc., New York. NY, USA. 656 p. [ Links ]
Statistical Analysis System (SAS). 2009. SAS/STAT® 9.2 Users Guide. 2nd edition. SAS Institute Inc. Cary, NC, USA. 7869 p. [ Links ]
Steele, P. H., T .E. G. Harless, F. G. Wagner, L. Kumar and F. W. Taylor. 1994. Increased lumber value from optimum orientation of internal defects with respect to sawing pattern in hardwood sawlogs. Forest Products Journal 44(3): 69-72. [ Links ]
Thomas, E. 2008. Predicting internal Yellow-Poplar log defect features using surface indicators. Wood and Fiber Science 40(1): 14 - 22. [ Links ]
Valério, Á. F., L. F. Watzlawick, R. T. Dos Santos, C. Brandeleroand e H. Koehler. 2007. Quantificação de resíduos e rendimento no desdobro de Araucaria angustifolia (Bertol.) O. Kuntze. Floresta 37(3):387-397. [ Links ]
Wang, S. Y., Ch. J. Linand Ch. and M. Chiu. 2003. Effects of thinning and pruning on knots and lumber recovery of Taiwania (Taiwania cryptomerioides) planted in the Lu-Kuei area. Journal of Wood Science 49:444-449. [ Links ]
Zavala Z., D. 1981. Analysis of the sawmilling practices in the State of Durango, México. Thesis of Master of Science. The University of British Columbia, Vancouver, BC, Canada. 91 p. [ Links ]
Zavala Z., D. 1987. Análisis del coeficiente de aprovechamiento en dos aserraderos del Estado de Tlaxcala. Reunión de Investigación Forestal y Agropecuaria de Tlaxcala. Inifap. CIFAPTLAX. Tlaxcala, Tlax., México. pp. 52-62. [ Links ]
Zavala, D. 1996. Coeficiente de aprovechamiento de trocería de pino en aserraderos banda. Revista Ciencia Forestal en México 21(79):165-181. [ Links ]
Zavala Z., D. y C. R. Hernández. 2000. Análisis del rendimiento y utilidad del proceso de aserrío de trocería de pino. Madera y Bosques 6(2):41-55. [ Links ]
Zhang, S. Y. and Y. Lei. 2006. Modelling the relationship of tree- level product value with tree characteristics in Black Spruce. Forest Chronicle 82(5): 690-699. [ Links ]
b Contribution by author: Rolando Orozco Contreras: design of the research and site location, field data collection, their processing and analysis, writing of the manuscript; José Ciro Hernández Díaz: design of the research and writing of the manuscript; Juan Abel Nájera Luna: discussion of results; Pedro Antonio Domínguez Calleros: design of the research and writing of the manuscript; José Rodolfo Goche Telles: design of the research and support in writing of the manuscrip; Pablito Marcelo López Serrano: statistical analysis and writing of the manuscript; José Corral Rivas: help in the design of the research, statistical analysis and writing of the manuscript.
Received: July 06, 2016; Accepted: August 21, 2016
 Este es un artículo publicado en acceso abierto bajo una licencia Creative Commons
