


Serviços Personalizados
Journal
Artigo
 texto em
  Inglês (pdf)
 Artigo em XML
 Referências do artigo
 Enviar este artigo por email
Indicadores
-
 Citado por SciELO
 -
 Acessos
Links relacionados
-
 Similares em
SciELO
Similares em
SciELO
Compartilhar

 Permalink
Revista mexicana de ciencias forestales
versão impressa ISSN 2007-1132
Rev. mex. de cienc. forestales vol.6 no.32 México Nov./Dez. 2015
Article
Odocoileus virginianus couesi (Coues & Yarrow, 1875) habitat-density ratio in Sierra del Laurel, Aguascalientes
1Cuerpo Académico Desarrollo Sustentable. Universidad Autónoma Indígena de México.
2Postgrado en Botánica. Colegio de Postgraduados. Campus Montecillo.
3Postgrado en Estadística. Colegio de Postgraduados. Campus Montecillo.
4Postgrado en Hidrociencias. Colegio de Postgraduados. Campus Montecillo.
The Coues deer (Odocoileus virginianus couesi) is one of the 14 subspecies of white-tailed deer in Mexico and its distribution area encompasses 30.4 % of the Mexican Republic and it has a high cinegetic value. A research was carried out in Sierra del Laurel, in the municipality of Calvillo, Aguascalientes, Mexico, on the density of the white-tailed deer in response to the characteristics of the habitat, estimated by means of the count of fecal pellet groups. The habitat was characterized by its topographic and floral-structural traits and by availability of water. The density was determined to be higher in the subtropical shrubland, followed by that of the Quercus forest and of the induced grassland. The variables which accounted for the abundance of this deer species were vegetation type, Pielous equity index, Simpson's predominance index, the density of Ipomoea muruco'des, the floral wealth and the mean height of the shrubs, and the percentage of naked soil. However, the existence of other demographic factors of the dear, such as the sex ratios, as well as anthropic factors including the fragmentation of the habitat, overgrazing, furtive hunting, the presence of hikers and the proliferation of constructions for ecotourism cannot be discarded as possible causes of a larger abundance of this cervid in the subtropical shrubland; therefore, further studies on this topic are required.
Key words: Calvillo; cervid; fecal pellet groups; subtropical shrubland; generalized linear model; white-tailed deer
El venado de Coues (Odocoileus virginianus couesi ) es una de las 14 subespecies de venado cola blanca en México, se distribuye sobre 30.4 % de la república mexicana y es de alto valor cinegético. Se realizó una investigación en la Sierra del Laurel, municipio Calvillo, Aguascalientes, México, de la densidad del venado cola blanca en respuesta a los atributos del hábitat, estimada mediante el recuento de grupos fecales. El hábitat se describió por sus características topográficas, florístico-estructurales y agua disponible. Se determinó que la densidad fue mayor en el matorral subtropical, seguida de la presente en el bosque de Quercus y del pastizal inducido. Las variables que contribuyeron a explicar la abundancia fueron el tipo de vegetación, el índice de equidad de Pielou , el índice de predominio de Simpson , la densidad de Ipomoea murucoides , la riqueza florística y la altura media de las arbustivas, así como el porcentaje de suelo desnudo. No obstante, la existencia de otros factores demográficos del venado, como la relación de sexos, y de tipo antrópico como la fragmentación del hábitat, el sobrepastoreo, la caza furtiva, la presencia de paseantes y la proliferación de obras para ecoturismo no pueden descartarse como posibles causas de una mayor abundancia de este cérvido en el matorral subtropical, por lo que se requiere de la realización de más estudios sobre el particular.
Palabras clave: Calvillo; cérvido; grupos fecales; matorral subtropical; modelo lineal generalizado; venado cola blanca
Introduction
The Coues deer (Odocoileus virginianus couesi (Coues & Yarrow, 1875) (Ramírez-Pulido, et al, 2005) is one of the 14 subspecies of white-tailed deer in Mexico (Ramírez-Pulido, et al, 2005; Villarreal, 1999). Its distribution area encompasses 30.4 % of the Mexican Republic and has a high cinegetic value (Galindo-Leal and Weber, 1998). It can be found from Arizona, in the United States, to Jalisco, in Mexico, along the Sierra Madre Occidental (Ezcurra and Gallina, 1981). The state of Aguascalientes is part of its territory (Galindo-Leal and Weber, 1998), where furtive hunting placed it on the brink of extinction during the 1970s, at which time the density of the species was 0.65 deer km-2 (Medina-Flores and Medina-Torres, 1989).
Thanks to a surveillance program implemented in 1975 (Medina-Flores and Medina-Torres, 1989; Villalobos, 1989), its populations recovered 20 years later, until they reached a density of 2.00 deer km-2 (Kobelkowsky, 2000). This coincided with the establishment of the first Wildlife Conservation and Management Units (UMAs) for the cinegetic exploitation of the deer.
Surveillance has been restricted to Sierra Fría since 2008; consequently, furtive hunting has continued in the rest of the state, in natural areas such as Sierra del Laurel, where temperate oak forests and subtropical vegetation exist, with patches of induced grasslands (Medina-Torres, 2008; Medina-Torres et al., 2008).
Since 2006, the Comisión Nacional Forestal (Conafor) has given a strong impulse to the establishment and operation of extensive UMAs and ecotourism projects in Sierra del Laurel, a situation which may endanger the population stability of the native deer.
The lack of monitoring and evaluation of the population studies carried out by the owners of the UMAs is a serious problem because it hinders their operation as instruments for conservation and propitiates the overexploitation of the deer and of other wild species (Urquiza, 2009). In the face of this problem, Urquiza (2009) points out the need to "have these studies carried out by the authorities or by independent entities, for there is the potential for a conflict of interests when this responsibility is left to the owners of the UMAs...." Although this poses the dilemma that the environmental authorities should be judge and jury, we must consider that the technicians hired by the owners of the UMAs may find themselves forced to alter the results of population studies in order to meet the demands of their employers, as a result of which the exploitation rates may be overestimated. In the particular case of the white-tailed deer, the explanation for its density in terms of the attributes of its habitat will be of help to foretell the variation of its population in time and space, in case its exploitation is intended or is already taking place.
In Sierra del Laurel, the slope and altitude of the land, the distance to the water, the mean height of the shrub stratum and the density per hectare of Ipomoea murucoides Roem. & Schult and Eysenhardtia polystachya Ortega Sarg. were found to influence habitat selection by the Coues deer, i.e. its presence or absence, whereby a digital map of the likelihood of the use of the habitat by the deer was generated (Medina-Torres et al., 2008). Nevertheless, the relationship between the deer's population density and its habitat remain to be analyzed, as do the attributes of the habitat which affect the variability of this density. For this purpose, the following goals were set: to estimate the population density of the white-tailed deer in Sierra del Laurel, Aguascalientes; to characterize the habitat based on its physical and floral-structural attributes, and to explain the variability of the density of the deer population in terms of the attributes of the habitat.
Materials and Methods
The research was carried out in the year 2006 in Sierra del Laurel, in Calvillo municipality, in southwestern Aguascalientes (Medina-Torres et al., 2008) (Figure 1).

Sierra del Laurel has a surface of 14 610 ha and is located between the coordinates 21°42' and 21°51' N and 102°47' and 102°35' W. It belongs to the physiographic subprovince of Zacatecan Sierras and Valleys and has a rough topography with altitudes varying between 1 700 and 2 760 m. It contains extrusive igneous rocks from the Cenozoic period; in the higher parts, lithosole is the predominant soil type, with depths of under 10 cm, limited by rocks and limestone. In the lower parts, haplic pheozems prevail, characterized by moderate fertility and by a dark, soft layer rich in organic matter and nutrients (Medina-Torres, 2008; Inegi, 2009). The creek beds drain toward the Gil-Malpaso-Calvillo river system, belonging to the tributary hydrological system of the sub-basin of the Juchipila river, which is part of the 12th hydrological region.
In higher parts, the climate is subhumid temperate, with summer rains (C (w)), while toward the lower parts of the Huajucar Valley, the climate is semi-warm semi-dry (BS1h). In the Eastern area, toward the Aguascalientes valley, the climate is warm semi-dry (BS1k) (García, 1998; Inegi, 2009). The annual precipitation is 615 mm, according to the historical average documented between 1960 and 2008 (Medina-Torres et al., 2008).
Three types of vegetation have been identified: oak forest, subtropical shrubland, and induced grassland. Livestock exploitation is the main economic activity, although there are some agricultural areas -namely guava orchards- toward the lower parts (Medina-Torres et al., 2008).
Population density of Odocoileus virginianus couesi
In order to obtain a conservative estimate of the population density and avoid overestimations, the defecation rate of 25 deer fecal pellet groups per day determined by López-Téllez et al. (2007) was utilized. This was compared with estimates from similar studies performed in Mexico (Gallina, 1990; Mandujano and Gallina, 1995; Ortíz-Martínez et al, 2005), 15.2 (Zavala, 1992, cited by Ortíz-Martínez et al, 2005) and 22.0 (Galindo-Leal and Weber, 1998).
The establishment of the plots (initial count and subsequent clearing) began in February and continued until May 2006, since habitat variables were measured in some of them. A time since deposition of 120 days previous to the establishment of the plots was considered, in order to meet the basic assumption of the method of Eberhardt and Van Etten (1956): that only those pellet groups deposited after the fall of the leaves are to be counted. As the establishment of the plots advanced, the elapsed days were added to the time of the deposit, so that the number of days varied between 120 and 219. The second revision took place in June and July 2006, and the time since deposition of the accumulated pellet groups was 55 to 122 days. Because that year the rains were delayed until August, it was assumed that no significant loss of excreta due to rain runoff had occurred.
The population density was estimated by counting the pellet groups in circular 9.3 m2 plots (Eberhardt and Van Etten, 1956), as this size represents a balance between the sample variance (diminishing) and the sample bias (increasing), in relation to the increase in plot size (Smith, 1968).
A pellet group was defined as a set of five excreta with similar characteristics (Gallina, 1990) found scattered along not more than 60 linear cm. The basic sample was based on lines or transects of 200 m each, for a total of 30 lines, on each of which six parcels were disposed, separated by a distance of 40 m or transects each, adding up to 180 parcels: 13 in an oak forest, 10 in a subtropical shrubland, and seven in induced grasslands. The existence of pellet groups within a radio of 1.72 m was verified in each parcel, starting from its georeferenced center, with a location error of 3 m. A stratified random sampling model was used (Gómez-Aguilar, 1979), to attain 30 % accuracy and a confidence of 93.0 %, values that are appropriate, given the human and material resources that were available for the research. It is worth mentioning that during the second revision six parcels belonging to two lines were not located, due to loss of the utilized marks, and therefore were not included in the statistical analysis.
In order to test whether or not the estimated deer density had varied between the two sampling stages, and given that there is no normalcy in the data because these are derived from counts, Wilcoxon's range test was used. The population density was estimated by the model:
Where:
D = Density of deer per km2
NP = 107 526.88 plots per km2
PG = Average pellet groups per plot
TP = Time since deposition of the pellet groups
TD = Defecation rate (pellet groups per deer per day) (Eberhardt and Van Etten, 1956)
Because the pellet groups have an aggregate spatial distribution, the following equation was used to estimate the standard error for the model of a negative binomial distribution (Ezcurra and Gallina, 1981):

Where:
x = Sampling mean of pellet group per plot
k = Coefficient of the negative binomial distribution
n = Number of samples
The coefficient was estimated using the expression:
Where:
Characterization of the habitat
The topographic variables, water availability and floral-structural traits of the habitat were the predictive variables in the logistic regression models utilized for modeling the habitat selection by the Coues deer in Sierra del Laurel (Medina-Torres et al., 2008), and its values were averaged by transect. Each vegetal community was characterized based on these.
The methodologies and procedures to obtain the topographic variables, the availability of water, and the flower-structural traits of the habitat are described in detail in Medina-Torres et al. (2008).
The diversity, equity and predominance of vegetal species were estimated based on the data obtained for each sampling unit and using the Bio-Dap® software (Thomas and Clay, 2005). Shannon's diversity index (H') expresses the uniformity of the important values across the plant species in the sample, under the assumption that the individuals are selected at random and that all taxa are represented in the sample. It acquires values that range between zero, when there is a single taxon, and the logarithm of S (number of species), when all the species are represented by the same number of individuals (Magurran, 1988). This index was estimated using the following equation:
Where:
pi = Proportion of individuals of species i in relation to the total number of individuals (i.e. the relative abundance of species i;
n = Number of individuals of the i th species
The equity was estimated using Pielou's index (E), which measures the proportion of the observed diversity in relation to the maximum expected diversity:
Where:
Its value ranges from 0 to 1; the maximum value indicates that all the species are equally abundant (Magurran, 1988).
Predominance was determined by using Simpson's index (λ), which calculates the probability that two individuals selected at random from a sample belong to the same species. This index is strongly influenced by the importance of the most predominant species (Peet, 1974; Magurran, 1988). Its value ranges from 0 to 1; 1 corresponds to situations in which all the species are equally represented (Magurran, 1988):
Where:
A multivariate analysis using the main components technique (MCT) made it possible to reduce the 29 variables of the habitat and to verify the groupings of the lines by vegetation type, thus allowing determination of the variables that contributed to account for the highest possible variation in a three-dimensional space given by the first three resulting main components. Because the variables were measured using different units, a correlation matrix was utilized (Johnson, 2000).
Relationship between deer density and the attributes of the habitat
Due to the attributes of the habitat which account for deer density and to the fact that the counts do not follow a n orm al distribution, a generalized liner model was applied (Pozo-Montuy, 2006) to a negative binomial distribution with a logarithmic link function, for which the response variable was the rounded-off number of deer km-2; the factors corresponded to the vegetation types, and the covariables, to the attributes of the habitat. This procedure was used to test the hypothesis that deer density did not vary between the three studied vegetation types. The parameters of the model were estimated using Fisher's method, and the effects of the factor and covariables of the model were assessed using Wald's statistical Chi square. Paired contrasts were analyzed in order to test the hypothesis that vegetation types did not differ in deer density, at a significance level of p = 0.05. The proportion of the total variation in deer density accounted for by the type of habitat was determined based on the comparison between the deviance of the null model and the residual deviance D2 = (deviance of the null model - residual deviance) / deviance of the null model x 100.
The analysis was begun with a model that included the factor (vegetation types) and all the covariables, and it was repeated excluding the non-significant variables until the most parsimonious model -i.e. the model with the lowest number of significant variables- was attained. The Bayesian information criterion (BIC) made it possible to select the best model, for which the lowest value was preferred.
Results
Pellet groups per plot
91 fecal pellet groups were counted in 96 of the 180 sampling units, 63 of which were registered during the establishment of the plots, and 28 during the second count. The mean for the groups was 0.35 ± 0.09 and 0.16 ± 0.04, respectively. The overall mean was 0.33 ± 0.06 groups per plot.
Deer density
The 95 % confidence interval for deer density ranged between 5.0 and 11.6 deer per km2, with an estimated stratified mean of 8.3 for the study area. The density did not vary significantly between both sampling stages, according to Wilcoxon's range test (Z = -0.581, p = 0.561); therefore, only the average deer density was considered.
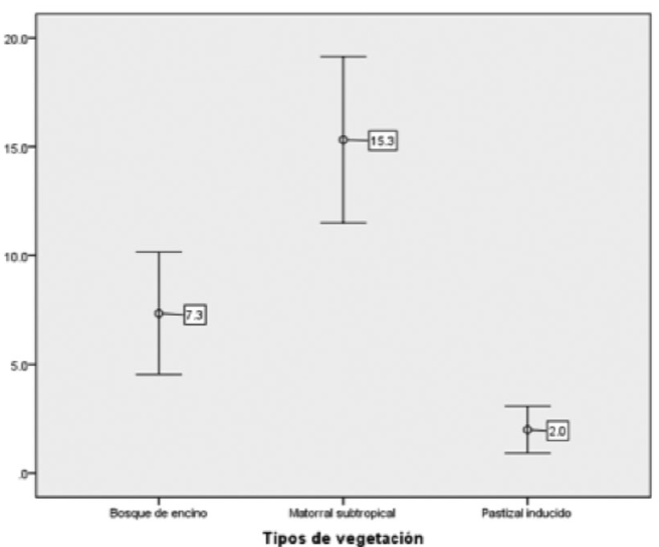
The generalized linear model showed highly significant differences between the three habitats (x2Wald = 77.642, df = 2, p = 0.000). The contrast analysis confirmed a significant variation in deer density between vegetation types (Table 1). The highest density was found in the subtropical shrubland, followed by the Quercus forest and the induced grassland (Figure 2).
Table 1 Contrasts of the differences in the means of the average density of the white-tailed deer by vegetation type.

Habitat characterization
The third first main components accounted for 66.8 % of the total variation. The first component (MC 1) amounted to 37.1 % of the total, and the variables with the highest positive charge in their coefficients were tree canopy cover, tree density, site altitude, baseline area and average tree height -characteristic attributes of well-developed arboreal strata of the Quercus forest. Conversely, the coefficients with the highest negative charge for this component were shrub canopy cover, shrub density, tree/shrub density per site, and I. murucoides density, i.e. characteristic attributes of the subtropical shrubland.
The second main component (MC 2) accounted for 20.4 % of the total variation. The variables with the highest weight on positive coefficients were Shannon's index (H ) and the total floral wealth, whereas the variable with the highest negative weight was Simpson's predominance index (λ). The third main component (MC 3) accounted for 9.3 % of the total variation, and the variable with the highest weight on positive coefficients was the percentage of topsoil, whereas soil rockiness had the highest weight on negative coefficients (Figure 3).

Relationship between deer density and the attributes of the habitat
Exclusion of the non-significant variables from the initial analysis generated the most parsimonious model and the one with the best adjustment (BIC = 562.24), in which seven variables proved to be highly significant (p<0.01), accounting for little more than 45 % of the variability of deer density (D2 = 45.82 %; Table 2). The model corresponds to equation 1:
Where:
DV = Deer density km2 -1
β i = Variable parameter
x1 = Vegetation type
x9 = Pielou s equity index
x10 = Simpson's predominance index
x13 = I murucoides tree density per ha
x18 = Floral wealth of the arboreal stratum
x24 = Average height of the shrub stratum
x28 = Naked soil percentage
ε i . = Error
Table 2 Coefficients of the variables accounting for white-tailed deer density in Sierra del Laurel , Aguascalientes .
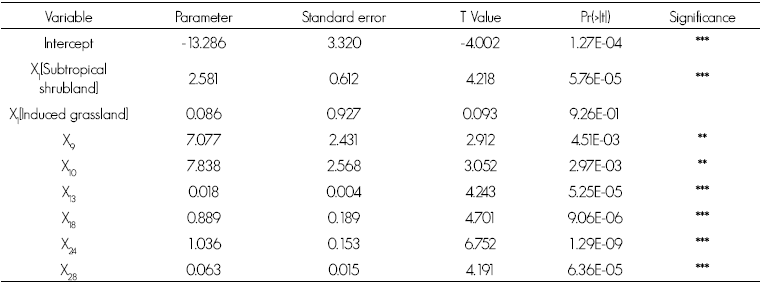
Significance: *** = < 0.001; ** = 0.001; * = 0.01; ns = 0.05
Deviance of the null model = 836.87, with 179 degrees of freedom
Residual deviance = 764.93, with 177 degrees of freedom
Bayesian information criterion = 562.24.
Discussion
Deer population density
The population estimation, compared with those obtained by other authors in similar habitats in Sierra del Laurel, suggests that there tends to be a higher deer density in locations with deciduous vegetation than in temperate forests, with the exception of La Michilía, Durango (Gallina, 1990), although, according to Galindo-Leal and Weber (1998), the same region registered lower deer densities in later years (Table 3).
Table 3 Comparison between the white-tailed deer densities and those found in this study.
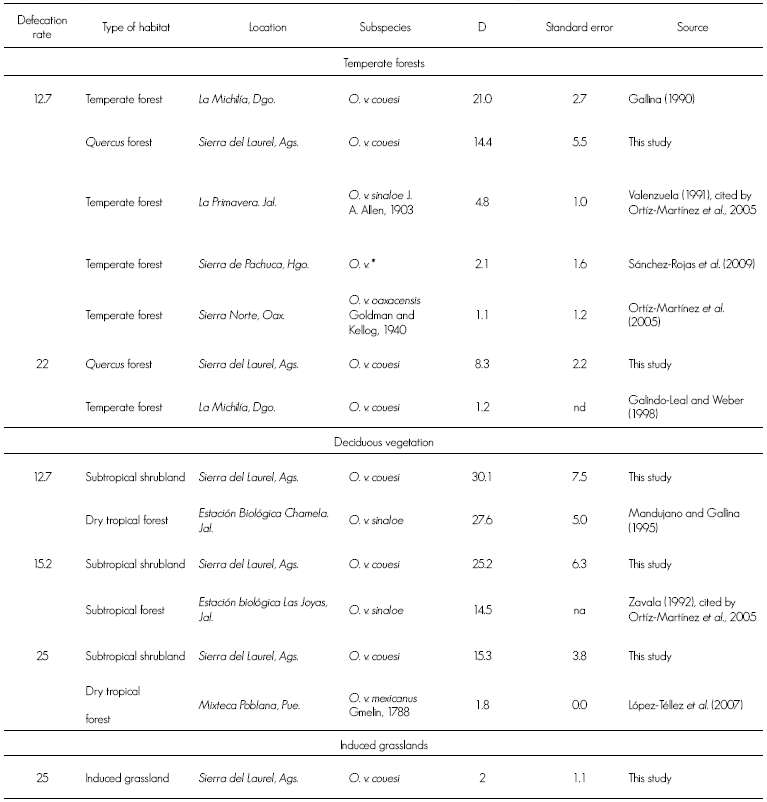
* = Possibly O. v. mexicanus ; na = Not available; D = Deer per km2.
Another important consideration is the randomization of the sampling units, for, if this condition is not guaranteed, it may originate biases that will question or invalidate the results, a situation which has even brought about serious controversies among researchers (Galindo-Leal, 1992; Gallina and Ezcurra, 1992).
In the case of this study, the establishment of sampling lines guarantees the validity of the obtained results. An advantage to be considered is that mensuration studies of forest inventories may provide data from the excreta of the deer and, thus, may make it possible to carry out an analysis of the habitat selection.
Habitat characterization
The usefulness of the main component analysis as a preliminary procedure for the revision of the multivariate data of the habitat lies not only in that it verifies the classification of sampling units and identifies anomalous data but also allows a first a priori approximation to qualitatively detect potential associations between the formed groupings (habitats) and their respective estimations of the population density of white-tailed deer, within a bi- or three-dimensional space of the sampling units, regardless of whether the first two (Ortíz-Martínez et al., 2005; López-Téllez et al., 2007) or three main components are used, though the former case is the more usual one.
The present study shows that the variability of the attributes of the habitat are accounted for by a reduced number of variables related to the arboreal, shrub or herbaceous strata, as well as to the degree of equity in each vegetal community. It also made it possible to know what percentage of the total variability of the habitat results from the first three main components (66.8 %), a percentage that is very close to that registered by López-Téllez et al. (2007) in a dry tropical forest in the Pueblan Mixteca (67 %), and higher than that quoted by Ortíz-Martínez et al. (2005) in a temperate forest of Oaxaca (64 %), and by Sánchez-Rojas et al. (2009) in a similar habitat in the Sierra de Pachuca, Hidalgo (58.6 %).
Relationship between deer density and the attributes of the habitat
Although some authors have pointed out the apparent relationship between the groupings generated by a main component analysis (MCA) and the deer densities registered in these (Ortíz-Martínez et al, 2005; López-Téllez et al, 2007), such relationship is not a conclusive evidence for management purposes, and the parameter statistics do not generate reliable inferences. This research showed that generalized linear models offer a reasonable solution for understanding the variation in deer density due to the attributes of their habitat. This is particularly important when the population density of the deer is estimated using indirect techniques, such as the count of fecal pellet groups by plots, which by nature do not have a normal distribution but follow a negative binomial aggregate distribution (Ezcurra and Gallina, 1981), which prevents the use of conventional parameter statistical techniques.
The utilized method generated a parsimonious model with only seven out of a total of the 29 initially considered variables. It is important to highlight that two of the three floral-structural variables which accounted for the habitat selection by the deer in Sierra del Laurel -number of I. mucoroides trees ha-1 and average height of the shrub stratum- also accounted for the variation in their density (Medina-Torres et al., 2008).
The analysis of the coefficients of the variables (Table 3) shows that, of the three studied vegetation types, only the induced grassland did not account for the deer density. Likewise, it stresses that the intercept, which summarizes the effect of the oak forest on deer density, is significant and negative, which confirms that the density in this habitat is lower in relation to the subtropical shrubland, a similar result to that quoted by other authors in temperate forests (Valenzuela, 1991, cited by Ortíz-Martínez et al, 2005; Galindo-Leal and Weber, 1998; Ortíz-Martínez et al., 2005) or in deciduous vegetation (Zavala, 1992, cited by Ortíz-Martínez et al, 2005; Mandujano and Gallina, 1995) (Table 3).
The coefficients of the other variables were positive and highly significant, showing that deer density will grow as these attributes increase. It is worth pointing out that the highest values are characteristic of the subtropical shrubland and that, as a whole, they may be considered to explain the higher density of white-tailed deer in Sierra del Laurel in this type of vegetation.
For instance, high values for the equity index correspond to sites in which the observed vegetal distribution is close to the maximum expected, an indication that deer are more abundant in habitats with equally represented vegetal species. This contrasts with Simpson's predominance index, higher values of which correspond to sites with few predominant species, which may be a reflection of the apparent prevalence of I. murucoides in sites with the highest deer density. Although the positive coefficient of I. murucoides density was one of the lowest values (possibly a less intense effect than that of other variables of the model on deer density), it is important to highlight that its presence among the explicative variables suggests a dependence of deer density on the density of this tree, which is so characteristic of the subtropical shrubland, and that it is even possible that the low density of I. murucoides in sites with a high wealth and diversity of vegetal species may be a limiting factor for the presence of deer. The blossom of I. murucoides has been documented to have 76.25 % moisture and to be available during the flowering period, between December and March, and therefore it may serve as a source of water in environments similar to the subtropical shrubland of Sierra del Laurel (Villarreal and Marín-Fuentes, 2005). It is possible that, in this mountain range, where recurring droughts are frequent and permanent watercourses are inexistent, the deer may meet its need for this vital fluid by consuming the blossom of I. murucoides (Medina-Torres et al, 2008).
Another variable of the undergrowth which also helps to understand the deer density was the percentage of naked soil; however, there seems to be no ecological explanation to endorse that apparent preference for soils devoid of humus and vegetation. In fact, this may be interpreted as a bias caused by the easy detection of excreta on naked soils, and therefore its effect on deer density must be regarded with caution.
Two more attributes of the subtropical shrubland proved to be highly significant in the generalized linear model: the floral wealth of the arboreal stratum and the average height of the shrub stratum, which is associated to the availability of food and thermal and escape cover. Given that Sierra del Laurel stands out for its extreme climate and its long droughts (Medina-Torres, 2008), deer require a particularly dense vegetation to provide food and protection against inclement temperatures, as well as a shelter or escape ways from its predators (Galindo-leal and Weber, 1998; Bello and Equihua, 2001 ; Ortíz-Martínez et al, 2005). Medina-Torres et al. (2008) register that the medium height of the shrub stratum for a probability of use above 0.5 should be at least 2 m.
It has already been pointed out that the apparent selection of the subtropical shrubland by the deer might be due to pressures and threats against its population. Other anthropic factors threatening the deer were identified though not analyzed at depth. It is evident that the induced grassland is the product of clearing and of overgrazing; its spatial distribution suggests an alarming fragmentation process which should be the object of new research. The subtropical shrubland was the habitat "selected" by the deer, which, however, were possibly fleeing from threats (e.g. fragmentation of their habitat, overgrazing, furtive hunting and presence of hikers), rather than seeking satisfaction of their basic needs (Medina-Torres, 2008). Furtive hunting has increased in the years after this study was carried out, and given the roughness of the terrain, hunters often venture into the area on foot or on horseback into the Sierra, in the morning and in the afternoon, forcing the deer to withdraw into the densest shrublands.
Other factors to be considered in subsequent studies to explain the deer density in the subtropical shrubland are related to the demography of the species. The fact that there is a larger proportion of females among the deer population results an increase in fawn production, with the consequent overload of the habitat. Migrants who reside in the United States and come in December and January to visit their families in the Calvillo municipality often hunt male deer.
However, even the subtropical shrubland, which as a habitat appears to meet the needs of the deer, faces threats. Siqueiros-Delgado et al. (2006) mention that this vegetation type is among the most affected by farming development in Sierra de Laurel, the expanse of which has been reduced as a result of changes in the use of the land for the establishment of guava or blue agave crops or for stockbreeding. Livestock breeders have been documented to eliminate the subtropical shrubland and to affect the quality of the deer's habitat. According to González-Alaníz (1997), I. murucoides is toxic for livestock, and therefore producers eradicate it using herbicides. In October 2006, the Procuraduría Estatal de Protección al Ambiente del estado de Aguascalientes (PROESPA) documented the felling of up to 83 % of the I. murucoides trees in over 100 ha in Calvillo municipality and the elimination of all the shrubs of this species.
Conclusions
Deer density varied significantly between the three existing vegetation types in Sierra del Laurel during the dry season of 2006, the highest density occurring in the subtropical shrubland, followed by the Quercus forest and by the induced grassland. The variables which accounted for the variability in deer density were the vegetation type, Pielou's equity index, Simpson's predominance index, I. murucoides tree density, the floral wealth of the arboreal stratum, and the average height of the shrub stratum.
Habitat fragmentation due to the opening of the land to new crops, overgrazing, furtive hunting, the affluence of hikers, and the proliferation of infrastructure for ecotourism projects cannot be dismissed as factors of pressure on the deer; therefore, further studies are required in order to confirm or dismiss that such factors influence the density of the species in the subtropical shrubland.
Likewise, more in-depth demographic studies are necessary to gain knowledge of the sex ratio and age classes in order to evaluate the reproductive success of the species, possibly through photo-trapping.
Conflict of interests
The authors declare no conflict of interests.
Contribution by author
Martin Salvador Medina Torres: selection of sampling units in the field, background documentation, preparation of the manuscript; Edmundo García Moya: analysis of the relationship - density deer habitat, structure and revision of the manuscript; Marcelo Márquez Olivas: monitoring of population sampling, structuring and revising the manuscript; Angelica Romero Manzanares: obtaining indicators of richness, diversit, equity and plant dominance and revising the manuscript; Humberto Vaquera Huerta multivarido statistical analysis and generalized linear model; Mario Martinez Menes construction of GIS and geo -referencing of the sampling frame.
Acknowledgements
The first author wishes to express special gratitude to the Consejo Nacional de Ciencia y Tecnología (Conacyt) for its support during this research through a doctoral scholarship. Likewise, we are particularly grateful to the staff of the Servicio de Guardabosques de la Procuraduría Estatal de Protección al Ambiente de Aguascalientes, as well as to Santos Muñoz Macías, for his guidance and assistance during the field expedition, and to biologist Gabriela Delgadillo Quezada, for recording and processing the information.
REFERENCES
Bello, J. S. G. and M. Equihua. 2001. Characterization and habitat preferences by white-tailed deer in Mexico. Journal of Range Management 54:537-545. [ Links ]
Eberhardt, L. and R. Van Etten. 1956. Evaluation of the pellet group count as a deer census method. Journal of Wildlife Management (20):70-74. [ Links ]
Ezcurra, E. and S. Gallina. 1981. Biology and population dynamics of white-tailed deer in northwestern Mexico. : Ffolliott, F. y S. E. Gallina (eds.). Deer biology, habitat requirements, and management in western North America. Instituto de Ecología. México, D. F., México. pp. 77-106. [ Links ]
Galindo-Leal, C. 1992. Overestimation of deer densities in Michilia Biosphere Reserve. Southwestern Naturalist 37:209-212. [ Links ]
Galindo-Leal, C. y M. Weber. 1998. El Venado de la Sierra Madre Occidental. Ecología, manejo y conservación. EDICUSA - Conabio. México, D. F., México. 272 p. [ Links ]
Gallina, S. 1990. El venado cola blanca y su hábitat en la Michilía, Dgo. Tesis de maestría. Facultad de Ciencias. Universidad Nacional Autónoma de México. México, D. F., México. 130 p. [ Links ]
Gallina, S. and E. Ezcurra. 1992. Deer densities in la michilia: a reply to Galindo. The Southwestern Naturalist 37(4):422-424. [ Links ]
García, E. 1998. Modificaciones al sistema de clasificación climática de Köppen. Climas. Serie Libros. Instituto de Geografía. Universidad Nacional Autónoma de México. México, D. F., México. Número 6. 91 p. [ Links ]
Gómez-Aguilar, R. 1979. Introducción al Muestreo. Tesis de maestría en ciencias en estadística. Colegio de Posgraduados. Centro de Estadística y Cálculo. Montecillo, Texcoco, Edo. de Méx., México. 260 p. [ Links ]
González-Alaníz, M. H. 1997. Evaluación de los agostaderos de Aguascalientes y su potencial de mejoramiento. Gobierno del Estado Aguascalientes. Aguascalientes, Ags., México. Cuadernos de Trabajo Agricultura y Recursos Naturales Núm. 65. 44 p. [ Links ]
Instituto Nacional de Estadística, Geografía e Informática (Inegi). 2009. Sistema para la consulta del anuario estadístico de Aguascalientes 2009. Instituto Nacional de Estadística, Geografía e Informática y Gobierno del Estado de Aguascalientes. Aguascalientes, Ags., México. 521 p. [ Links ]
Johnson, D. E. 2000. Métodos multivariados aplicados al análisis de datos. Internacional Thomson Editores. México, D. F., México. 566 p. [ Links ]
Kobelkowsky, R. S. 2000. Evaluación del hábitat y estructura de la población de venado cola blanca (Odocoileus virginianus ) en la región central de la Sierra Fría, Aguascalientes. Tesis de maestría. Colegio de Postgraduados. Montecillo, Texcoco, Edo. de Méx., México. 87 p. [ Links ]
López-Téllez, M. C., S. Mandujano y G. Yánes. 2007. Evaluación poblacional del venado cola blanca en un bosque tropical seco de la Mixteca Poblana. Acta Zoologica Mexicana 23(3):1-16. [ Links ]
Magurran, A. E. 1988. Ecological diversity and its measurement. Princeton University Press. Princeton, NJ, USA. 178 p. [ Links ]
Mandujano, S. and S. Gallina.1995. Comparison of deer censusing methods in a tropical dry forest. Wildlife Society Bulletin 23:180-186. [ Links ]
Medina-Flores, J. A. y S. M. Medina-Torres. 1989. Avances en materia de protección dentro del programa de conservación y aprovechamiento cinegético del venado cola blanca en Aguascalientes. : Roa-Riol, M. A., J. G. Villarreal-González y P. U. Dietrich. III Simposio sobre Venados en México. UANL- UNAM. Linares, N. L., México. pp. 135-146. [ Links ]
Medina-Torres, S. M. 2008. El venado cola blanca (Odocoileus virginianus couesi ) y su hábitat en la Sierra del Lauel, Aguascalientes. Tesis de doctorado. Colegio de Postgraduados Campus Montecillo. Programa de Postgrado en Botánica. Montecillo, Texcoco, Edo. de Méx., México. 264 p. [ Links ]
Medina-Torres, S. M., E. García-Moya, M. Márquez-Olivas, H. Vaquera-Huerta, A. Romero-Manzanares y M. Martínez-Menes. 2008. Factores que influyen en el uso del hábitat por el venado cola blanca (Odocoileus virginianus couesi ) en la Sierra del Laurel. Acta Zoologica Mexicana 24(3):191-212. [ Links ]
Ortíz-Martínez, T., S. Gallina, M. Briones-Salas y G. González. 2005. Densidad poblacional y caracterización del hábitat del venado cola blanca (Odocoileus virginianus oaxacensis , Goldman y Kellog, 1940) en un bosque templado de la Sierra Norte de Oaxaca, México. Acta Zoologica Mexicana 21(3):65-78. [ Links ]
Peet, R. K. 1974. The measurement of species diversity. Annual Review of Ecology Evolution and Systematics 5: 285-307. [ Links ]
Pozo-Montuy, G. 2006. Efecto del uso del suelo sobre la configuración del paisaje, la distribución y la abundancia del mono aullador negro (Allouata pigra) en el municipio de Balancán, Tabasco. Tesis de maestría. Instituto de Ecología. Xalapa, Ver., México. 56 p. [ Links ]
Ramírez-Pulido, J. A., J. Arroyo-Cabrales y J. Castro-Campillo. 2005. Estado actual y relación nomenclatural de los mamíferos terrestrtes de México. Acta Zoológica Mexicana 21(1):21-82. [ Links ]
Sánchez-Rojas, G., C. Aguilar-Miguel y E. Hernández-Cid. 2009. Estudio poblacional y uso de hábitat por el venado cola blanca (Odocoileus virginianus ) en un bosque templado de la Sierra de Pachuca, Hidalgo, México. Tropical Conservation Science 2(2):204-214. [ Links ]
Siqueiros-Delgado, M., G. García-Regalado y M. de la Cerda-Lemus. 2006. Selva baja caducifolia o matorral subtropical en el estado de Aguascalientes, México. Memoria. Contribuciones presentadas en la modalidad de cartel. Congreso Mexicano de Ecología. 26-30 de noviembre de 2006. Morelia, Mich., México. 127 p. [ Links ]
Smith, R. H. 1968. A comparison of several sizes of circular plots for estimating deer pellet-group density. Journal of Wildlife Management 32(3):585-591. [ Links ]
Thomas, G. and D. Clay. 2005. Bio-Dap - ecological diversity and its measurement. Resource Conservation Fund and National Park. New Brunswick, Canada. http//nhsbig.inhs.uiuc.edu/wes/populations.html (24 de junio de 2014). [ Links ]
Urquiza-Haas, E. G. 2009. Análisis de las capacidades nacionales para la conservación in situ. : PNUD (coords.). México: capacidades para la conservación y el uso sustentable de la biodiversidad. Comisión Nacional para el Conocimiento y Uso de la Biodiversidad y Programa de las Naciones Unidas para el Desarrollo. México, D. F., México. pp. 65 - 73. [ Links ]
Villalobos, S. V. 1989. El venado cola blanca en la Sierra Fría de Aguascalientes. : Gobierno del Estado de Aguascalientes. (ed.). Oficina de coordinación de asesores, Cuadernos de trabajo. Agricultura y recursos naturales. Aguascalientes, México. Gobierno del Estado de Aguascalientes. Aguascalientes, Ags., México. 73 p. [ Links ]
Villarreal E. B., O. A. y M. M. Marín-Fuentes. 2005. Agua de origen vegetal para el venado cola blanca mexicano. Archivos de Zootecnia 54:191-196. [ Links ]
Villarreal G., J. G. 1999. Venado cola blanca. Manejo y aprovechamiento cinegético. Unión Ganadera Regional de Nuevo León. Monterrey,N. L., México. 401 p. [ Links ]
Received: November 05, 2014; Accepted: August 20, 2015
 Este es un artículo publicado en acceso abierto bajo una licencia Creative Commons
