


Serviços Personalizados
Journal
Artigo
 texto em
  Inglês (pdf)
 Artigo em XML
 Referências do artigo
 Enviar este artigo por email
Indicadores
-
 Citado por SciELO
 -
 Acessos
Links relacionados
-
 Similares em
SciELO
Similares em
SciELO
Compartilhar

 Permalink
Revista mexicana de ciencias pecuarias
versão On-line ISSN 2448-6698versão impressa ISSN 2007-1124
Rev. mex. de cienc. pecuarias vol.14 no.4 Mérida Out./Dez. 2023 Epub 17-Nov-2023
https://doi.org/10.22319/rmcp.v14i4.6410
Articles
Environmental outlook to 2030 in cow's milk production systems in Mexico
a Universidad Autónoma del Estado de México. Instituto de Ciencias Agropecuarias y Rurales. Instituto Literario 100. Centro, 50000, Toluca, Estado de México. México.
b Universidad Autónoma de Chihuahua. Facultad de Zootecnia y Ecología. Chihuahua, México.
c Colegio de Postgraduados. Ganadería. Estado de México, México.
d Universidad Nacional Autónoma de México. Facultad de Medicina Veterinaria y Zootecnia. Ciudad de México, México.
The objective of this study was to evaluate the environmental performance of cow milk production in small and medium scale systems in Mexico, through life cycle analysis with a cradle to farm gate approach, for the period 2021-2030. The established functional unit was 1 kg of milk corrected for fat and protein. The impact assessment was carried out with the OpenLCA 1.11.0 software, using the ReCiPe method, considering seven impact categories: agricultural land occupation (ALO), marine ecotoxicity (ME), human toxicity (HT), climate change (CC), fossil depletion (FD), soil acidification (SA), and water depletion (WD). Among the main results of the research, the production of cattle feed was identified as the chief contributor to environmental loads in most of the categories with percentages above 71 %, while on-farm emissions contribute to the environmental loads for the CC (28 %), FD (26 %) and SA (59 %) categories. A comparison was made between pessimistic, base and optimistic scenarios for the years 2021 and 2030, which confirmed an improvement in environmental efficiency in the optimistic scenario, the increase in production volume represents a decrease of 6 % and 5 %, respectively, in the assessed impact categories.
Keywords Life-cycle analysis; Environmental impact; Sustainability
El objetivo de este estudio fue evaluar el desempeño ambiental de la producción de leche de vaca en sistema de pequeña y mediana escala en México, mediante análisis de ciclo de vida con un enfoque de la cuna a la puerta de la granja, para el periodo 2021-2030. Se estableció como unidad funcional 1 kg de leche corregida por grasa y proteína. La evaluación de impacto se realizó con el software OpenLCA 1.11.0, mediante el método ReCiPe, se consideraron siete categorías de impacto: ocupación de suelo agrícola (ALO), ecotoxicidad marina (ME), toxicidad humana (TH), cambio climático (CC), agotamiento fósil (FD), acidificación terrestre (TA) y agotamiento de agua (WD). Como principales resultados de la investigación se identificó que la producción de alimento para el ganado es el principal contribuyente a las cargas ambientales en la mayoría de las categorías con porcentajes superiores al 71 %, mientras que las emisiones generadas en la granja contribuyen a las cargas ambientales para las categorías CC (28 %), FD (26 %) y TA (59 %). Se realizó una comparación entre escenarios pesimista, base y optimista para los años 2021 y 2030, lo que confirmó una mejora en la eficiencia ambiental en el escenario optimista prospectado, el incremento en el volumen de producción representó una disminución del 6 % y 5 % respectivamente, en las categorías de impacto evaluadas.
Palabras clave Análisis de ciclo de vida; Impacto ambiental; Sostenibilidad
Introduction
Worldwide milk production involves approximately 150 million households. In developing countries, milk production by smallholder farmers is an important source of both nutrition and income for millions of households1. According to FAO, between 80 and 90 % of milk production in developing countries is carried out in small-scale production systems2. Mexico is one of the developing countries with a long tradition of dairy production, ranking 15th in the world among milk-producing countries3.
In Mexico, cow's milk is the third most important livestock product in terms of the economy; in 2021, its output closed with a volume of 12,852 million liters and an economic value of 90,823 million pesos3. 85 % of the dairy herd corresponds to the semi-intensive family system4. This type of system is characterized mainly by having a Holstein cattle herd whose diet includes rainfed forage crops (corn, oats, wheat, triticale, barley, rye, rye grass, and native and introduced grasses), legumes (alfalfa, vetch, and chickpeas), and residues from agricultural plots5.
Semi-intensive family livestock farming is recognized for its socioeconomic importance; however, this activity faces different problems, including low yields in milk production, derived from factors such as genetics, environment, diet6 and climate change. The lack or excess of rainfall and extreme temperatures7 cause a decrease in agricultural production and, therefore, insufficient conditions to maintain livestock production8.
On the other hand, Mexican cattle ranching is associated with the generation of 13.2 % of GHG emissions in the country, which in 2019 amounted to 736.6 million t of CO₂ equivalent9; it is also associated with the degradation of natural resources. The generation of GHG emissions is attributed to low milk yields, inefficient management and feeding practices, and an older age at the first calving10. Environmental issues have increased the interest in identifying mitigation alternatives in different scenarios and productive systems. Baldini et al11 highlight Life-Cycle Analysis as a method to identify and evaluate the environmental burdens associated with milk production.
Environmental impact assessment of milk has been carried out for intensive12-15 and semi-intensive production systems15-18. Some authors indicate that in order to reduce emissions from milk production on small-scale farms it is necessary to produce milk at a larger scale17,19,20.
The objective of this study was to evaluate the environmental performance of cow's milk production in a semi-intensive system in Mexico through life-cycle analysis with a cradle-to-gate approach, for the period 2021-2030.
Material and methods
This study was conducted using the Life-Cycle Analysis (LCA) methodology, in compliance with the principles established by ISO 14040 and 1404421,22, which integrates four phases: definition of objectives and scope; inventory analysis; impact assessment, and interpretation of results.
Product system
The system under study corresponds to milk production in small and medium scale farms in Mexico, considered as a semi-intensive system whose production inventory amounts to 85 % of the national total23,24. It is a very heterogeneous production system with respect to its technological, agroecological, and socioeconomic level25. Small and medium-scale dairy farming is characterized by a small number of animals in the production units26. Out of a total of 257 thousand small- and medium-scale producers, 47.30 % have 30 cows or less27, the milk-producing breeds are mainly Holstein, and the milking is done manually28.
In 2021, the semi-intensive production system had an inventory of 2’579,223 heads of dairy cattle and an output volume of 11’046,795.96 liters of fluid milk. The annual productivity per cow was 4,017 liters, i.e., 13.17 liters per day29.
Definition of objectives and scope
The objective of this study was to evaluate the environmental performance of cow’s milk production in a semi-intensive family system in Mexico in the year 2030. The functional unit was 1 kg of milk adjusted for fat and protein (MAFP). According to the International Dairy Federation (IDF), the use of the MAFP unit ensures a fair comparison with different breeds or feeding regimes30. The weight of raw milk was converted to MAFP using the following equation:
The fat and protein contents were established considering the average of the values established in the book Bovine milk production in the family system in Mexico ("Producción de leche de bovino en el sistema familiar en México"), being 4.5 % and 3.5 %, respectively5.
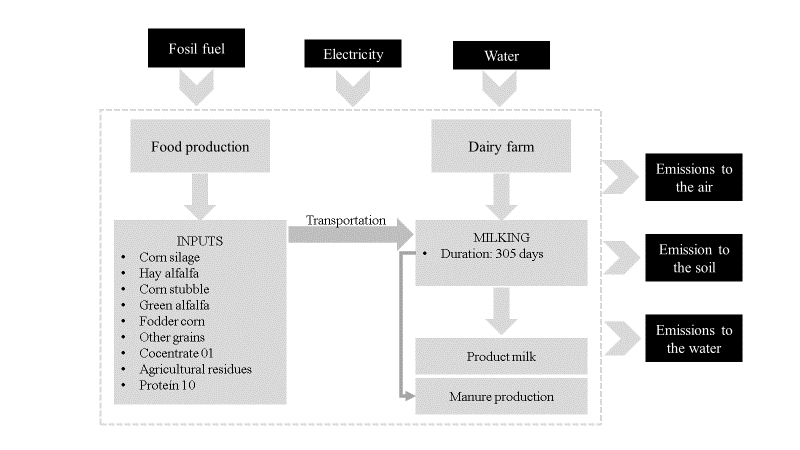
System limits
System boundaries were established considering a cradle-to-gate approach (Figure 1), i.e., from the extraction of raw materials used in cattle feed until the milk is ready to leave the farm. The system considered two main sub-systems: 1) Cow feed production: considers the activities and processes related to the cultivation of fodder crops and legumes. 2) Milk production: considers the activities of transporting feed to the farm and feeding the cows for 305 d corresponding to the milking period31.
Inventory analysis
The study considered data from secondary sources of information. The volume of production and the inventory of heads at the national level were obtained from the database of the Agri-Food Information System for Consultation (Sistema de Información Agroalimentaria de Consulta)29. Inputs used in livestock feed were obtained from scientific books of the National Institute for Research on Forestry, Agriculture, and Livestock (Instituto Nacional de Investigaciones Forestales, Agrícolas y Pecuarias)5,6.
In order to determine the milk production per cow per year, the values corresponding to the volume of national production and the national cattle head inventory were estimated29. The volume of fluid milk output (thousands of liters) in Mexico was forecast for the period 2021-2030, using the univariate statistical method of series (ARIMA)32. Statistical tests, model estimation and forecasts were performed with the Simetar® software.
The probability distribution was used as a risk factor to determine the minimum and maximum of the milk volume and price series. These confidence intervals were used to construct the pessimistic (lower interval), baseline (mean), and optimistic (upper interval) scenarios. Milk volumes were calculated by production system (barns with an average of 8 cows); the volume of production per cow per day and per year was calculated considering a 305-d lactation period (Table 1).
Table 1 Production parameters for the semi-intensive system in the pessimistic, baseline and optimistic scenarios
| 2021 | 2030 | |||||
|---|---|---|---|---|---|---|
| Pessimistic | Baseline | Optimistic | Pessimistic | Baseline | Optimistic | |
| Liters of cow’s milk/305 d | 3,745 | 4,017 | 4,267 | 3,724 | 3,944 | 4,166 |
| Liters of cow’s milk/d | 12.28 | 13.17 | 13.99 | 12.21 | 12.93 | 13.66 |
| Kg of cow’s milk/305 d (MAFP) | 4,033 | 4,325 | 4,594 | 4,010 | 4,246 | 4,486 |
| Kg of cow’s milk/d (MAFP) | 13.22 | 14.18 | 15.06 | 13.16 | 13.92 | 14.71 |
MAFP= milk adjusted for fat and protein.
Table 2 shows the various proportions of the dietary ingredients used in the feeding of the cows.
Table 2 Main ingredients of the diet used for feeding cows in a semi-intensive system
| Inputs | Average ingredients per year (kg) | % |
|---|---|---|
| Corn silage | 65,450 | 25.81 |
| Hay alfalfa | 212 | 0.08 |
| Corn stubble | 34,277 | 13.52 |
| Green alfalfa | 133,057 | 52.47 |
| Fodder corn | 2,399 | 0.95 |
| Other grains | 1,938 | 0.76 |
| Concentrate 01 | 5,021 | 1.98 |
| Agricultural residues | 8,445 | 3.33 |
| Protein 10 | 2,780 | 1.10 |
| Total | 253,579 | 100.00 |
The inventory for the production of 1 kg of milk - MAFP was integrated according to the above information. (Table 3).
Table 3 Inventory per 1 kg of milk -MAFP produced in semi-intensive system
| 2021 | 2030 | |||||
|---|---|---|---|---|---|---|
| Pessimistic scenario | Baseline scenario | Optimistic scenario | Pessimistic scenario | Baseline scenario | Optimistic scenario | |
| S1 | ||||||
| Inputs | ||||||
| Corn silage | 1.96251 | 1.82989 | 1.72263 | 1.97376 | 1.86385 | 1.76424 |
| Hay alfalfa | 0.00636 | 0.00593 | 0.00558 | 0.00639 | 0.00604 | 0.00571 |
| Corn stubble | 1.02778 | 0.95832 | 0.90215 | 1.03367 | 0.97611 | 0.92395 |
| Green alfalfa | 3.98968 | 3.72007 | 3.50202 | 4.01255 | 3.78912 | 3.58662 |
| Fodder corn | 0.07194 | 0.06708 | 0.06315 | 0.07235 | 0.06832 | 0.06467 |
| Other grains | 0.05812 | 0.05419 | 0.05102 | 0.05846 | 0.05520 | 0.05225 |
| Concentrate 01 | 0.15055 | 0.14038 | 0.13215 | 0.15142 | 0.14299 | 0.13534 |
| Agricultural residues | 0.25321 | 0.23610 | 0.22226 | 0.25466 | 0.24048 | 0.22763 |
| Protein 10 | 0.08337 | 0.07773 | 0.07318 | 0.08385 | 0.07918 | 0.07495 |
| Outputs | ||||||
| Total, feed | 7.60352 | 7.08969 | 6.67414 | 7.64711 | 7.22129 | 6.83538 |
| S2 | ||||||
| Inputs | ||||||
| Land occupancy (stable) | 0.00216 | 0.00201 | 0.00190 | 0.00217 | 0.00205 | 0.00194 |
| Fuel | 0.01126 | 0.01050 | 0.00989 | 0.01133 | 0.01070 | 0.01012 |
| Electricity | 0.00733 | 0.00683 | 0.00643 | 0.00737 | 0.00696 | 0.00659 |
| Water | 7.56322 | 7.05212 | 6.63877 | 7.60658 | 7.18301 | 6.79915 |
| Feed | 7.60352 | 7.08969 | 6.67414 | 7.64711 | 7.22129 | 6.83538 |
| Outputs | ||||||
| Ammonia | 0.00991898 | 0.00924868 | 0.00870658 | 0.00997585 | 0.00942035 | 0.00891692 |
| Methane from manure management | 0.01835012 | 0.01711005 | 0.01610718 | 0.01845532 | 0.01742764 | 0.01649630 |
| Methane by enteric fermentation | 0.02454948 | 0.02289048 | 0.02154879 | 0.02469022 | 0.02331536 | 0.02206937 |
| Nitrogen | 0.00010911 | 0.00010174 | 0.00009577 | 0.00010973 | 0.00010362 | 0.00009809 |
| Nitrous oxide | 0.00000248 | 0.00000231 | 0.00000218 | 0.00000249 | 0.00000236 | 0.00000223 |
S1= food production subsystem, S2= milk production subsystem.
The inventory for S1 was integrated considering the feed supplied to the cows: corn silage, hay alfalfa, corn stubble, green alfalfa, fodder corn, concentrate 01, agricultural residues and protein 10. The data were obtained from the Agricultural and Food Database (AGRIBALYSE), Environment and Energy Management Agency (Agribusiness)33.
The inventory for S2 was integrated considering:
Occupation of barn floor: bovine milk production in a semi-intensive system is regularly carried out in individual cubicles with free access in a paved corral; according to the manual of good livestock practices in bovine milk production units34, under these conditions, dairy cattle require a surface area of 9 m2/cow.
Fuel consumption: the number of liters of fuel per kg of MAFP produced was calculated based on the type of vehicle required to transport the ingredients, the fuel efficiency expressed in km/liter, and the load capacity, adjusted for the functional unit.
Electricity consumption: in small and medium-scale production systems, the milking is done manually; therefore, only artificial lighting of the barn was considered34, and adjustment was made for the number of days (305) that the cows remain in lactation.
Water consumption: water consumption per cow was estimated for the lactation period (305 days); lactating cows consumed an average of 110 L of water per day35.
Methane (CH4) emissions from manure fermentation and manure management, and nitrogen (N) and nitrous oxide (N2O) emissions from manure management were estimated using the emission factors established for Mexico by the National Institute of Ecology and Climate Change (Instituto Nacional de Ecología y Cambio Climático)36.
Environmental impact assessment
The impact assessment was performed in OpenLCA V.1.11.0 software, using the ReCiPe 2008 method. Seven midpoint categories were considered for this study: agricultural land occupancy (ALO), climate change (CC), fossil depletion (FD), human toxicity (HT), marine ecotoxicity (ME), soil acidification (SA), and water depletion (WD)37. These categories were selected for having the highest relative contribution of environmental impacts and for the frequency of their use in the literature on similar researches.
Results
Environmental impact assessment
The results of the characterization for the baseline scenario identified seven categories (ALO, CC, FD, HT, ME, SA, and WD) as the main contributors to the environmental impacts in the production of 1 kg of MAFP. Table 4 shows that the food production subsystem (S1) is responsible for most of the total impact, with percentages of over 71 % in the following categories: CC, FD, HT, WD, ME, and ALO. While the milk production subsystem (S2) contributes to environmental loads in the categories SA (58.94 %), CC (28.16 %), and FD (25.58 %).
Table 4 Midpoint impacts for 1 kg MAFP-Baseline Scenario 2021
| Category | S1 | S2 | Total | Unit |
|---|---|---|---|---|
| ALO | 6.13494 | 0.00219 | 6.13713 | m2*a |
| CC | 0.65082 | 0.25508 | 0.90590 | kg CO2 eq |
| FD | 0.03501 | 0.01203 | 0.04704 | kg oil eq |
| HT | 1.59909 | 0.05472 | 1.65381 | kg 1,4-DB eq |
| ME | 1.72146 | 0.01833 | 1.73979 | kg 1,4-DB eq |
| SA | 0.01867 | 0.02680 | 0.04547 | kg SO2 eq |
| WD | 0.04327 | 0.00131 | 0.04458 | m3 |
S1= food production subsystem, S2= milk production subsystem, ALO= agricultural land occupation, CC= climate change, FD= fossil depletion, HT= human toxicity, ME= marine ecotoxicity, SA= soil acidification, WD= water depletion.
The processes involved in the production of 1 kg MAFP involved in the generation of environmental loads are presented in Figure 2. In subsystem 1, the main contributors are: concentrate 01 production in categories HT (60.83 %), ME (44.12 %), FD (37.78 %) and CC (17.35 %), corn silage production in categories SA (28.03 %), WD (26.74 %), ALO (26.74 %), CC (17. 94 %) and ME (16.73 %), protein 10 production in categories HT (37.63 %), ME (28.10 %) and FD (26.79 %), forage corn production in category WD (67.79 %) and green alfalfa production in categories ALO (62.68 %) and CC (18.42 %).
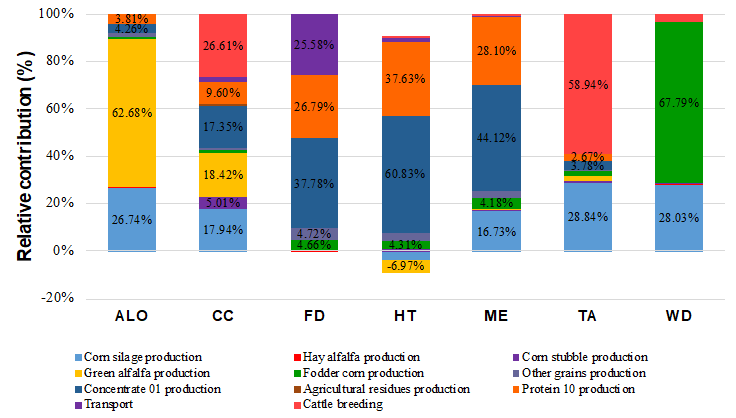
In subsystem 2, the environmental load of the production of 1 kg MAFP, is derived from livestock rearing mainly for categories TA (58.94 %) and CC (26.61 %) and from the transport of inputs to the farm, specifically in category FD (25.58 %).
Comparative analysis of scenarios for the production of 1 kg MAFP
Figure 3 shows the comparison of the environmental results in the baseline, optimistic and pessimistic scenarios for the seven impact categories for the years 2021 and 2030.
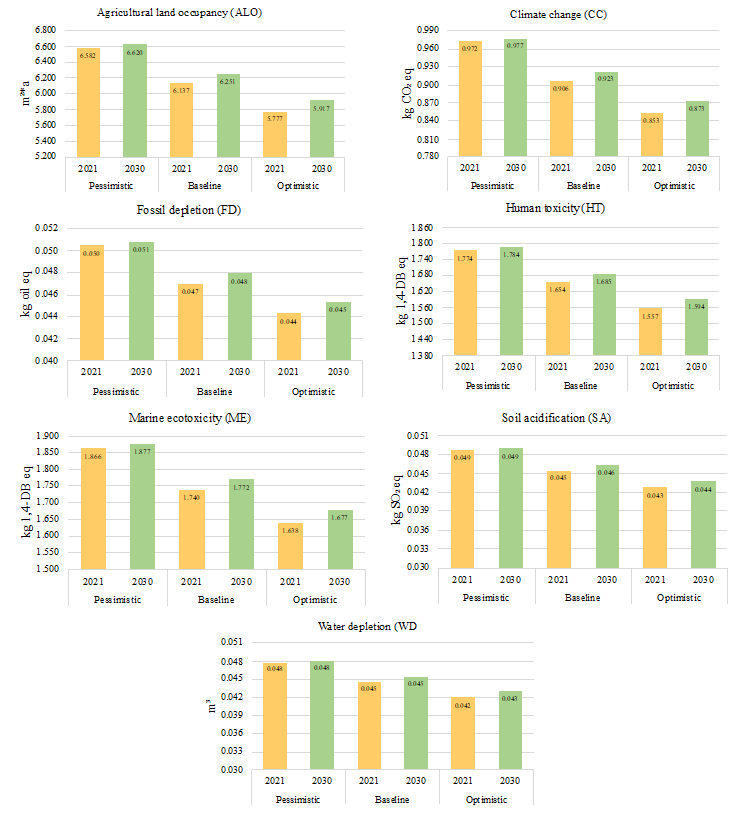
Figure 3 Comparative analysis of environmental loads between 2021 and 2030, for the pessimistic, baseline, and optimistic scenarios.
The comparative results between the pessimistic, baseline, and optimistic scenarios show that, in 2021 and 2030, the optimistic scenario allows a reduction of 6 % and 5 %, respectively, of emissions in all impact categories. This is due to the increase in production volume and the improvement in production efficiency, which allows for a reduction in the intensity of emissions19.
For the years 2021 and 2030, in the ALO category, the optimistic scenario exhibited a reduction of 0.36 and 0.33 m2 per kilo of MAFP, respectively. A pessimistic scenario implied an increase of 0.44 and 0.37 m2 per kilo of MAGP.
In the CC category, the optimistic scenario allowed a decrease of 0.53 kg for 2021 and 0.49 kg CO2 eq per kg MAFP for 2030. On the other hand, the production of 1 kg of MAFP in a pessimistic scenario implied an increase of 0.066 and 0.045 kg of CO2 eq per kg of milk, respectively.
In the optimistic 2021 and 2030 scenarios, a decrease of 0.0027 and 0.0026 kg oil eq per kilo of MAFP, respectively, was observed in the FD category. The pessimistic scenario showed an increase of 0.0034 and 0.0028 kg oil eq per kilogram of MAFP.
For the year 2030, the HT and ME categories in the optimistic scenario predicted a reduction of 0.059 and 0.095 kg 1,4-DB eq per kilo of MAFP, respectively, and in the pessimistic scenario, an increase of 0.12 and 0.10 kg 1,4-DB eq per kilo of MAFP, respectively.
In the SA category, the optimistic scenario for the years 2021 and 2030 allowed a reduction of 0.0027 and 0.0025 kg SO2 eq while the pessimistic scenario implied an increase of 0.0033 and 0.0027 kg SO2 eq per kg MAFP.
Finally, in the WD category for the years 2021 and 2030, there was a reduction of 0.0026 and 0.0024 m3 of water per kilo of MAFP, respectively, in the optimistic scenario, and an increase of 0.0032 and 0.0027 m3 of water per kilo of MAFP, respectively, in the pessimistic scenario.
Discussion
The characterization results of the baseline scenario for 1kg MAFP production in a semi-intensive system show the highest environmental loads in the food production subsystem with percentages of over 71 % in the categories agricultural land occupation (ALO), climate change (CC), fossil depletion (FD), water depletion (WD), human toxicity (HT), and marine ecotoxicity (ME). Similar results were found in the study by Carvalho et al18, where crop production for livestock feed was identified as one of the main contributors to the production of 1 kg of MAFP in a semi-intensive system in Brazil, mainly for the categories of land occupation, fossil resource depletion, water consumption, and soil acidification.
Comparison with studies in intensive systems shows that food production also represents a significant environmental impact38.
Agricultural land occupancy
The environmental load of the production of 1 kg of MAFP in the ALO category was 6.14 m2 in its baseline 2021 scenario. The main contributors to this category are related to the cultivation of green alfalfa (62.68 %), followed by corn silage (26.74 %). These results are higher than the 1.89 m2/yr per kg of MAFP cited by Berton et al16, where the land was destined for agriculture that produces the inputs required for livestock feeding in traditional small-scale systems in Italy, and also superior to the results presented by Xiaoquin et al38, where the production per kilo of MAFP requires occupancy of 1.16 m2 to 2.49 m2, highlighting that 98 % corresponds to land occupation for feed production and 2 % corresponds to stables. Rivera et al39 reported an occupancy of 1.33 m2 per kilo of MAFP in a conventional milk production system in Colombia.
However, the results of this study showed an occupancy below 8.8 to 11.2 m2 per kg of milk in Ethiopia40 and agree that fodder production on soils with low biomass yields is a determinant for the contribution of impacts in the ALO category18; thus, it is possible to use 2.25 m2 less soil in intensive systems than in less technified ones41.
In the year 2021, the optimistic scenario presented a production of 4,594 kg of milk per cow (15.06 kg/d), being the highest production of the compared scenarios, which meant the lowest contribution in the ALO category with 5.78 m2, while in the pessimistic scenario milk production decreased to 4,010 kg cow/yr (13.16 kg/d); this represented an increase in land occupation of 6.62 m2 (Figure 3). An increase in milk production per area of agricultural land is accompanied by an improvement in environmental efficiency42.
Climate change
In the CC impact category, 0.85 kg CO2 eq was generated per 1 kg MAFP in the baseline scenario. The main contributors for this category are related to cattle breeding (26 %), followed by green alfalfa (18.32 %), corn silage (17.84 %), and concentrate 01 productions (17.26 %) (Figure 2). Environmental burdens from livestock breeding are mainly attributed to CH4 emissions from enteric fermentation and manure management, while environmental burdens from forage and legume production are mainly related to N2O emissions generated by the use of agrochemicals in agricultural practices.
The environmental impact of CC found in this study is below 1.42 kg CO2 eq per kilo of MAFP in a semi-intensive system18. Kim et al43, compared small-scale (150 cows) and intensive (1,500 cows) systems and reported values of 1.22 and 0.98 kg CO2 eq, respectively, demonstrating that feeding practices such as a reduction in the proportion of fodder to 50 %, as well as the use of more digestible fodders, can help to improve the quality of the feed, and that an increase in fat supplementation can reduce CC contributions by up to 7 %. With respect to the production of concentrates44, they point out that it is possible to relate this to an increase in GHG generation by modeling a reduction in feed consumption, attributing the increase to a diminution of the milk production volume per cow.
The values found in the different scenarios of the current study range from 0.853 kg CO2 eq per kg MAFP for barns with a yield of 4,594 kg of milk per year (15.06 liters/d) in an optimistic scenario, to 0.977 kg CO2 eq per kg MAFP for barns with a yield of 4,010 kg of milk per year (13.16 liters/d), 0.788 kg CO2 eq per kg MAFP in a semi-stabled system in Brazil with a yield of 6,335 kg milk45, where lower CO2 eq. values may be associated with higher levels of milk production per cow18.
Fossil depletion
The environmental impact for the FD category was 0.48 kg oil eq. for 1 kg of MAFP; the main contributions for the production of concentrate 01 (34.59 %) and protein 10 (24.52 %) correspond to S1, while 25 % of the emissions are generated in the transportation of inputs to the farm (Figure 2). This value is below the 4.82 kg oil eq18, where the processes with the greatest impact were corn silage production (45.7 %), pasture production (34.3 %), and transportation of inputs to the farm (10 %). Ferreira et al46) point out the importance of knowing the origin of inputs in the supply chain in order to reduce transportation impacts.
The values found in the different scenarios considered in this study range from 0.044 kg oil eq, in an optimistic 2021 scenario, to 0.051 kg oil eq, in a pessimistic 2030 scenario (Figure 3); these variations correspond to the increase or decrease in milk productivity per cow.
Soil acidification
For the SA category, 1 kg of MAFP generated a total of 0.043 kg SO2 eq in its 2021 baseline scenario. The main generator of emissions for this category is livestock farming (58.75 %), followed by corn silage production (28.83 %) and emissions generated by livestock farming from the volatization of nitrogen in the form of ammonia (NH3) (Figure 2). Emissions from corn silage production are NH3 and N2O.
The total emissions generated in this category are higher than the 0.001 kg SO2 eq.18 and the 0.020 kg SO2 eq. attributable mostly to emissions from manure management and nitrogen fertilizer use reported43. In both studies, corn silage was one of the main contributors to emissions generation for this impact category. The specialized literature has shown how reliance on commercial concentrates can result in the contamination of soils and water bodies by excess nutrients, in addition to competing directly with the production of other foods for human consumption.
The optimistic 2021 scenario presents the lowest value in the SA category with 0.043 kg SO2 while the pessimistic 2021 and 2030 scenario presents the highest value with 0.049 kg SO2; the increase in production volume allows the reduction of the environmental impact in the SA category.
Water depletion
Water depletion per 1 kg MAFP was 0.04225m3 in its 2021 baseline scenario; the main consumption was for the production of fodder corn (67.08 %) and corn silage (27.74 %). Water consumption in this study is slightly above 0.00587 m3(18; similarly, in this study, the highest water consumption was in corn crops. However, there is high variability in the WD category with consumptions from 0.02800 m3 to 0.09900 m3, so that, as farm size increases, water consumption decreases, because the largest water footprint of milk production corresponds to the cultivation of fodder crops to sustain smaller scale production systems41.
The values presented in the comparative scenarios (Figure 3) range from 0.042 m3 of water for the optimistic scenario to 0.048 m3 for the pessimistic scenario. Water is an essential input for the cleaning and consumption of animals47, although there is no way to reduce the water intake, as an animal’s physiological requirements and milk production influence its consumption; proper water management is an adequate alternative to minimize losses of this vital liquid.
Human toxicity and marine ecotoxicity
Toxicity-related categories presented values of 1.5 kg 1,4-DB eq for HT and 1.64 kg 1,4-DB eq for ME. Although these values are not generally considered in the literature, since there are no comparative reference data, in this study they represent an important relative contribution to the environmental loads; the main contributors are the production of concentrate 01 and protein 10 (Figure 2), with percentages of 60.83 % and 37.63 % for HT, and 44.12 % and 28.10 for ME. The values presented in the comparative scenarios (Figure 3) are the lowest in the optimistic 2021 scenario (1.56 kg 1,4-DB eq for HT and 1.64 kg 1,4-DB eq for ME), while the highest value is presented for the pessimistic 2030 scenario (1.78 kg 1,4-DB eq for HT and 1.88 kg 1,4-DB eq for ME).
Environmental impact mitigation strategies
The results of the evaluated scenarios provide a great opportunity for action to position dairy farming in a positive scenario; the increase in production volumes was observed to be accompanied by a decrease in environmental loads. One strategy to improve the environmental performance of semi-technified milk production systems is to improve the productivity per lactating cow18; this would allow the mitigation of the environmental impacts without reducing the milk production. It is possible to increase the production volume by increasing efficiency with fewer cows. This implies not only an environmental benefit but also an economic and social benefit that allows progress towards the sustainability of milk production systems.
This study identified the main processes that contribute to the generation of environmental impacts, first of all, agricultural activities related to crop cultivation required for livestock feeding and manure management. This gives way to the implementation of comprehensive strategies such as the transition to a circular economy through regenerative processes to eliminate losses and waste throughout the biological cycle. As an opportunity to close the cycle, the feces and urine of livestock can be used as natural fertilizer; the use of good management practices and with the corresponding monitoring, can contribute to soil health and reduce CH4 emissions to the atmosphere48.
Conclusions and implications
The food production subsystem is the main contributor to the generation of environmental loads in the ALO, CC, FD, HT, ME, and WD categories. For the ALO category, the input that used the largest amount of soil was alfalfa. For the categories CC, FD, HT, and ME, the inputs with the highest contribution to emissions generation were concentrate 01, protein 10, and corn silage. In the WD category, the greatest impact is attributed to the forage corn crop. Animal husbandry has its largest contribution to SA, CC, and FD categories; enteric fermentation processes and manure management contribute to the generation of emissions such as CH4 and NH3. The comparative scenarios confirm that the increase in production volume represents a decrease of 5 % and 6 % for the years 2021 and 2030, respectively, in the impact categories evaluated. Therefore, the improvement of productive efficiency per lactating cow is one of the main goals to be established.
Acknowledgments
The authors wish to thank the National Council for Humanities, Science, and Technology of Mexico (Consejo Nacional de Humanidades, Ciencia y Tecnología, CONAHCYT) for project F003-320069, assigned to Francisco Ernesto Martínez Castañeda.
REFERENCES
1. FAO. Organización de las Naciones Unidas para la Agricultura y la Alimentación. Portal lácteo-Producción lechera. 2022. https://www.fao.org/dairy-production-products/production/es/ Consultado Nov 16, 2022. [ Links ]
2. FAO. Organización de las Naciones Unidas para la Agricultura y la Alimentación. Portal lácteo-Sistemas de producción. 2022. https://www.fao.org/dairy-production-products/production/production-systems/es/ Consultado Nov 20, 2022. [ Links ]
3. SIAP. Servicio de Información Agroalimentaria y Pesquera. Panorama Agroalimentario. 2022. [ Links ]
4. Loera J, Banda J. Situación de la industria láctea en México: producción y comercialización. RumiNews LATAM 2022. https://rumiantes.com/situacion-industria-lactea-mexico-produccion-comercializacion/ Consultado Dic 6, 2022. [ Links ]
5. Núñez G, Vera HR, Román H. Importancia y procesos en la producción de leche de bovino en México. En: Vera AH, et al., editores. Producción de leche de bovino en el sistema familiar. Instituto Nacional de Investigaciones Forestales, Agrícolas y Pecuarias - INIFAP. 2009. [ Links ]
6. Espinoza GJA. Variables del mercado de insumos y productos que inciden en la competitividad de la cadena de leche de bovino en México. En: Núñez HG et al., (compiladores). Avances de investigación para la producción de la productividad, competitividad y sustentabilidad de la cadena productiva de leche de bovino en México. Libro Científico. INIFAP. 2012. [ Links ]
7. INECC. Instituto Nacional de Ecología y Cambio Climático. Atlas Nacional de Vulnerabilidad al Cambio Climático México. 1a ed. México. 2019. [ Links ]
8. Sánchez B, Flores S, Rodríguez E, Anaya AM, Contreras EA. Causas y consecuencias del cambio climático en la producción pecuaria y salud animal. Revisión. Rev Mex Cienc Pecu 2020;11(Supl 2):126-145. [ Links ]
9. Gobierno de México. Secretaría de Medio Ambiente y Recursos Naturales e Instituto Nacional de Ecología y Cambio Climático. Inventario nacional de emisiones de gases y compuestos de efecto invernadero 1990 - 2019. México. 2020. [ Links ]
10. Balcha E, Menghistu HT, Zenebe A, Hadush B. Carbon footprint of cows’ milk: a case study of peri-urban and urban dairy farms within Mekelle milk-shed, Ethiopia. Carbon Manag 2022;(13):55-68. [ Links ]
11. Baldini C, Gardoni D, Guarino N. A critical review of the recent evolution of life cycle assessment applied to milk production. J Clean Produc 2017;140:421-435. [ Links ]
12. Rivera JE, Arenas FA, Rivera R, Benavides LM, Sánchez J, Barahona R. Life cycle assessment in milk production: Comparison of two specialized dairy herds. Livest Res Rural Dev 2014;26:1-9. [ Links ]
13. Battini F, Agostini A, Trabaglio V, Amaducci S. Environmental impacts of different dairy farming systems in the Po Valley. J Clean Produc 2016;(112):91-102. [ Links ]
14. Gilson G, Ferrero F, Bava L, Borreani G, Dall Prá A, Pacchioli MT, Sandrucci A, Zucali M, Tabacco E. Forage systems and sustainability of milk production: Feed efficiency, environmental impacts and soil carbon stocks. J Clean Produc 2020;(260):121012. [ Links ]
15. Mazzeto AM, Bishop G, Styles D, Arndt C, Brook R, Chadwick D. Comparing the environmental efficiency of milk and beef production through life cycle assessment of interconnected cattle systems. J Clean Produc 2020;(277):124108. [ Links ]
16. Berton M, Bittante G, Zendri F, Ramanzin M, Schiavon S, Sturaro E. Environmental impact and efficiency of use of resources of different mountain dairy farming systems. Agric Syst 2020;(181):102806. [ Links ]
17. De Vries M, Wouters AP, Vellinga TV. Environmental impacts of dairy farming in Lembang, West Java. Estimation of greenhouse gas emissions and effects of mitigation strategies. CCAFS Working Paper no. 221. Wageningen, the Netherlands: CGIAR Research Program on Climate Change, Agriculture and Food Security (CCAFS). 2017. http://www.ccafs.cgiar.org. [ Links ]
18. Carvalho LS, Willers CD, Soares BB, Nogueira AR, Neto JA, Rodrigues LB. Environmental life cycle assessment of cow milk in a conventional semi‑intensive Brazilian production system. ESPR 2022;(29):21259-21274. [ Links ]
19. Gerber P, Vellinga T, Opio C, Steinfeld H. Productivity gains and greenhouse gas emissions intensity in dairy systems. Lives Sci 2011;(139):100-108. [ Links ]
20. Wilkes A, Wassie S, Odhong’ C, Fraval S, van Dijk S. Variation in the carbon footprint of milk production on smallholder dairy farms in central Kenya. J Clean Prod 2020;(265):121780. [ Links ]
21. ISO 14040. Environmental management - life cycle assessment - principles and framework. International Organization for Standardization. Geneva. 2006. [ Links ]
22. ISO 14044. Environmental management - life cycle assessment - requirements and guidelines. International Organization for Standardization. Geneva. 2006. [ Links ]
23. INEGI. Instituto Nacional de Estadística y Geografía. Encuesta Nacional Agropecuaria (ENA) 2017: Conociendo el campo de México. Resultados. 2018. https://www.inegi.org.mx/contenidos/programas/ena/2017/doc/ena2017_pres.pdf Consultado Dic 2, 2022. [ Links ]
24. Loera J, Banda J. Situación de la industria láctea en México: producción y comercialización. RumiNews LATAM. 2019. https://rumiantes.com/situacion-industria-lactea-mexico-produccion-comercializacion . Consultado Dic 6, 2022. [ Links ]
25. Secretaría de Economía. Dirección General de Industrias Básicas. Análisis del Sector Lácteo en México. México. 2012. [ Links ]
26. Cano M, Ramírez B. Ganadería familiar en los municipios más pobres del estado de Hidalgo, México. En: Cavallotti V et al. editor. Globalización, seguridad alimentaria y ganadería familiar. Universidad Autónoma Chapingo. 2017. [ Links ]
27. SADER. Secretaría de Agricultura y Desarrollo Rural. Crece la producción lechera, pero enfrenta retos, uno principal es la normatividad. 2022. https://www.gob.mx/agricultura/prensa/crece-la-produccion-lechera-pero-enfrenta-retos-uno-principal-esta-en-la-normatividad-322012. Consultado Jul 20, 2023. [ Links ]
28. FINRURAL. Financiera Rural. Bovino y sus derivados. Dirección General Adjunta de Planeación Estratégica y Análisis Sectorial. 2009. [ Links ]
29. SIACON-NR. Sistema de Información Agroalimentaria de Consulta. Agricultura. Sistema de Información Agroalimentaria y Pesquera. 2022. México. [ Links ]
30. IDF. International Dairy Federation. A common carbon footprint approach for the dairy sector - the IDF guide to standard life cycle assessment methodology. Bulletin of International Dairy Federation 479/2015. 2015. 60pp 60pp https://store.fil-idf.org/product/a-common-carbon-footprint-approach-for-the-dairy-sector-the-idf-guide-to-standard-life-cycle-assessment-methodology/ Accessed Dec 12, 2022. [ Links ]
31. Bretschneider G, Salado E, Cuatrín A, Arias D. Lactancia: Pico y persistencia. Instituto Nacional de Tecnología Agropecuaria. 2015. [ Links ]
32. Box GE, Jenkins GM, Reinsel GC, Ljung GM. Time series analysis forecasting and control. 5 Ed. Wiley. 2015. [ Links ]
33. ADEME. French Environment and Energy Management. Agency, Agribalyse program V1.3. 2016. [ Links ]
34. SENASICA. Manual de buenas prácticas pecuarias en unidades de producción de leche bovina. Servicio Nacional de Sanidad, Inocuidad y Calidad Agroalimentaria. Gobierno de México. 2019. [ Links ]
35. Kononoff PJ, Clark KJ. Water Quality and requirements for dairy cattle. 2017. https://extensionpublications.unl.edu/assets/html/g2292/build/g2292.htm . Accessed Dec 2, 2022. [ Links ]
36. INECC. Instituto Nacional de Ecología y Cambio Climático. Inventario Nacional de Emisiones de Gases y Compuestos de Efecto Invernadero 1990-2015. Secretaría de Medioambiente y Recursos Naturales. México. 2018. [ Links ]
37. Goedkoop M, Heijungs R, Huijbregts M, De Schryver A, Struijs J, Van Zelm R. ReCiPe 2008 - A life cycle impact assessment method which comprises harmonized category indicators at the midpoint and the endpoint level. First edition. Report I: Characterization. 2009. [ Links ]
38. Xiaoqin W, Leadgard S, Lou J, Guo Y, Zhao Z, Liangguo, Liu C, Zhang N, Duan X, Mac L. Environmental impacts and resource use of milk production on the North China Plain, based on life cycle assessment. Sci Total Environ 2018;(625):486-495. [ Links ]
39. Rivera J. Life cycle assessment for the production of cattle milk in an intensive silvopastoral system and a conventional system in Colombia. Trop Subtrop Agroecosys 2016;19:237-251. [ Links ]
40. Woldegebriel D, Udo H, Viets T, van der Harst E, Potting J. Environmental impact of milk production across an intensification gradient in Ethiopia. Livest Sci 2017;(206):28-36. [ Links ]
41. Brizga J, Kurppa S, Heusala H. Environmental impacts of milking cows in Latvia. Sustain 2021;(13):1-12. [ Links ]
42. Drews J, Czycholl I, Krieter J. A life cycle assessment study of dairy farms in northern Germany: the influence of performance parameters on environmental efficiency. J Environ Manag 2020;273:111127. [ Links ]
43. Kim D, Stoddart N, Rotz C, Veltman K, Chase L, Cooper J, et al. Analysis of beneficial management practices to mitigate environmental impacts in dairy production systems around the Great Lakes. Agric Syst 2019;(176):102660. [ Links ]
44. Berton M, Bovolenta S, Gallo L, Ramanzin M, Corazzin M, Sturaro E. Consequential-based life cycle assessment of reducing the concentrates supply level in the diet fed to lactating cows in the alpine dairy farming system. Ital J Anim Sci 2023;(22):1-13. [ Links ]
45. de Léis C, Cherubini E, Ruviaro C, da Silva V, do Nascimento Lampert V, Spies A, Soares S. Carbon footprint of milk production in Brazil: a comparative case study. Int J Life Cycle Assess 2015;(20):46-60. [ Links ]
46. Ferreira FU, Robra S, Ribeiro PCC, Gomes CFS, Almeida Neto JA, Rodrigues LB. Towards a contribution to sustainable management of a dairy supply chain. Production 2020;30:e20190019 2020. [ Links ]
47. Palhares JCP, Novelli TI, Morelli M. Best practice production to reduce the water footprint of dairy milk. Revi Ambien Agua 2020;15(1). [ Links ]
48. Villavicencio MR, Salazar MP, Meléndez J. Adaptación al cambio climático con enfoque de economía circular para reducir la vulnerabilidad del sector ganadero extensivo en México: estado del arte. Reg Des Sust 2023;XXIII:44. [ Links ]
Received: February 07, 2023; Accepted: September 04, 2023
 Este es un artículo publicado en acceso abierto bajo una licencia Creative Commons
