


 text in
  English (pdf)
 Article in xml format
 Article references
 Send this article by e-mail
 Cited by SciELO
  Similars in
SciELO
Similars in
SciELO 
 Permalink
Introduction
People use herbal spices as food flavor enhancers and medicinal aids since antiquity1, mainly for their biological activity. Oregano is one of the most important herbs, which is the common name from a wide variety of plant genera and species worldwide, but usually referred to as Origanum in the Lamiaceae (Labiatae) family2 or Lippia graveolens in the Verbenaceae family. Oregano’s essential oil (OEO) has been used as a food additive due to its antimicrobial activity attributed to its high monoterpenes content such as thymol and carvacrol, the latter generally recognized as a safe food additive3-6. Due to the banning of antibiotics by the European Commission, OEO has received increased attention from the poultry and swine industry for improving natural defenses and strengthening animal organisms with favorable results7-10. OEO can be incorporated into the swine feed by mixing the oil and the organic matrix. However, a confident quantification method is required for quality control.
Thymol and carvacrol11 show antibacterial4,12, antioxidant13, and fungicide activity3,4 and are two of the main components of the OEO. Thus, they can serve as markers for quantification. The quality control method begins with a solvent extraction of the volatile compounds from the feed matrix; however, organic solvents are neither environmentally friendly nor acceptable for food processing. Some other extraction technologies, such as supercritical carbon dioxide extraction, require high-cost equipment and high-pressure operational conditions14,15. Thus, it is desirable to develop quick and effective thymol and carvacrol quantification method inside a swine feed organic matrix. In this paper propose the Head Space Solid Phase Micro Extraction (HS-SPME) technique along with the gas chromatography-mass spectroscopy (GC-MS) method since HS-SPME is an effective, non-expensive, and environmentally friendly technique for the detection and quantification of volatile compounds16,17.
As is known, this technique has not been used for thymol and carvacrol detection in an organic matrix added with OEO, but only to quantify these active compounds in pure oil18-20. This work, compare a solvent extraction technique using petroleum ether or ethyl acetate in a Soxhlet extractor21 with an HS-SPME technique from the swine feed flour matrix to quantify the thymol and carvacrol of the extract using a GC-MS system. It was used nitrosopiperidine (NPIP) as an internal standard for absorbing signal variations due to the extraction method and the equipment itself22 and calculate the limit of detection (LOD) and the limit of quantification (LOQ) for assessing the extraction technique’s effectiveness. Finally, it was performed a design of experiments using R23 and RStudio24 software.
Material and methods
Reagents
Thymol (100.0%), carvacrol (99.9%), nitrosopiperidine (99.9%), and sodium chloride were obtained from Sigma Aldrich (St. Louis, USA). Analytical grade (ACS) petroleum ether and ethyl acetate were obtained from Fermont (Monterrey, México). Tridistilled water from MERCK was used in HS-SPME experiments. The carrier gas used for GC-MS was ultra-high purity (grade 5.0) helium from Praxair. Polyacrylate (PA) fibers for SPME were obtained from Sigma Aldrich. A local industry provided the swine feed flour added with OEO.
Chromatographic method
An Agilent gas chromatograph model 7890A coupled with a mass spectrometer model 5975C with a positive pole ion, single quadrupole with electron impact ionization (EI) source were used for detection and identification. An HP-INNOWax capillary column (30 m, 0.25 mm ID, and 0.5 μm thickness polyethylene glycol film; Alltech) was used for compound separation. Transfer line temperature was set at 250 ºC and GC injector port at 260 °C on splitless mode. The oven temperature was initially set at 60 °C for 3 min, then raised to 250 ºC at a rate of 20 °C per minute and kept there for 3 min. MS was programmed both on scan and SIM mode, with a solvent delay time of 8 min. Scan mode was set from 20 to 300 m/z while SIM mode was set to 114 m/z (characteristic ions of nitrosopiperidine) for the time interval of 8 to 11.5 min and immediately shifted to follow the 135 and 150 m/z signals (characteristic ion of thymol and carvacrol) until the end of the analysis.
Sample preparation
A local industry provided the swine feed flour samples added with oregano’s essential oil during the manufacturing process. The samples were stored in hermetic plastic bags until used. Two different techniques for extracting thymol and carvacrol were used in this work: (i) solvent extraction using a Soxhlet distillation apparatus, and (ii) HS-SPME using a PA fiber. Three different solvents were used: ethyl acetate and petroleum ether for Soxhlet extraction and deionized water for the HS-SPME technique. 5.0 mg L-1 of NPIP was added to every sample as an internal standard.
Soxhlet solvent extraction
A sample of 10 g of swine feed was put into a Soxhlet extraction apparatus with 130 mL of solvent (either ethyl acetate or petroleum ether). The mixture was heated until five cycles were completed, then an aliquot of this extract was stored for analysis. A new fresh solvent was immediately added to perform another five cycles using the same sample, and another extract aliquot was taken. A third distillation step with more fresh solvent was made, and a third aliquot was taken. Thus, each sample (10 g of swine feed) was subjected to extraction three times using two different solvents.
Moreover, it was used two quantification methods using (a) an external standard calibration curve and (b) a standard addition method. The calibration curve for the external standard is made using known concentrations for thymol and carvacrol (2, 4, 6, 8, and 10 mg L-1). For the standard addition method, 0.5 mL of extract aliquot was mixed with 0.5 mL of solvent with different thymol and carvacrol concentrations (2, 4, 6, 8, and 10 mg L-1). In all cases, the sample amount injected into the GC was 1.0 μL.
Head space-solid phase microextraction
The HS-SPME technique involves some parameters such as equilibrium time (teq), equilibrium temperature (Teq), extraction time (text), extraction temperature, (Text), and ionic strength (I). The equilibrium time and temperature are the time and temperature at which the sample is left to reach equilibrium between the solid phase (swine feed matrix) and the vial’s headspace. The extraction time and extraction temperature correspond to the time and temperature at which the microfiber is in contact with the headspace adsorbing volatile compounds. Ionic strength is a measure of the concentration of ions in a solution and modifies the equilibrium of the system. It is necessary to determine the effect of these parameters on the signal obtained in GC-MS. To evaluate this effect, it was added thymol and carvacrol standards in water (along with 5 mg L-1 of NPIP as the internal standard) to form a 10 mg L-1 solution.
For thymol and carvacrol quantification in swine feed, a sample of 0.5 g powder swine feed was added to 15 mL glass vials with PTFE/Silicone septum with the required NaCl content and 10 mL of water with different thymol and carvacrol concentrations to perform the standard addition technique analysis. External standard calibration curves were not possible to perform in the HS-SPME due to the interactions between volatile compounds of the powder swine feed matrix in the gas phase and the fiber during the extraction. The relative area between thymol or carvacrol and the added standard (NPIP) was calculated and used as the response variable to evaluate the performance of the extraction method.
Design of experiments
A 24 factorial analysis was performed to evaluate the effect of the equilibrium temperature (40-50 ºC), extraction temperature (40-50 ºC), extraction time (20-40 min), and ionic strength (0.57-2.28 mole L-1 of NaCl). Equilibrium time is fixed at a sufficiently long time to assure equilibrium (Table 1).
Table 1 Level values of the factors for the design of the experiment
| Factor | Low level -1 | High level +1 |
|---|---|---|
| Equilibrium temperature, Teq (ºC) | 40 | 50 |
| Extraction temperature, Text (ºC) | 40 | 50 |
| Extraction time, text (min) | 20 | 40 |
| Ionic strength, I (mole L-1) | 0.57 | 2.28 |
A 24 factorial design of experiments with a single replicate consists of 16 experimental runs. The analysis of variances of the complete model (main factors and all possible interaction combinations) gives no residuals, Fo, and P-values since the degree of freedom of the error is equal to zero and there is no estimate of the internal error. So, the negligible three- and four-order interactions are used to estimate error. Moreover, after evaluating ANOVA of main effects and two-factor interactions, the significant factors are defined, and another ANOVA analysis is performed taking in account only the factors that are significant. A regression model is then evaluated, and residuals and contour plots are plotted using R-studio.
Results
Thymol and carvacrol mass spectrum identification
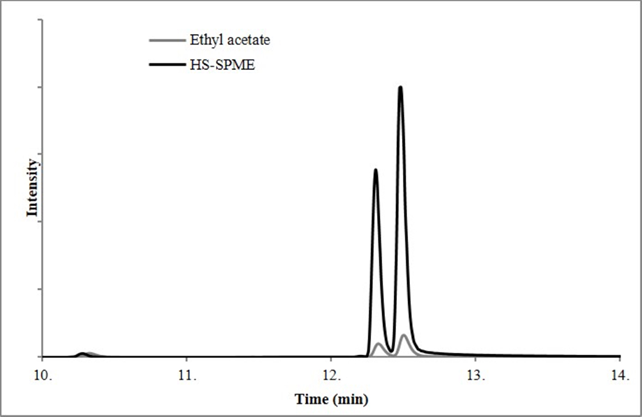
A sample of 0.5 g of powder swine feed was put in a vial with 10 mL of water and NPIP as the internal standard. An HS-SPME process was performed to identify the presence of thymol and carvacrol, as shown in Figure 1. Spectra from scan mode were analyzed with the NUST/EPA/NIH mass spectral library for confirmation with a 90 % concordance between the experimental and theoretical spectrum. Retention times of internal standard, thymol, and carvacrol were 10.3, 12.3, and 12.5 min, respectively. The retention time is obtained by following their respective characteristic ion: 144 for NPIP, 135 for thymol, and 150 for carvacrol. It is important to note that the HP-Innowax column was appropriate for good separation between thymol and carvacrol due to its isomeric nature.
Calibration curves
For comparison purposes, three different methodologies for thymol and carvacrol quantification were performed: (a) Soxhlet extraction using organic solvents and calibration with an external standard, (b) Soxhlet extraction using organic solvents and calibration by standard addition, and (c) HS-SPME with water as solvent and calibration using standard addition. The use of an external standard and standard addition is intended for sensibility comparison.
Figure 1 shows the comparison of SIM chromatograms using HS-SPME and Soxhlet extraction with ethyl acetate solvent. For the HS-SPME technique, the sensibility increases almost nine times when compared with the solvent extraction technique, even using less sample quantity during the micro-extraction process, which proves the effectiveness d advantage of the HS-SPME methodology.
The obtained signal [relative area = (thymol or carvacrol area) / (internal standard area)] and its relative standard deviation (RSD) for all the experiments of the factorial design is shown in Figure 2. There are seven experiments with an RSD <15 % for both analytes, but only two with an RSD <5.5 %, experiments #1 and #12. A high signal is desirable, so it was identified four experiments with a high relative area. Experiments #4, #12, and #16 show a combination of high signal (relative area) with low dispersion (RSD) values. All these experiments were performed at a salt content of 0.57 M and extraction time of 40 min, but extraction temperature and equilibrium temperature of 40 and 50 ºC. It is interesting to note that ionic strength (salt content) and extraction time are the factors in common, and they are significant factors as will be seen later.

Figure 2 Relative area and dispersions (relative standard deviation) for thymol and carvacrol for each experiment of the factorial design for improving process parameters
In Figure 3 it can be observed the calibration curves for (a) the use of thymol and carvacrol as external standards for the Soxhlet extraction technique; (b) the use of NPIP as added standard for the Soxhlet extraction technique; and (c) the use of NPIP as added standard for HS-SPME technique. It is not possible to use external standards for the SPME technique. It is noteworthy that the signal of the relative area is in the order of tens for carvacrol either with external standard or addition standard, while the signal of relative area for thymol is in the order of units for external and addition standards. But for HS-SPME the signal of the relative area is in the order of hundreds for both thymol and carvacrol, which again confirms the increased sensibility of one order of magnitude (two orders for thymol) of this technique.

It should be noted that relative area values (y-axis) are greater for the HS-SPME technique compared to the Soxhlet extraction technique. Soxhlet extraction using ethyl acetate and HS-SPME using water as solvents.
Figure 3 Soxhlet extraction external standard calibration curves (a), Soxhlet extraction with standard addition curves (b), and HS-SPME with standard addition curves (c), for carvacrol and thymol quantification
Discussion
Design of experiments
Table 2 shows the analysis of variance for main effects and two-factor interactions for carvacrol and thymol quantification, and it is possible to observe that only extraction time and salt content as well as the interaction between them are significant for both analytes. Table 3 shows the analysis of variance considering only ionic strength, extraction time, and ionic strength-extraction time interaction factors for carvacrol and thymol. Considering only the significant factors and interactions, the regression model for the carvacrol HS-SPME extraction is:
Table 2 ANOVA of main effects and two-factor interactions for the design of the experiment
| Carvacrol | Thymol | |||||||||
|---|---|---|---|---|---|---|---|---|---|---|
| DF | Sum of squares |
Mean squared |
F0 | P-value | DF | Sum of squares |
Mean squared |
F0 | P-value | |
| Teq (ºC) | 1 | 0.6 | 0.6 | 0.016 | 0.90550 | 1 | 0.2 | 0.2 | 0.011 | 0.92026 |
| Text (ºC) | 1 | 1.4 | 1.4 | 0.038 | 0.85218 | 1 | 0.7 | 0.7 | 0.042 | 0.84494 |
| I (M) | 1 | 1089.2 | 1089.2 | 29.208 | 0.00293 | 1 | 484.9 | 484.9 | 30.822 | 0.00261 |
| text (min) | 1 | 310.1 | 310.1 | 8.315 | 0.03444 | 1 | 109.7 | 109.7 | 6.974 | 0.04593 |
| Teq x Text | 1 | 39.0 | 39.0 | 1.046 | 0.35339 | 1 | 28.3 | 28.3 | 1.798 | 0.23760 |
| Teq x I | 1 | 13.7 | 13.7 | 0.368 | 0.57070 | 1 | 6.6 | 6.6 | 0.416 | 0.54715 |
| Teq x text | 1 | 3.6 | 3.6 | 0.096 | 0.76966 | 1 | 0.1 | 0.1 | 0.006 | 0.94100 |
| Text x I | 1 | 2.8 | 2.8 | 0.075 | 0.79541 | 1 | 1.4 | 1.4 | 0.089 | 0.77805 |
| Text x text | 1 | 65.0 | 65.0 | 1.742 | 0.24407 | 1 | 33.1 | 33.1 | 2.105 | 0.20652 |
| text x I | 1 | 455.8 | 455.8 | 12.222 | 0.01736 | 1 | 187.9 | 187.9 | 11.941 | 0.01813 |
| Residuals | 5 | 186.5 | 37.3 | 5 | 78.7 | 15.7 | ||||
DF= degrees of freedom.
Table 3 ANOVA of the significant factors for the for the design of the experiment
| Carvacrol | Thymol | |||||||||
|---|---|---|---|---|---|---|---|---|---|---|
| DF | Sum of squares | Mean squared | F0 | P-value | DF | Sum of squares | Mean squared | F0 | P-value | |
| I (M) | 1 | 1089.2 | 1089.2 | 41.83 | <0.001 | 1 | 484.9 | 484.9 | 39.065 | <0.001 |
| text (min) | 1 | 310.1 | 310.1 | 11.91 | 0.00480 | 1 | 109.7 | 109.7 | 8.839 | 0.01163 |
| text x I | 1 | 455.8 | 455.8 | 17.50 | 0.00127 | 1 | 187.9 | 187.9 | 15.134 | 0.00215 |
| Residuals | 12 | 312.5 | 26.0 | 12 | 148.9 | 12.4 | ||||
DF= degrees of freedom.
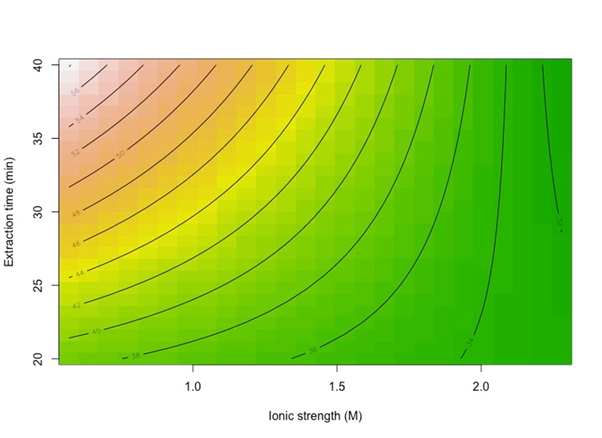
With an R2 of 0.8558, meaning that 85.6 % of the data variability is explained by the model with a randomly distributed residuals plot (not shown). A contour plot in Figure 4, shows that when extraction time is at a high level, there is a strong negative effect of salt content, meaning that the relative area of carvacrol is higher when salt content is lower; moreover, when extraction time is at a low level, there is a still negative effect of salt content but weaker than at the high level of extraction time. Considering only the significant factors and interactions, the regression model for the thymol HS-SPME extraction is:
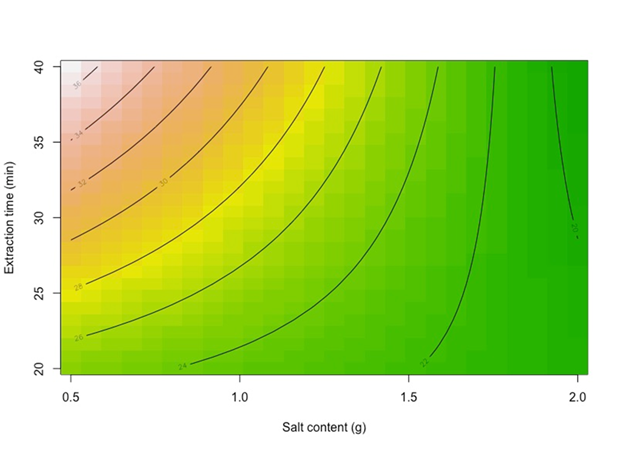
With an R2 of 0.8401, meaning that 84 % of the data variability is explained by the model with a randomly distributed residuals plot (not shown). A contour plot in Figure 5, shows that when extraction time is at a high level, there is a strong negative effect of salt content, meaning that the relative area of thymol is higher when salt content is lower; moreover, when extraction time is at a low level, there is a still negative effect of salt content but weaker than at the high level of extraction time. This is the same for thymol and carvacrol, the only difference is that carvacrol shows a 1.5 times higher relative area signal than thymol.
Table 3 shows the analysis of variance evaluated only with the significant factors of the DOE, i.e., ionic strength, extraction time, and ionic strength-extraction time interaction factors.
For choosing the best operational parameters, should be always select a high extraction time and low salt content. Since the other two factors are not significant, it can work at any equilibrium temperature and extraction temperature; so, was decided to work at low equilibrium and extraction temperatures for economics.
Table 4 Table of effects for the design of the experiment
| Carvacrol | Thymol | |||||
|---|---|---|---|---|---|---|
| Effect | T-value | P-value | Effect | T-value | P-value | |
| Ionic strength, M | -16.502 | -6.467 | <0.001 | -11.0102 | -6.250 | <0.001 |
| Extraction time, min | 8.804 | 3.451 | 0.00480 | 5.2372 | 2.973 | 0.01163 |
| text x I | -10.674 | -4.183 | 0.00127 | -6.853 | -3.890 | 0.00215 |
For both analytes, an increase in salt content (or ionic strength) results in a decrement in the relative area, probably because the solution is close to saturation. Also, a high extraction time (text) benefits the relative area signal which is in good agreement with the concept that extraction increases as extraction time increments.
Table 5 shows thymol and carvacrol content in the powder swine feed when comparing the two extraction techniques and the solvents used. The total thymol and carvacrol content for each solvent is calculated by adding the measured quantity of each of the three consecutive extractions. Regarding Soxhlet solvent extraction, petroleum ether was not efficient in extracting thymol and carvacrol from the powder swine feed, as indicated by the low quantification obtained of both components, but especially for thymol. Petroleum ether extracted 52 to 55 % less thymol and 19 to 22 % less carvacrol than ethyl acetate. Interestingly, there is a selective extraction capability of both solvents for thymol over carvacrol. Again, the HS-SPME technique shows an improved extraction capacity for both thymol and carvacrol, and there are extracted with no selectivity.
Table 5 Comparison of the total thymol and carvacrol content in powder swine feed
| Technique | Soxhlet extraction | HS-SPME | |||||||||
|---|---|---|---|---|---|---|---|---|---|---|---|
| Standard method |
Standard addition | External standard | Standard addition | ||||||||
| Solvent | Ethyl acetate | Petroleum ether | Ethyl acetate | Petroleum ether | water | ||||||
| Analyte | Thymol | Carvacrol | Thymol | Carvacrol | Thymol | Carvacrol | Thymol | Carvacrol | Thymol | Carvacrol | |
| First extract, mg L-1 | 4.25 | 0.67 | 1.99 | 0.48 | 4.03 | 0.58 | 1.92 | 0.40 | - | - | |
| Second extract, mg L-1 | 0.63 | 0.16 | 0.33 | 0.18 | 0.79 | 0.15 | 0.24 | 0.16 | - | - | |
| Total content, mg L-1 | 4.88 | 0.82 | 2.32 | 0.67 | 4.82 | 0.73 | 2.16 | 0.56 | 3.25 | 4.17 | |
| Content in swine feed, mg kg-1 | 63.45 | 10.71 | 30.22 | 8.66 | 62.60 | 9.43 | 28.12 | 7.30 | 65.00 | 83.40 | |
The calibration method also shows some differences. Calibration with an external standard shows a concentration value that is 9 % less on average than that using standard addition calibration; the standard addition method has an improved uncertainty, but it is an expensive method since the standard must be added to each sample.
The HS-SPME technique shows the highest concentration for thymol and carvacrol. The total thymol content agrees with the total thymol content obtained by Soxhlet extraction with ethyl acetate of about 63-65 mg/kg; however, carvacrol’s total content is very different. Carvacrol quantification by HS-SPME has a value of 83.40 mg/kg, while quantification using Soxhlet extraction with ethyl acetate is 10.71 mg/kg, which is eight times lower than the HS-SPME result. It might be related to the steric behavior of thymol and carvacrol (stereoisomers) and interactions with the fiber material (polyacrylate).
Method validation
Limits of detection (LOD) and quantification (LOQ) were estimated to evaluate the performance of the extraction methods and were calculated using the baseline noise and the signal, defined as three times the relation signal/noise for LOD and ten times for the LOQ (16). Figure 3 shows the calibration curves for each component (thymol and carvacrol) for the three different solvents used. LOD and LOQ values using Soxhlet extraction with ethyl acetate were 3.7 and 12.5 μL-1 for thymol and 1.4 and 4.7 μg L-1 for carvacrol, respectively. The HS-SPME technique gives better results for both substances since LOD, and LOQ values were 0.9 and 3.1 μg L-1 for thymol and 0.6 and 1.9 μg L-1 for carvacrol, respectively. The linearity of data was estimated via the linear correlation coefficient, where the lowest value found was 0.9892.
Conclusions and implications
Oregano’s essential oil is positively identified in the swine feed powder using characteristic volatile compounds thymol and carvacrol using two different extraction methods: Soxhlet and HS-SPME. Among the organic solvents for Soxhlet extraction, petroleum ether was not suitable since it only extracted about 50 and 10 % of the total thymol and carvacrol content, respectively (relative to HS-SPME quantification). Furthermore, regarding the use of ethyl acetate in Soxhlet extraction, this solvent was able to extract all the thymol, but not the carvacrol, showing some sort of selectivity. For the HS-SPME technique, a 24-factorial design of experiments was performed to evaluate process parameters and obtain the highest possible S/N ratio. The proper conditions are equilibrium temperature (Teq) of 40 ºC, extraction temperature (Text) of 40 ºC, ionic strength (I) of 0.57 M, and extraction time (text) of 40 min. HS-SPME showed a nine-times better extraction performance compared to Soxhlet extraction, even with smaller sample amounts, with a limit of detection and quantification of 0.9 and 3.1 μg L-1 for thymol, and 0.6 and 1.9 μg L-1 for carvacrol, respectively. The results show that the HS-SPME method is more efficient for thymol and carvacrol extraction from an organic matrix and has the potential for a quality-control technique in the food industry to quantify the active compounds of oregano’s essential oil when used as an additive to an organic matrix such as swine feed.

