


 texto em
  Inglês (pdf)
 Artigo em XML
 Referências do artigo
 Enviar este artigo por email
 Citado por SciELO
  Similares em
SciELO
Similares em
SciELO 
 Permalink
Anaplasmosis, caused by the Gram-negative bacterium Anaplasma marginale (Rickettsiales; Anaplasmataceae), is an infectious disease that affects cattle and wild ruminants1. The disease has a high prevalence in tropical, subtropical and even temperate zones and causes jaundice, anemia, production losses of meat and milk, reproductive inefficiency, mortality and related therapeutic costs, as well as trade restrictions for the movement of positive reactors2. Infection with A. marginale induces the production of antibodies that can be detected by laboratory tests3,4,5.
Many serologic tests have been developed for the detection of specific anti-A. marginale antibodies, including the card-agglutination test6, complement fixation test7, indirect fluorescent antibody8,9 and enzyme linked immunosorbent assay (ELISA)4,5,10. Serologic tests do not discern between infected and non-infected animals but the presence of specific antibodies can be used for the elimination of positive reactors when purchasing or introducing cattle within an anaplasmosis-free herd or area. The efficiency of the test is of considerable relevance, and serologic data can also be valuable in evaluation of vaccine effectivity4,11.
The Terrestrial Manual, Chapter 3.4.1 of the World Organization for Animal Health (OIE)12, recommends commercial ELISA kits for the detection of A. marginale antibodies. These include a competence-ELISA (cELISA) based on a recombinant MSP5 protein5,13,14 and a conventional indirect ELISA (iELISA) kit also based on rMSP5 15. The Terrestrial Manual also recommends the use of in-house iELISA and provides a protocol for preparation of the antigen and the assay12.
In-house ELISA’s have been developed for serological diagnosis of many pathogens16-20. At INIFAP, an in-house iELISA kit was developed for the detection of antibodies against A. marginale in cattle serum. The assay is based on the use of initial bodies extracted from infected erythrocytes. Although the production of this antigen requires an initial substantial investment, the quantity and quality and longevity of the antigen allows for the performance of thousands of tests over a long period. This assay was standardized more than 20 yr ago11 and the batch of antigen prepared then, is still in use. The procedure of A. marginale antigen production was carried out again to ascertain the validity of the procedure and the test. The results in the present study are consistent for the serological diagnosis of anaplasmosis in experimental and field samples and at different antigen concentrations.
For the present work it was produced an antigen lot following a protocol originally developed for the preparation of antigen for the card agglutination-test (CAT-Ag), and Complement fixation test and adapted for ELISA9,21,22. The antigen was also tested for antigenicity, against control and field samples.
Black Aberdeen Angus calves from the Servicio Nacional de Sanidad, Inocuidad y Calidad Agroalimentaria (SENASICA) stock were used for replication of the microorganism. At the beginning of the procedure all animals were negative at end-point PCR for A. marginale23, Babesia bovis and B. bigemina24,25 as well for antibodies against all three pathogens. During the experimental period, animals were fed a balanced diet according to weight; water was provided ad libitum. Animals were maintained in isolation and handled under conditions that provided safety for both cattle and operators. Surgery, post-surgical treatment and care of cattle were performed according to the protocol approved by the Internal Committee for the Care and Use of Experimental Animals (CICUAE) of the CENID-SAI of INIFAP27, based on the surgical technique described by Alexander28 by certified veterinary personnel.
MEX-31-096-01 Anaplasma marginale Mexican strain Tizimín11,26, was used as the source of the antigen. This strain is cryopreserved in liquid nitrogen as 50% packed cell volume in 10% PVP-40 at 17% infected erythrocytes.
For monitoring, blood samples were drawn from the coccygeal vein using evacuated tubes with heparin as anticoagulant. Rectal temperature (RT), packed cell volume (PCV) estimated by the microhematocrit technique and percentage of infected erythrocytes (PIE, quantitated by observation of blood smears at the microscope) were recorded for analysis with each sample collection. Calf 1 was inoculated intramuscularly (IM) with 4 ml of just thawed Tizimín strain infected blood. Monitoring was carried three times a week until appearance of infected erythrocytes in Giemsa-stained blood smears at which time, monitoring was performed daily. The contents of one CPD-blood-bag was drawn. Buffy coat and plasma were removed by centrifugation and aspiration (Hermle Labortechnik, Model: Z 400 K, Series: 50095021); sedimented cells were suspended at 50% in physiological saline (0.85% NaCl), and IM inoculated to the second calf. The same procedure was used for the inoculation of the third calf. At PIE peak, blood from the third calf was drawn by puncture of the jugular vein in commercial CPD-blood bags fitted with 16G needles, (450 ml + 10 % CPDA). Xylazine at an appropriate dose was applied as a sedative to avoid suffering and the animal was physically restrained using ropes.
The blood was filtered through sterile gauze and erythrocytes sedimented by centrifugation in 500 ml volumes at 2,500 rpm at 4°C for 20 min (Hermle Labortechnik, Z 400 K, Series: 50095021). The buffy coat and plasma were removed by aspiration. Erythrocytes (red blood cells or RBCs) were suspended at 50% in cold PBS pH 7.2 and washed by centrifugation a total of three times; in the last wash, the RBCs were suspended in PBS-antibiotics (PBS-Ab, penicillin 1,000 U/streptomycin 1 mg/ml). The erythrocyte suspension was disrupted in a microfluidizer (Microfluidics, Hc-8000, Series: 99100) at 7,400 PSI) The lysate was centrifuged at 10,000 xg (Hitachi, RPR 9 12 818 rotor) at 4 °C for 30 min; the supernatant was discarded and the sediment suspended with 30 ml of PBS-Ab and homogenized by sonication (Omni Sonic Ruptor 400) for three cycles of 2 min at 50 % power in an ice bath with 1 min breaks to avoid overheating. The homogenate was processed in a high-pressure homogenizer at 1,200 PSI to release all the initial bodies that remained in the non-lysed RBCs and centrifuged at 16,300 xg, for 30 min at 4 °C. Giemsa-stained smears were made from the sediment of every step to monitor for white cell nuclei and RBC membranes. The Ag was adjusted to 4 % w/v in acetate buffer and homogenized by agitation with a magnetic stirrer for 30 min at room temperature. The protein in the Ag was quantified by the micro-Bradford (BioRad®) method using bovine serum albumin as the standard.
The antigenicity of this new batch of A. marginale antigen (Ag-2018) was verified by comparing it with a batch in use (Ag-2012). Enough antigen of each lot was mixed with an equal volume of 0.1% SDS in H2O29 and incubated for 30 min at room temperature (20 to 25 °C). The antigen-SDS mixtures were diluted in carbonate-bicarbonate buffer pH 9.6 to a final volume of 25 mL. Ag-2012 was routinely used at 1.07 µg/200 µL of protein/well. Both antigens were adjusted at the aforementioned concentration. For the purpose of this study, wells in microtiter plates received 200 µL volumes per well of reagents and washing solutions at each step of the procedure. Plates received 1.07 µg of protein/well (1X concentration) and incubated overnight at 4 °C, plates were then washed three times with PBS pH 7.2-Tween-20 at 0.05 % (PBS-T20) and blocked with 5% skim milk in PBS-T20 pH 7.2 for 30 min. After three washes with PBS-T20 control serum samples diluted 1:100 in PBS-T20 were run either in duplicates or triplicates. The plates were incubated for 1 h at 37 °C, and washed three times with PBS-T20. Rabbit anti-bovine IgG-alkaline phosphatase conjugate (Jackson ImmunoResearch Laboratories, Lot: 112108) diluted 1:10,000 in PBS-T20 were placed in each well; plates were incubated for 60 min at 37 °C and washed as described; P-nitrophenylphosphate 0.075% in Tris pH 9.5 buffer were added and allowed to incubate for 30 min at 37 °C. The plates were read at 405 nm in a microplate absorbance reader (BioRad, iMark™) and the optical density (OD) values were recorded. Two wells containing all components, except for serum, were used as blanks. The mean absorbance of these blank wells was subtracted from the absorbance values of every other well in the plate. The mean and standard deviation of replicates and, positive and negative sera controls was also calculated.
The new antigen was subjected to three assays to: a) verify its antigenicity in comparison to Ag-2012, against known control sera, b) define the limit of antigenicity and c) verify its sensitivity against field serum samples.
To verify antigenicity, 12 positive and 10 negative control sera routinely used to carry out the iELISA and officially used in the Hemoparasite Laboratory of the National Center for Animal Health Verification Services (CENAPA), were ran in duplicates against each, Ag-2012 and Ag-2018 at the same protein concentration (at 1.07 µg/200 µL, 1X). The mean, standard deviation and error were calculated for each set of replicates to determine that the assay had no errors.
To test for the antigenicity limit, four positive and four negative control sera were run in duplicate against each antigen at 2X (2.14 µg), 1X (1.07 µg), ½ X (0.535 µg) and ¼ X (0.268 µg) concentrations. The remainder of the assay was carried as described.
To verify the antigenicity against field samples, twenty (20) unknown problem sera were tested against both antigen batches at 1X concentration; all samples were run in duplicates. The cutoff point (CP) was calculated as described.
Results are expressed as the OD value of the sample minus the value of the blank reading. The positivity index (PI) for each serum sample was calculated as the quotient of the mean absorbance divided by the CP value, where (1= positive; <1= negative. Results were subjected to analysis of variance (ANOVA) by applying the Student t-test using Social Science Statistics available at https://www.socscistatistics.com/tests/anova/Default2.aspx. For the purposes of this report, the percentage that represents the value of the standard deviation (SD) from the mean of each pair of repetitions was used as error, in order to verify the performance of the operator. Whenever the error was ( 20, the result was discarded and the sample repeated. Means of field samples were subjected to χ 2 analysis with the on-line tools VassarStats, (http://vassarstats.net), and Diagnostic test evaluation calculator (https://www.medcalc.org/calc/diagnostic_test.php).
Using the procedure described, a maximal 65.7 PEI was reached in the last calf on d 7 with a 26 % PCV. Fourteen 500 ml blood-bags of infected blood were drawn from this last animal. Blood was processed and the antigen produced had a total yield of 144.26 mg of protein in a final volume of 210 ml, equivalent to 0.687 µg/µL of antigen. Ag-2012 which is routinely used at 1/200 dilution, was re-quantified as it was used as reference; this batch had 0.494 µg/µL.
To verify antigenicity, 12 positive and 10 negative control sera were run in duplicates against each, Ag-2012 and Ag-2018 at the same protein concentration (1.07 µg/well). The mean, standard deviation and error were calculated for each pair to determine that the assay had no errors. Analysis of variance and Student t test of mean values of each serum showed no significant differences (P≥0.5) with an F value of 0.99826 between positive control samples with either antigen.
Comparison of negative sera showed that the OD readings were slightly higher when tested against Ag-2012 (Figure 1); analysis of variance of negative OD means showed a significant difference (P>0.01) between the results for Ag-2018 vs Ag-2012 with an F value of 33.54294.
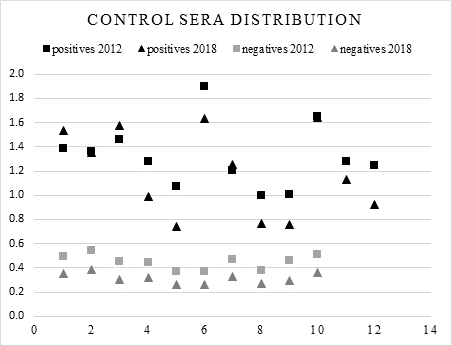
All serum samples were diluted 1:100 and tested in duplicates. Antigens were used at 1.07 (g / well.
Figure 1 OD values of control sera. Scatter distribution of 12 positive and 10 negative control sera tested against Ag-2012 and Ag-2018
From this first comparison the calculated cut-off point for the negative sera tested with Ag-2018 was 0.40, while for the same sera tested with the Ag-2012 it was 0.570. The mean positivity index for all positive sera tested with Ag-2018 was 3.44, whereas for the same sera tested with Ag-2012 this was 2.73 (Figure 2).
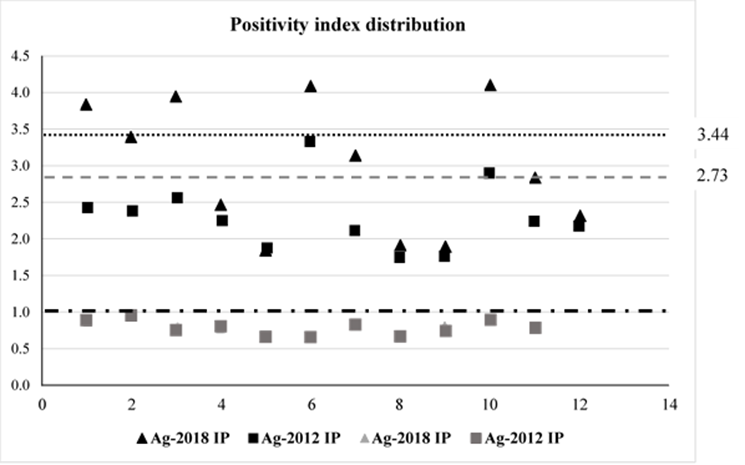
The mean PI value for all positive sera tested with Ag-2018 was 3.44 (dotted line); mean PI for the same sera tested with Ag-2012 was 2.73 (dashed line).
Figure 2 Positivity index (PI) scatter distribution. PI values (1= positive (red line); <1= negative
PI values for all positive sera (Figure 2) were calculated for their respective CP. The positivity indexes were 2.69 and 2.093 with Ag-2018 and Ag-2012, respectively. If is divided the mean PI (2.69) for Ag-2018 by Ag-2012 PI (2.093), it gives a quotient of 1.28, this value indicates that Ag-2018 is 1.28 times better at discriminating positive sera than Ag-2012.
Determination of the antigenicity limit. The two antigens were tested at four protein concentrations against four positive and four negative control sera as described. As observed, positive and negative sera showed similar distributions at decreasing concentrations against both Ag-2012 (upper panel) and Ag-2018 (lower panel, Figure 3). Analysis of variance within each antigen and between antigens was carried out taking the OD reading of each replica as an independent value. No significant differences were observed when comparing the results between antigens or by concentration against the positive sera; in the case of Ag-2018, when the values of the positive sera are taken, F test was not significant is observed, f = 0.56757 and a value of P= 0.639377, at P>0.05. Likewise, when the positive sera are tested against different Ag-2012 concentrations, no significant difference is observed either, f = 1.66871 and a value of P= 0.187871, which is not significant at P>0.05.
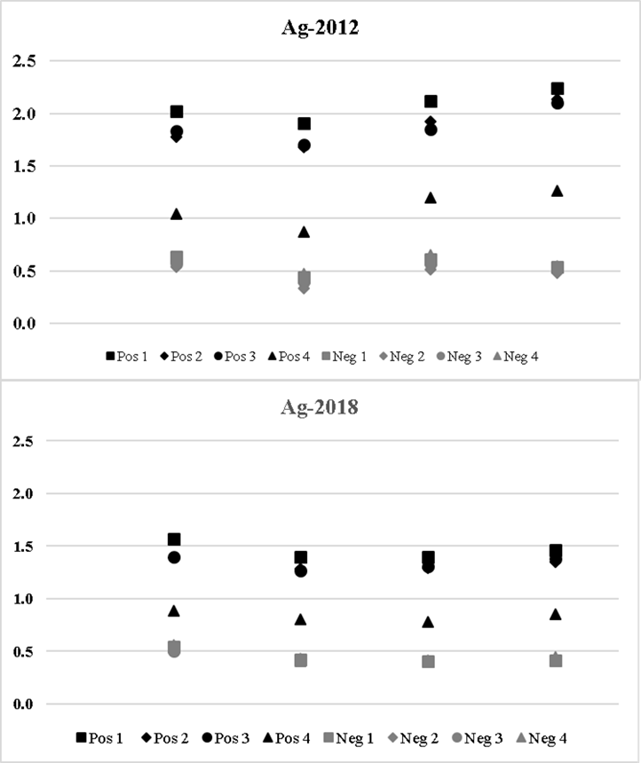
Four positive and four negative control sera were tested against (left to right) 0.25 X, 0.5 X, 1.0 X and 2.0 X antigen concentrations.
Upper panel shows the distribution of positive and negative control relation among the concentrations used for Ag-2012, while lower panel shows the respective for Ag-2018.
Figure 3 Antigenicity limit for AG-2012 and AG-2018
When applying ANOVA to the values of each positive sera for each concentration between antigens, there were significant differences. For example, when the results of the sera were compared at the two-fold concentration (2.14 µg/well), a value of F= 18.56523 was obtained; the P value was 0.000342 which was significant for P>0.05.
Finally, in order to verify the efficiency of the antigens at discriminating field samples, 20 sera from field cases were tested against both antigens in parallel at 1.07 µg of protein per well. The sera were run in duplicates. Additionally, three negative and three positive control sera were run in the same plate. The cutoff point for each antigen was 0.446 and 0.354 for Ag-2012 and Ag-2018 respectively. 13/20 samples were positive and 7/20 negative against Ag-2012; in contrast to 12/20 positives and 8/20 negatives when tested against Ag-2018. Additionally, two samples positive for Ag-2012 were negative for Ag-2018; on the other hand, one negative sample for Ag-2012 was positive for Ag-2018, thus, there was not 100 % coincidence between the two antigens (Table 1). However, when the results were analyzed by χ 2 test, the Fisher exact test statistic value was 0.2049; thus, there was no significant difference at P>0.05 between the two antigens at discriminating positives from negatives. According to the diagnostic test evaluation calculator (Table 2), there was 100.00 % sensitivity, 87.5 % specificity, a positive predictive value of 92.31 % and a negative predictive value of 100.00% for the two tests (Table 2).
Table 1 Antigenicity verification against field samples. Both antigens were used at a protein of 1.07 µg/well
| Ag 2012 | Ag 2018 | ||||
|---|---|---|---|---|---|
| Sera | Mean | PI | Mean | PI | |
| 1 | 0.514 | 1.15 | 0.365 | 1.03 | |
| 2 | 0.449 | 1.01 | 0.386 | 1.09 | |
| 3 | 0.466 | 1.05 | 0.386 | 1.09 | |
| 4 | 1.123 | 2.52 | 1.167 | 3.30 | |
| 5 | 0.350 | 0.79 | 0.269 | 0.76 | |
| 6 | 0.397 | 0.89 | 0.310 | 0.87 | |
| 7 | 0.491 | 1.10 | 0.356 | 1.00 | |
| 8 | 0.464 | 1.04 | 0.328 | 0.93 | |
| 9 | 0.967 | 2.17 | 0.937 | 2.65 | |
| 10 | 0.462 | 1.04 | 0.335 | 0.95 | |
| 11 | 0.353 | 0.79 | 0.279 | 0.79 | |
| 12 | 0.509 | 1.14 | 0.435 | 1.23 | |
| 13 | 0.424 | 0.95 | 0.376 | 1.06 | |
| 14 | 0.368 | 0.83 | 0.316 | 0.89 | |
| 15 | 0.414 | 0.93 | 0.319 | 0.90 | |
| 16 | 0.466 | 1.04 | 0.431 | 1.22 | |
| 17 | 0.999 | 2.24 | 0.973 | 2.75 | |
| 18 | 0.691 | 1.55 | 0.583 | 1.65 | |
| 19 | 0.497 | 1.12 | 13.0 | 0.444 | 1.26 |
| 20 | 0.370 | 0.83 | 0.306 | 0.86 | |
| Negative control | 0.427 | 0.334 | |||
| 0.385 | 0.299 | ||||
| 0.400 | 0.404 | 0.291 | 0.308 | ||
| Positive control | 1.114 | 1.051 | |||
| 1.125 | 1.023 | ||||
| 1.132 | 1.124 | 1.123 | 1.066 | ||
| Mean of negatives | 0.404 | 0.308 | |||
| SD | 0.021 | 0.023 | |||
| PC | 0.446 | 0.354 | |||
Serum samples were diluted 1/100 and ran in duplicates. The test conditions were the same as those used for routine examination of unknown samples. Samples in yellow background are those with a positivity index ≥ 1.
Table 2 MedCalc Diagnostic test evaluation. The (2 statistic is 7.2. The P-value is 0.00729
| Statistic | Value (%) |
95% CI |
|---|---|---|
| Sensitivity | 100.00 | 73.54 to 100.00 % |
| Specificity | 87.50 | 47.35 to 99.68 % |
| Positive likelihood ratio | 8 | 1.08 to 43.43 |
| Negative likelihood ratio | 0 | 1.28 to 50.04 |
| Disease prevalence (*) | 60.00 | 36.05 to 80.88 % |
| Positive predictive value (*) | 92.31 | 65.73 to 98.69 % |
| Negative predictive value (*) | 100.00 | |
| Accuracy (*) | 95.00 | 75.13 to 99.87 % |
* This result is significant at P<0.01. The Yates-corrected ( 2 statistic is 5. The P-value is .025347. Not significant at P<0.01.
Bovine anaplasmosis is an infectious disease that occurs mainly in tropical and subtropical regions, it is of global importance and, in Mexico, it is distributed throughout the national territory30,31 causing considerable losses in cattle2. Serologic diagnosis of this disease is a useful tool for prophylaxis, treatment and control strategies at the individual and herd levels4. Several techniques have been adapted for the detection of antibodies against A. marginale but immunoassays are preferred because of their scalability, suitability for automation, objectivity, and often higher sensitivity and specificity for the identification of asymptomatic bovines3.
When an indirect ELISA test for bovine anaplasmosis diagnosis was developed and compared with the complement fixation test (CFT)8,32, the iELISA showed several advantages over the CFT, such as objective interpretation and the ability to use hemoglobin tainted serum (not ideal but very common when working with field samples). Moreover, the iELISA is based on antibody-antigen affinity and not antibody concentration. However, several adaptations to the technique have been made since.
As the presence of both A. marginale and A. centrale is common in other countries the use of recombinant antigens in iELISA for the detection of antibodies against both agents have been incorporated5. Absence of A. centrale in Mexico allows for the continued use of iELISA with crude antigen for the routine serological diagnosis of A. marginale. In addition, reports of a positive rate for an ELISA based on whole-bacteria that was significantly greater than the seropositivity rate for an ELISA were recombinant antigens are used16,33,34 led to the hypothesis that crude native antigens allow for the detection of a wider range of antibodies as they present more than one epitope of the pathogen.
In the present work, a batch of crude A. marginale antigen was produced starting from blood of an infected splenectomized steer. The production of crude antigens involves great effort in terms of man-hours and costly disease-free animals, furthermore, it requires surgeries in the experimental animals and the postoperative care during recovery. Through this procedure though, it was possible to reach 65 % infected erythrocytes in the last bovine, from which approximately 14 L of blood were exsanguinated. After a laborious extraction and washing process, 210 mL of antigen were obtained with a final protein concentration of 144.26 mg, equivalent to 0.687 µg/µL. This concentration is higher compared with recombinant protein concentrations5 where the yield was 40 mg/L and 60 mg/L of culture for each recombinant protein used in that work. This supports the use of crude native proteins as the coating antigen for iELISA tests as its yield implies economic savings and more affordable prices for producers.
To test to for antigenicity of the new antigen, 12 positive and 10 negative control sera were run against both antigens. Mean OD readings of positive sera ran against Ag-2012 and Ag-2018 were not significantly different; in contrast, the OD values of the negative sera were higher when tested against Ag-2012 than with Ag-2018 (Figure 1). The mean of all negative sera was 0.314 for Ag-2018, while it was 0.450 when tested with Ag-2012. When the mean for positives was divided by the mean for negatives tested with Ag-2012, the quotient was 2.93 whereas that value was 3.79 for Ag-2018. Dividing 3.79 by 2.93 it gets a 1.28 value. This indicates that Ag-2018 is 1.28 times better at discriminating positives from negatives.
For the antigenicity limit test, antigens were assayed at 2X, 1X, ½X and ¼X protein concentration against a lot of four positive and four negative control sera. While there was a gradual decline in OD readings corresponding to antigen concentration, this decline was not statistically significant, indicating that both antigens were being used at an excess. The variations observed between concentrations of Ag-2018 were minimal, whereas the values of the same sera at the same concentrations of Ag-2012 were more heterogeneous even when they were not significantly different. It was not known if these variations are due to ageing or presence of debris in the antigen lot yet reading with the new lot were more consistent.
In the third test, the efficiency of the new antigen was tested against 20 field sera. There were 13 and 12 positives for Ag-2012 and Ag-2018 respectively. While there was no 100 % coincidence (Table 1), the samples that did not coincide were different only by hundredths of a unit (PI), i.e., when they were positive for one and negative for the other, they were right above the PI and vice versa, when they were negative they were right below the PI. This gives an 80 % correlation between antigens. Yet, statistical analysis showed 100 % sensitivity (a remarkable improvement over previously reported for a similar antigen)32, 87.5 % specificity, 92.31 % positive predictive value, 100 % negative predictive value and 95 % accuracy (Table 2). These results in terms of sensitivity and specificity are comparable to more recently developed ELISA’s3,5,17. Thus, these results show that both antigen lots are equally reliable to routinely run the in-house iELISA.
The present work provides evidence of the reproducibility in the production from one lot of antigen to another, even many years after being prepared, as long as the protocol is followed. The only difference in the preparation of these two antigen batches was the use of newer technology for the disruption of the infected erythrocytes i.e., a microfluidizer, a device that facilitates the process in terms of larger volumes being disrupted and apparently less debris in the final preparation. These two batches of antigen are now in use at the Laboratorio del Departamento de Helmintos y Hemoparásitos of the SENASICA for the diagnosis of bovine anaplasmosis in the cattle of Mexican producers.
It was concluded that the new batch of antigen (Ag-2018) is as good as the old batch. Both batches need to be titrated to reduce the concentration in order to optimize the use of each batch, which will in turn reduce the cost of the test making it more affordable for producers. Antigens produced by a governmental laboratory have a high quality standard and are reliable as they are regulated by international and international agencies. The need for commercially available ELISA kits is obviated when an in-house iELISA is available reducing the costs and importing periods thus making testing more efficient and expeditious.

