


Serviços Personalizados
Journal
Artigo
 texto em
  Inglês (pdf)
 Artigo em XML
 Referências do artigo
 Enviar este artigo por email
Indicadores
-
 Citado por SciELO
 -
 Acessos
Links relacionados
-
 Similares em
SciELO
Similares em
SciELO
Compartilhar

 Permalink
Revista mexicana de ciencias pecuarias
versão On-line ISSN 2448-6698versão impressa ISSN 2007-1124
Rev. mex. de cienc. pecuarias vol.13 no.3 Mérida Jul./Set. 2022 Epub 22-Ago-2022
https://doi.org/10.22319/rmcp.v13i3.5730
Technical notes
Genetic structure and environmental aptitude of sideoats grama [Bouteloua curtipendula (Michx.) Torr.] populations in Chihuahua, Mexico
a Instituto Nacional de Investigaciones Forestales, Agrícolas y Pecuarias (INIFAP). Campo Experimental La Campana. Carretera Chihuahua-Ojinaga km. 33.3, 32190. Aldama, Chihuahua, México.
b Universidad Autónoma de Chihuahua, Facultad de Zootecnia y Ecología. Chihuahua, México.
Research has increasingly centered on selecting outstanding grass genotypes for grasslands restoration, although most focuses on agronomic characteristics. Little importance has been given genotype genetic structure and environmental adaptation. An analysis was done of the genetic structure and environmental suitability of sideoats grama (Bouteloua curtipendula) populations in Chihuahua, Mexico. Fifty-one populations were evaluated through AFLP markers and analysis of their genetic structure. In a novel approach, the MaxEnt algorithm, commonly used only at the species level, was used to design models to quantify environmental aptitude of the groups generated by the genetic analysis. The STRUCTURE analysis divided the B. curtipendula populations into two different genetic groups (AMOVA; P<0.0001). Most (89 %) of the Group 1 populations are in the state’s semi-arid region while most (90 %) of the Group 2 populations are in the arid region. The MaxEnt results showed the two genetic groups to have different environmental aptitude. The climatic niche of Group 1 is mainly located in the state’s center and south, while that of Group 2 is in the center, west and northeast. Restoration programs involving B. curtipendula would benefit most from using local ecoregion-specific genotypes in areas for which they have the highest environmental aptitude.
Key words AFLP; Climatic niche; MaxEnt; STRUCTURE
En los últimos años se han realizado diversos trabajos para seleccionar genotipos sobresalientes de pastos para restauración de pastizales. Estos trabajos se han enfocado principalmente en características agronómicas y poca importancia se ha dado a la estructura genética y adaptación ambiental de los genotipos. El objetivo fue evaluar la estructura genética y aptitud ambiental de poblaciones de pasto banderita en Chihuahua, México. Se evaluaron 51 poblaciones de pasto banderita (Bouteloua curtipendula) a través de marcadores AFLP y análisis de su estructura genética. La aptitud ambiental de los grupos genéticos que se conformaron se determinó mediante el diseño de modelos que utilizan el algoritmo de MaxEnt. Lo anterior, representa una manera novedosa de usar el algoritmo, ya que comúnmente solo se utilizada a nivel especie. El análisis STRUCTURE dividió las poblaciones de pasto banderita en dos grupos genéticos diferentes (AMOVA; P<0.0001). El 89 % de las poblaciones integradas al Grupo 1 habitan en la región semiárida y 90 % de las poblaciones del Grupo 2 se encuentran en la región árida. Los resultados del análisis de MaxEnt revelaron que los grupos genéticos tienen aptitud ambiental diferente. El nicho climático del Grupo 1 se encuentra en el centro y sur del estado, mientras que el del Grupo 2 se localiza en el centro, oeste y noreste. Por lo anterior, se concluye que los programas de restauración con pasto banderita deben realizarse con genotipos locales de cada ecorregión del Estado y en áreas con mayor aptitud ambiental.
Palabras clave AFLP; Nicho climático; MaxEnt; STRUCTURE
Degradation of grasslands results in significant loss of the products and services that these ecosystems provide to humans, such as livestock fodder, water capture, soil retention and carbon sequestration1. Some of the main problems affecting grasslands are fragmentation, expansion of invasive species, conversion to agricultural uses, and human population growth, among others2. Grassland rehabilitation is becoming more frequent, and in recent years research has focused on selecting the grass species genotypes most apt for this application3,4,5. However, genetic material selection has concentrated mainly on agronomic traits, with minimal importance given genetic structure and potential adaptation to climatic conditions.
A grass species’ genetic structure is largely determined by its adaptation to environmental conditions within its distribution area. For this reason, understanding population genetic structure can help delimit genetic type distributions and their potential use in ecological restoration programs6,7. In northern Mexico, one of the species most used in grasslands restoration is sideoats grama [Bouteloua curtipendula (Michx.) Torr.] because it adapts to a wide range of climates and has excellent forage value. Due to its potential, recent research has emphasized selection of outstanding B. curtipendula genotypes for use in restoring grasslands in the state of Chihuahua, Mexico8,9,10. Identifying ideal genotypes requires analysis of the genetic structure of B. curtipendula populations in the state and of their environmental aptitude.
Mathematical models, such as the maximum entropy method applied in the MaxEnt software11, are an effective way of estimating areas with potential environmental suitability for the distribution of a species. Applying these models via MaxEnt provides advantages such as that only presence data is required, reliable results are produced with limited data, continuous and/or categorical environmental data are used, and are these graphically displayed via maps, facilitating interpretation. MaxEnt also employs a Jackknife test to identify the relevance of each environmental variable in species distribution11,12. Models generated with this program have been used widely to estimate climatic niche for flora and fauna species13,14. It has been used to identify areas with environmental aptitude with potential B. curtipendula distribution in Mexico and the United States15,16, a prerequisite for ecosystem rehabilitation17. However, MaxEnt has only been applied at the species level. It has not been used to estimate areas with environmental suitability for genetic types within B. curtipendula, which could make ecosystem restoration programs more efficient. The present study objective was to evaluate B. curtipendula genetic structure in the state of Chihuahua, Mexico, by applying MaxEnt models at the genetic group level and identifying those areas with environmental suitability for the resulting genetic groups.
Sampling was done in 51 populations, distributed in 29 municipalities of the state of Chihuahua, in northern Mexico (32° and 25° N; -103° and -109° W). To include as much genetic diversity as possible, sampling sites were located in the state’s arid and semi-arid ecoregions (Figure 1).
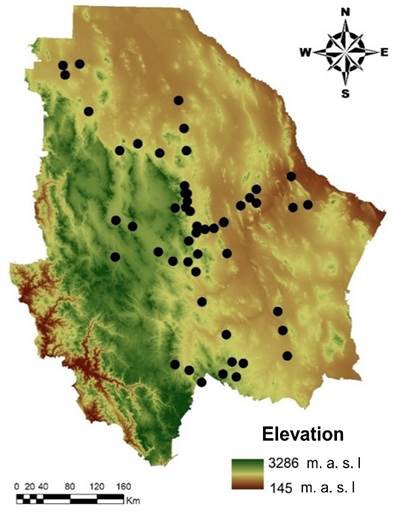
Figure 1 Geographic location of collected genetic material, corresponding to 51 sideoats grama (Bouteloua curtipendula) populations in Chihuahua, Mexico
The genetic structure of B. curtipendula was analyzed using Amplified Fragment Length Polymorphisms (AFLP) molecular markers. Plant leaves were collected at each site and DNA extracted from them based on the method proposed by Doyle & Doyle18. The AFLP analysis was done using the method proposed by Vos et al.19. First, 2 µl diluted DNA were digested by the EcoRI and MseI restriction enzymes and the digested DNA fragments ligated with EcoRI and MseI adapters. For pre-amplification, an extra nucleotide was added to the primers (EcoRI + A and MseI + A). Selective amplification was done using four combinations of fluorescence-labeled primers: MseI + CTG - EcoRI + AAG, MseI + CTG - EcoRI + ACT, MseI + CAG - EcoRI + AGG, MseI + CAG - EcoRI + AAC. The polymerase chain reaction (PCR) was done in a thermal cycler (Applied Biosystems Veriti 2720), with the following program: one cycle of 94 °C for 30 sec, 65 °C for 30 sec, 72 °C for 1 min; 12 cycles of 94 °C for 30 sec, 65 °C for 30 sec, 72 °C for 1 min; and 23 cycles of 94 °C for 30 sec, 56 °C for 30 sec, 72 °C for 1 min. The selective amplification products (2 µL) were mixed with 8 µl formamide and 1 µL Eco 700 GeneScan label (Applied Biosystems). Separation of the amplified fragments was done in a LI-COR DNA analyzer, loading 0.8 µL sample per well. Fluorescence-marked oligos or primers at different wavelengths (700 nm and 800 nm) were used. With the band pattern produced by the AFLP analysis, a binary band presence (1) / absence (0) matrix was constructed.
A genetic structure analysis, based on the Bayesian clustering algorithm, was applied to the binary data using the STRUCTURE version 2.3.4 software20,21. The STRUCTURE program was run 30 times for each K number of genetic clusters and analyzed from K=1 to K=10. Ten thousand (10,000) Markov-Monte Carlo chain (CMMC) repetitions and 100,000 burn-in periods were done in each run. This analysis was performed using a correlated allele frequency and admixture model. The optimal number of K clusters was considered to be that which attained the highest value for the average posterior probability (LK) and ΔK, according to the criteria proposed by Evanno et al22. The LK and ΔK values were obtained from the Structure Harvester website23. An analysis of the association between climatic zones and the distribution of the B. curtipendula populations in the genetic groups was done with a χ2 test of independence (α=0.05).
An analysis of molecular variance (AMOVA) was applied to compare the groups formed in the genetic structure analysis24, using the GenAIEx ver. 6 software25. Using the F (ΦST) statistics produced with the AMOVA, the inter-group gene flow index was calculated with the formula Nm= [0.25 (1- ΦST)/(ΦST)]26. The genetic data were also analyzed using the Monmonier algorithm to detect possible eco-geographical barriers affecting interpopulational gene flow. This analysis was run with the Barrier ver. 2.2 software27, in which the Bootstrap values of each barrier were calculated with 100 Dice coefficient distance matrices.
For the genetic groups formed by the STRUCTURE analysis, the GenAIEx ver. 6 software25 was used to calculate diversity statistics, polymorphic loci percentages, the average number of alleles per locus, the number of effective alleles, and the Shannon information (I) and Nei diversity (He) indices. Both these indices were estimated based on the assumption that each locus represents a pair of alleles when the presence or absence of an AFLP fragment is identified in a band. Diversity statistics for each population were compared using the Wilcoxon test with the Bonferroni correction (α=0.05).
Genetic group environmental fitness was identified using the MaxEnt algorithm in the MaxEnt ver. 3.3.3 software11. For each genetic group, the model was run separately with the coordinates of the genetically analyzed populations. Of the total data set, 75 % was used to test the models and the remaining 25 % to validate the models using the bootstrap test with 50 replicates. The generated environmental suitability models were evaluated using receiver operating characteristic (ROC) curve and area under the curve (AUC) analysis. The AUC score is useful for measuring model performance; the higher (closer to 1) the AUC value the better the model estimates species presence probability.
A total of 22 climatic variables were used as predictors to model the potential distribution of B. curtipendula. Nineteen were bioclimatic variables: annual mean temperature (Bio1); mean diurnal range (Bio2); isothermality (Bio3); temperature seasonality (Bio4); max temperature of warmest month (Bio5); min temperature of coldest month (Bio6); temperature annual range (Bio7); mean temperature of wettest quarter (Bio8); mean temperature of driest quarter (Bio9); mean temperature of warmest quarter (Bio10); mean temperature of coldest quarter (Bio11); annual precipitation (Bio12); precipitation of wettest month (Bio13); precipitation of driest month (Bio14); precipitation seasonality (Bio15); precipitation of wettest quarter (Bio16); precipitation of driest quarter (Bio17); precipitation of warmest quarter (Bio18); and precipitation of coldest quarter (Bio19)28. Three additional variables were included: average annual solar radiation (Rad); average annual evapotranspiration (Vapr); and average annual wind speed (Wind). These variables were obtained from the WorldClim database (https://www.worldclim.org) and limited to the geographic space of the state of Chihuahua using the ArcMap ver. 10.3 software. Climate data are interpolation estimates for 1950-2000, with a 30 arc-seconds spatial resolution. Applying MaxEnt generated a logistic map showing potential B. curtipendula distribution within a 0 (inadequate) to 1 (optimal) value range.
The genetic structure analysis (STRUCTURE) divided the sampled B. curtipendula populations into two genetic groups since K=2 produced the highest ΔK and LK values (Figure 2).
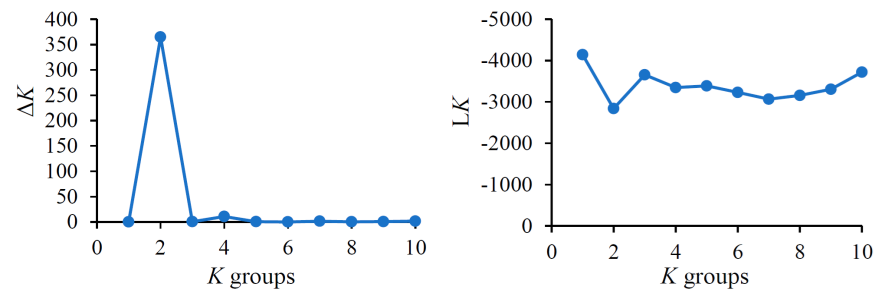
Values range from K=1 to K=10; K=2 is the optimum number of groups.
Figure 2 Delta K (ΔK) and average posterior probability (LK) values for the genetic structure of 51 sideoats grama (Bouteloua curtipendula) populations in Chihuahua, Mexico (grupos = groups).
Group genetic divergence appears to have been generated by adaptations to Chihuahua’s climatic conditions since there was a high association between the state’s ecoregions and group formation (χ2 = 32.9; P<0.0001). Most (89 %) of the Group 1 populations are in the semi-arid region and 11 % are in the arid region. In contrast, 90 % of the Group 2 populations are in the arid region and only 10 % in the semi-arid region (Figure 3B). These results agree with those of the BARRIER analysis, which identified genetic barriers coinciding with the border between the arid and semi-arid regions (Figure 3C).
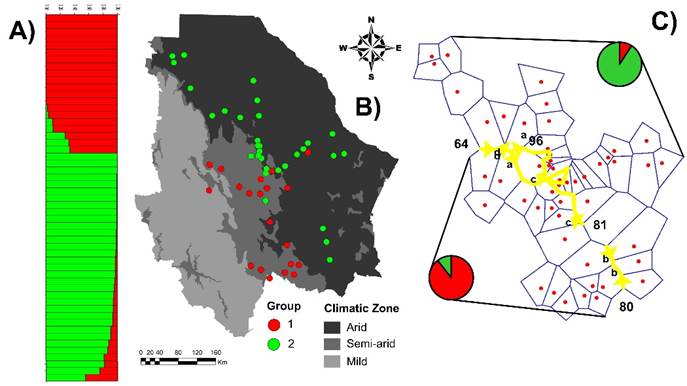
A) STRUCTURE analysis using K= 2 run and 186 AFLP fragments; the colors represent the proportion of probability of belonging to each genetic group. B) Group structure in geographic context of state’s climatic zones. C) Genetic barriers identified by BARRIER analysis; yellow lines represent barriers and numbers are Bootstrap values (1000 bootstraps). Pie charts represent percentage of populations in each genetic group within each region.
Figure 3 Genetic structure of 51 sideoats grama (Bouteloua curtipendula) populations in Chihuahua
The two groups generated by the STRUCTURE analysis were different (P<0.0001) according to the AMOVA. However, these differences only explained 7 % of overall variation, indicating the presence of substantial intragroup genetic variability. In grasslands it is common for intergroup differences to explain small proportions of overall variation due to generally high interpopulation genetic flow29,30. The low interpopulation genetic differentiation (7 %) identified by the AMOVA apparently contrasts with the marked association between the state’s climatic zones and group formation. This can occur because formation of a single locus can be closely linked to adaptation to climatic conditions. For example, a study of Bouteloua gracilis populations identified a close relationship between the frequency of a single locus and precipitation in the driest quarter of the year (R2=0.84) and precipitation seasonality (R2= 0.77)7.
Compared to previous research using AFLP markers, the observed intergroup genetic exchange (F st = 3.41) can be considered high. A study of Stipa pulcherrima grass distributed throughout Europe and Asia found a 0.76 gene flow among 30 populations31, while one of Microlaena stipoides found an F st of 0.02 among 85 Australian populations29.
The STRUCTURE analysis groups exhibited differences (P<0.05) in the evaluated diversity parameters. Group 2, mainly distributed in the arid region, had the highest values (P<0.05) in all the diversity parameters (Table 1). This coincides with the higher genetic diversity levels observed in Festuca ovina in arid zones32. In this study a positive correlation was identified between the Nei genetic diversity index and mean annual temperature (r= 0.56), while a negative correlation (r= -0.60) was found between this index and mean annual precipitation. Similar results have been reported for Dactylis glomerata33, and many studies indicate that plant populations tend to have greater diversity in adverse environments34,35. Plant populations in extremely arid environments tend to develop greater genetic diversity as a mechanism of adaptation to drought36.
Table 1 Diversity parameters for two genetic groups of sideoats grama (Bouteloua curtipendula) in Chihuahua, Mexico
| Group | Polymorphic loci (%) | Average alleles per locus |
Number of effective alleles |
I | H e |
|---|---|---|---|---|---|
| 1 | 59.1 | 1.56b | 1.34b | 0.302b | 0.211b |
| 2 | 90.4 | 1.90a | 1.43a | 0.427a | 0.280a |
ab Different letter superscripts in the same column indicate statistical difference (P<0.05; Wilcoxon test with Bonferroni correction). I= Shannon information index; H e = Nei genetic diversity.
Based on the Shannon information index (I), both STRUCTURE groups presented high intragroup genetic diversity (Group 1= 0.302, Group 2= 0.427). By comparison, an evaluation of 56 accessions of Panicum virgatum produced an I value of 0.31737, and one of 281 cultivars of Pennisetum purpureum produced I values ranging from 0.12 to 0.3438. Both these studies included large numbers of genotypes, further emphasizing that the present genetic diversity results for B. curtipendula are relatively high in both groups.
The MaxEnt model was run using the coordinates of 20 populations for Group 1 and 32 for Group 2. Average AUC value for the Group 1 climatic niche was 0.91 (SD = 0.031) while that for Group 2 was 0.93 (SD = 0.015). Both values indicate the estimated environmental suitability of both genetic groups is highly reliable11,39. The respective climatic niches of the groups clearly differ (Figure 4). Group 1 is distributed mainly in the center and south of the state (Figure 4A), while Group 2 is distributed in the center, west and northeast (Figure 4B). This suggests that the genetic groups diverged by evolutionary adaptation and that each genotype is adapted to regional climatic conditions.
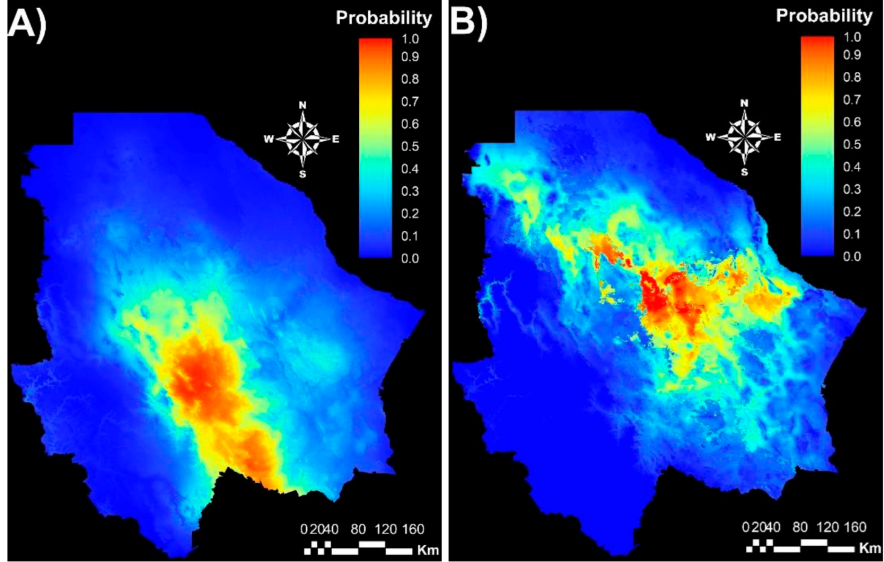
Group 1 (A) and Group 2 (B). Red color represents areas of greatest environmental aptitude and blue those of least aptitude.
Figure 4 MaxEnt model maps for two sideoats grama (Bouteloua curtipendula) genetic groups identified by AFLP markers and STRUCTURE analysis
Restoration programs involving B. curtipendula would probably benefit most by using local genotypes from each ecoregion. However, grassland restoration programs carried out to date in Mexico have employed genetic material from outside the region, mainly due to low seed availability. Bouteloua curtipendula varieties from the United States have been used; for example, the El Reno variety had unfavorable performance due to its low adaptability to the Mexican climate. A comparison of the El Reno variety with 277 B. curtipendula genotypes from different states in Mexico found that more than half of the genotypes provided better productive potential than the El Reno variety40. Other studies4 have reported that, compared to native material, the El Reno variety has low establishment and forage production capacities. Local materials are most effective in grassland restoration programs since they guarantee a greater probability of success and preserve local genetic structure41,42. This agrees with the present results, emphasizing that B. curtipendula revegetation programs in Chihuahua should use genotypes specific to each of the state’s ecoregions.
The high diversity identified within each genetic group suggests the possibility of selecting outstanding genotypes for each ecoregion. Previous studies have addressed genotype selection9,43, but focused mainly on productive characteristics and gave little weight to the environmental adaptation of each genotype. In contrast, the present results provide basic information on the potential environmental suitability of B. curtipendula populations in Chihuahua, which could be valuable in selection programs for productive genotypes.
The variables that contributed most to the Group 1 environmental suitability model were precipitation seasonality (79.5 %) and precipitation in the coldest quarter (7.4 %). The Group 2 environmental suitability model was mainly influenced by precipitation in the coldest quarter (36.2 %), annual thermal oscillation (13.2 %), average annual solar radiation (8.1 %) and average temperature of the driest quarter (7.4 %; Table 2). These results agree with previous studies modeling the B. curtipendula climatic niche in Mexico and the United States. In one, the ecological descriptors of thermal oscillation and precipitation contributed most to potential B. curtipendula distribution in Mexico16, while another found average annual temperature contributed most to potential distribution in the United States15.
Table 2 Relative contribution (%) of environmental variables to MaxEnt model for two genetic groups of sideoats grama (Bouteloua curtipendula) in Chihuahua, Mexico
| ID | Variable | Contribution (%) for Group 1 |
Contribution (%) for Group 2 |
|---|---|---|---|
| Wind | Average annual wind speed | 0.6 | 6.7 |
| Rad | Average annual solar radiation | 2.7 | 8.1 |
| Bio-2 | Mean diurnal range (Mean of monthly (max temp - min temp) | 2.2 | 2 |
| Bio-3 | Isothermality (Bio2/Bio7) (×100) | 1.1 | 13.2 |
| Bio-9 | Mean temperature of driest quarter | 1.8 | 7.4 |
| Bio-13 | Precipitation of wettest month | 0.1 | 4.3 |
| Bio-14 | Precipitation of driest month | 0.3 | 4.3 |
| Bio-15 | Precipitation seasonality (coefficient of variation) | 79.5 | 1.4 |
| Bio-17 | Precipitation of driest quarter | 0.2 | 5.3 |
| Bio-18 | Precipitation of warmest quarter | 0.8 | 3.4 |
| Bio-19 | Precipitation of coldest quarter | 7.4 | 36.2 |
A detailed analysis using response curves of the most influential variables showed Group 1 genotypes to have a higher probability of developing in areas with a 120+ precipitation seasonality coefficient and that they develop best in areas with 0 to 20 mm precipitation in the coldest quarter (December, January and February) (Figure 5). Group 2 genotypes also develop best in areas with 0 to 20 mm precipitation in the coldest quarter. In addition, they prefer areas with a 49 to 53 annual thermal oscillation, 18,500 to 19,000 w m-2 annual average solar radiation and a 6 to 10 °C average temperature of driest quarter. Group 1 genotypes apparently do not resist long periods of drought and needs occasional precipitation during the warmer months (June-October). Group 2 genotypes can resist less thermal oscillation, higher temperatures and greater solar radiation, but need precipitation concentrated in the warmer months. These response curve results highlight the evolutionary differences between the two genetic groups and the importance of using them in their source ecoregion.
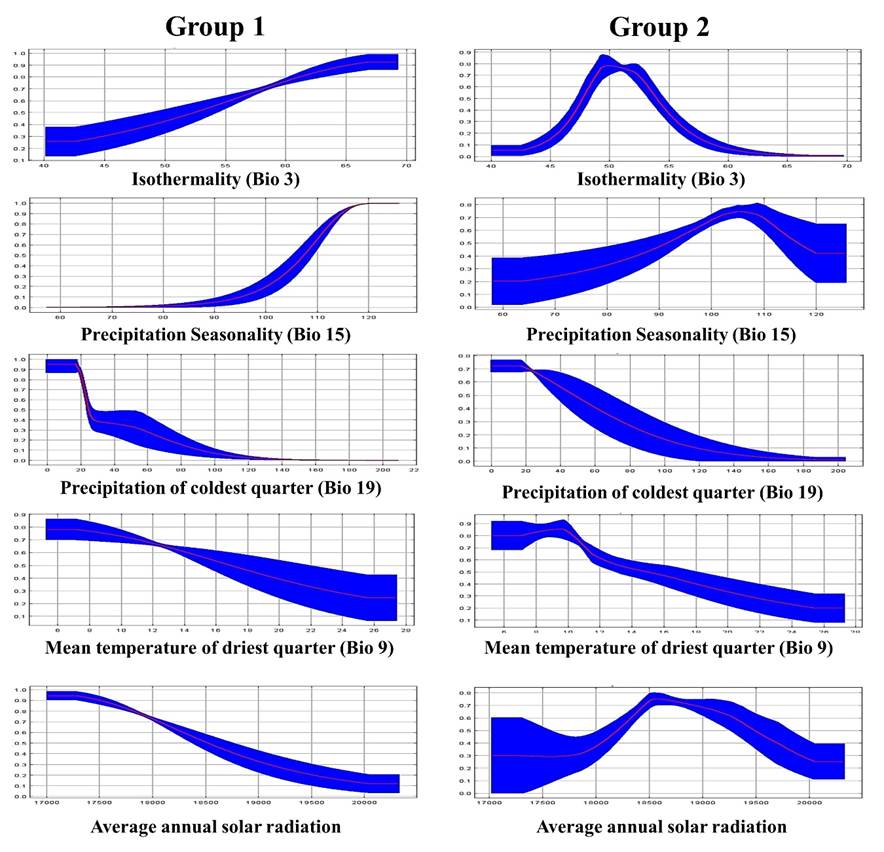
Figure 5 Response curves for two genetic groups of sideoats grama (Bouteloua curtipendula) based on the variables with greatest influence on environmental aptitude.
In conclusion, the state of Chihuahua, Mexico, sideoats grama Bouteloua curtipendula populations are divided into two genetic groups. Their distributions are highly influenced by ecoregion climatic conditions such that each genetic group has a different climatic niche. Restoration programs involving Bouteloua curtipendula could benefit from using local genotypes from specific ecoregions in environmentally suitable areas. These genotypes could also be used in edaphoclimatic conditions similar to those of their point of origin. The genetic diversity identified within each gene pool provides an opportunity for developing outstanding genotypes for use in ecoregion-specific grassland restoration programs. However, climatological projections are still needed to consider how climate change may affect Bouteloua curtipendula genetic types and what this could mean for future grassland restoration projects.
Literatura citada
1. Chaplot V, Dlamini P, Chivenge P. Potential of grassland rehabilitation through high density-short duration grazing to sequester atmospheric carbon. Geoderma 2016;271:10-17. [ Links ]
2. Barnosky AD, Matzke N, Tomiya S, Wogan GO, Swartz B, Quental TB, et al. Has the Earth’s sixth mass extinction already arrived? Nature 2011;471:51-57. [ Links ]
3. Morales NCR, Melgoza CA, Jurado GP, Martínez SM, Avendaño AC. Caracterización fenotípica y molecular de poblaciones de zacate punta blanca (Digitaria californica (Benth.) Henr.). Rev Mex Cienc Pecu 2012;3:171-184. [ Links ]
4. Sánchez-Arroyo JF, Wehenkel C, Carrete-Carreón FO, Murillo-Ortiz M, Herrera-Torres E, Quero-Carrillo R. Establishment atributes of Bouteloua curtipendula (Michx.) Torr. populations native to Mexico. Rev Fitotec Mex 2018;41:237-243. [ Links ]
5. Morales-Nieto CR, Álvarez-Holguín A, Villarreal-Guerrero F, Corrales-Lerma R, Pinedo-Álvarez A, Martínez-Salvador M. Phenotypic and genetic diversity of blue grama (Bouteloua gracilis) populations from Northern Mexico. Arid Land Res Manag 2020;34:83-98. [ Links ]
6. Mattioni C, Martin MA, Chiocchini F, Cherubini M, Gaudet M, Pollegioni, et al. Landscape genetics structure of European sweet chestnut (Castanea sativa Mill): indications for conservation priorities. Tree Genet Genomes 2017;13:1-14. [ Links ]
7. Tso KL, Allan GJ. Environmental variation shapes genetic variation in Bouteloua gracilis: Implications for restoration management of natural populations and cultivated varieties in the southwestern United States. Ecol Evol 2019;9:482-499. [ Links ]
8. Corrales LR, Morales NCR, Melgoza CA, Sierra TJS, Ortega GJÁ, Méndez ZG. Caracterización de variedades de pasto banderita [Bouteloua curtipendula (Michx.) Torr.] recomendadas para rehabilitación de pastizales. Rev Mex Cienc Pecu 2016;7:201-211. [ Links ]
9. Morales NCR, Avendaño AC, Melgoza CA, Vega GK, Quero CA, Martínez SM. Caracterización morfológica y molecular de poblaciones de pasto banderita (Bouteloua curtipendula) en Chihuahua, México. Rev Mex Cienc Pecu 2016;7:455-469. [ Links ]
10. Álvarez-Holguín A, Morales-Nieto CR, Melgoza-Castillo A, Méndez-Zamora G. Germinación de genotipos de pasto banderita (Bouteloua curtipendula) bajo diferentes presiones osmóticas. ERA 2017;4:161-168. [ Links ]
11. Phillips SJ, Anderson RP, Schapire RE. Maximum entropy modeling of species geographic distributions. Ecol Model 2006;190:231-259. [ Links ]
12. Abdelaal M, Fois M, Fenu G, Bacchetta G. Using MaxEnt modeling to predict the potential distribution of the endemic plant Rosa arabica Crép. in Egypt. Ecol Inform 2019;50:68-75. [ Links ]
13. Cruz-Cárdenas G, Villaseñor JL, López-Mata L, Martínez-Meyer E, Ortiz E. Selección de predictores ambientales para el modelado de la distribución de especies en MaxEnt. Rev Chapingo Ser Cie 2014;20:187-201. [ Links ]
14. Tran VD, Vu TT, Tran QB, Nguyen TH, Ta TN, Ha TM et al. Predicting suitable distribution for an endemic, rare and threatened species (grey-shanked douc langur, Pygathrix cinerea Nadler, 1997) using MaxEnt model. Appl Ecol Env Res 2018;16:1275-1291. [ Links ]
15. Martinson EJ, Eddy ZB, Commerford JL, Blevins E, Rolfsmeier SJ, McLauchlan KK. Biogeographic distributions of selected North American grassland plant species. Phys Geogr 2011;32:583-602. [ Links ]
16. Martínez SJÁ, Duran PN, Ruiz CJA, González EDR, Mena MS. Áreas con aptitud ambiental para [Bouteloua curtipendula (Michx.) Torr.] en México por efecto del cambio climático. Rev Mex Cienc Pecu 2020;11:49-62. [ Links ]
17. Hufford KM, Mazer SJ. Plant ecotypes: genetic differentiation in the age of ecological restoration. Trends Ecol Evol 2003;18:147-155. [ Links ]
18. Doyle JJ. A rapid total DNA preparation procedure for fresh plant tissue. Focus 1990;12:13-15. [ Links ]
19. Vos P, Hogers R, Bleeker M, Reijans M, Lee TVD, Hornes M, et al. AFLP: a new technique for DNA fingerprinting. Nucleic Acids Res 1995;23:4407-4414. [ Links ]
20. Pritchard JK, Stephens M, Donnelly P. Inference of population structure using multilocus genotype data. Genetics 2000;155:945-959. [ Links ]
21. Falush D, Stephens M, Pritchard JK. Inference of population structure using multilocus genotype data: dominant markers and null alleles. Mol Ecol Notes 2007;7:574-578. [ Links ]
22. Evanno G, Regnaut S, Goudet J. Detecting the number of clusters of individuals using the software STRUCTURE: a simulation study. Mol Ecol 2005;14;2611-2620. [ Links ]
23. Earl DA, VonHoldt BM. STRUCTURE HARVESTER: a website and program for visualizing STRUCTURE output and implementing the Evanno method. Conserv Genet Resour 2012;4:359-361. [ Links ]
24. Excoffier L, Smouse PE, Quattro JM. Analysis of molecular variance inferred from metric distances among DNA haplotypes: application to human mitochondrial DNA restriction data. Genetics 1992;131:479-491. [ Links ]
25. Peakall ROD, Smouse PE. GENALEX 6: genetic analysis in Excel. Population genetic software for teaching and research. Mol Ecol Notes 2006;6:288-295. [ Links ]
26. Whitlock MC, Mccauley DE. Indirect measures of gene flow and migration: FST≠ 1/(4Nm+ 1). Heredity 1999;82:117-125. [ Links ]
27. Manni F, Guérard E, Heyer E. Geographic patterns of (genetic, morphologic, linguistic) variation: how barriers can be detected by using Monmonier's algorithm. Hum Biol 2004;2:173-190. [ Links ]
28. Hijmans RJ, Cameron SE, Parra JL, Jones PG, Jarvis A. Very high resolution interpolated climate surfaces for global land areas. Int J Climatol 2005;25:1965-1978. [ Links ]
29. Mitchell ML, Stodart BJ, Virgona JM. Genetic diversity within a population of Microlaena stipoides, as revealed by AFLP markers. Aust J Bot 2015;62:580-586. [ Links ]
30. Wu WD, Liu WH, Sun M, Zhou JQ, Liu W, Zhang CL, et al. Genetic diversity and structure of Elymus tangutorum accessions from western China as unraveled by AFLP markers. Hereditas 2019;156:8. [ Links ]
31. Durka W, Nossol C, Welk E, Ruprecht E, Wagner V, Wesche K, et al. Extreme genetic depauperation and differentiation of both populations and species in Eurasian feather grasses (Stipa). Plant Syst Evol 2013;299:259-269. [ Links ]
32. Zhang C, Zhang J, Fan Y, Sun M, Wu W, Zhao W, et al. Genetic structure and eco-geographical differentiation of wild sheep Fescue (Festuca ovina L.) in Xinjiang, Northwest China. Molecules 2017;22:1316. [ Links ]
33. Zhang C, Sun M, Zhang X, Chen S, Nie G, Peng Y, et al. AFLP-based genetic diversity of wild orchardgrass germplasm collections from Central Asia and Western China, and the relation to environmental factors. PloS One 2018;13:e0195273. [ Links ]
34. Reisch C, Anke A, Rohl M. Molecular variation within and between ten populations of Primula farinosa (Primulaceae) along an altitudinal gradient in the northern Alps. Basic Appl Ecol 2005;6:35-45. [ Links ]
35. Kiambi DK, Newbury HJ, Maxted N, Ford-Lloyd BV. Molecular genetic variation in the African wild rice Oryza longistaminata A. Chev. et Roehr. and its association with environmental variables. Afr J Biotechnol 2008;7:1446-1460. [ Links ]
36. Zhao NX, Gao YB, Wang JL, Ren AZ. Genetic diversity and population differentiation of the dominant species Stipa krylovii in the Inner Mongolia Steppe. Biochem Genet 2006;44:513-526. [ Links ]
37. Todd J, Wu YQ, Wang Z, Samuels T. Genetic diversity in tetraploid switchgrass revealed by AFLP marker polymorphisms. Genet Mol Res 2011;10:2976-2986. [ Links ]
38. Wanjala BW, Obonyo M, Wachira FN, Muchugi A, Mulaa M, Harvey J, et al. Genetic diversity in Napier grass (Pennisetum purpureum) cultivars: implications for breeding and conservation. AoB Plants 2013;5:plt022. [ Links ]
39. Merow C, Smith MJ, Silander Jr JA. A practical guide to MaxEnt for modeling species’ distributions: what it does, and why inputs and settings matter. Ecography 2013;36:1058-1069. [ Links ]
40. Morales NCR, Quero CA, Melgoza CA, Martínez SM, Jurado GP. Diversidad forrajera del pasto banderita [Bouteloua curtipendula (Michx.) Torr.], en poblaciones de zonas áridas y semiáridas de México. Téc Pecu Méx 2009;47:231-244. [ Links ]
41. Mijnsbrugge VK, Bischoff A, Smith B. A question of origin: where and how to collect seed for ecological restoration. Basic Appl Ecol 2010;11:300-311. [ Links ]
42. Smith SW, Ross K, Karlsson S, Bond B, Upson R, Davey A. Going native, going local: revegetating eroded soils on the Falkland Islands using native seeds and farmland waste. Restoration Ecology 2018;26:134-144. [ Links ]
43. Morales-Nieto CR, Corrales-Lerma R, Álvarez-Holguín A, Villarreal-Guerrero F, Santellano-Estrada E. Caracterización de poblaciones de pasto banderita (Bouteloua curtipendula) de México para seleccionar genotipos con potencial para producción de semilla. Rev Fitotec Mex 2017;40:309-316. [ Links ]
Accepted: January 10, 2022
 Este es un artículo publicado en acceso abierto bajo una licencia Creative Commons
