


 texto em
  Inglês (pdf)
 Artigo em XML
 Referências do artigo
 Enviar este artigo por email
 Citado por SciELO
  Similares em
SciELO
Similares em
SciELO 
 Permalink
Introduction
Different therapeutic options have been used to treat horses for synovitis. The aims of intra-articular (IA) treatment to ameliorate signs of osteoarthritis are to decrease the inflammatory mediators and biochemical processes of inflammation, relieve pain, avoid destruction of the joint, and normalize function of the joint to allow the horse to resume its normal activities. Corticosteroids, polysulphated glycosaminoglycans, antibiotics, hyaluronic acid, DMSO (dimethylsulfoxide), and parasympathicolythic drugs, such as atropine, have been used intra-articularly by clinicians for the purpose of reducing joint pain and inflammation. Intra-articular administration of corticosteroids has fallen into abuse because, when administered intra-articularly, corticosteroids offer a prompt analgesia and remarkable improvement in the performance of the horse. A corticosteroid can be detected in the joint fluid or synovium for at least 21 d after injection, and so, this treatment, if unaccompanied by an appropriate period of rest and physiotherapy, can result in damage to articular cartilage, fibrosis, and dystrophic calcification of soft tissues of the joint, particularly the synovium. Synoviocytes become replaced by fibrous tissue, resulting in impairment of production of the normal elements comprising synovial fluid, resulting in suboptimal functioning of the joint1-3.
There is in vitro evidence that insulin, in concentrations up to 50 ng/mL, in cell cultures (75 cm2 monolayers) induces mitosis of chondrocytes and production of type II collagen4.
The doses of insulin instilled intraarticularly in this study were adapted from the surface of the cell culture plate to be applied in vivo. In addition, the total surface area of the articular cartilage of the antebrachiocarpal joint of a recently euthanized adult Warmblood gelding was measured to help determine the dose of insulin to be injected in this particular joint (92.642 cm2), by using Rhinoceros 4.0® software (Data not shown). Significant changes in synovial fluid composition of all measurable components or in serum glucose concentrations were determined. As far as it is known, pharmacokinetic studies of insulin instilled into the joints of human beings or animals have not been conducted. There is in vivo evidence that intra-articular IGF-1 and 2 increase mitosis of chondrocytes and production of type II collagen by chondrocytes5.
Anecdotally, 20 to 40 IU of insulin has been instilled into joints of 500 kg horses with osteoarthritis without evidence of adverse effects. Whether or not these doses are effective in stimulating mitosis of chondrocytes and production of type II collagen in vitro is not known.
There are no commercial, purified products of IGF-1 that can be instilled intraarticularly to treat horses for osteochondral defects. Though recombinant IGF-1, it is available only for in vitro use.
Material and methods
Six mixed-breed horses (3 mares, 2 geldings and 1 stallion) with a mean age of 5.08 yr old, and a mean weight of 361.11 kg, were used in this study. All were in a moderate to good body condition6. The horses were divided randomly into Groups 1, 2, and 3, each group being composed of two horses.
Each horse was confined to an individual stall (4x4m) during the study, all were fed 7-8 kg of oat hay three times daily, and water was provided ad libitum. Lameness and radiographic (MinXray® HFX 90V. Illinois, USA) evaluations of the carpal region were performed for every horse. Each horse was evaluated for clinical signs of equine metabolic syndrome (EMS), such as obesity (body condition ≥7/9), abnormal fat deposits (cresty neck), preputial or mammary gland inflammation, and signs of laminitis, such as diverging growth rings on the hoof capsules.
To ensure that no horse suffered from insulin resistance, each horse underwent an oral sugar test7. To perform this test, horses were fasted for 12 h, after which the basal blood glucose concentration was measured. Corn syrup (Karo® made for ACH Foods Mexico, S. De R. L. De C. V.) was then administered orally, using a 60 ml syringe, at a dose of 15 ml/100 kg (150 mg/kg). Blood glucose concentration was measured at 60, 75, and 90 min after oral administration of the corn syrup.
In order to determine the insulin concentration that is sufficient to induce mitosis in articular cartilage chondrocytes, we considered the area of cell culture plates (75 cm2) in which mitosis has been observed and then, extrapolated it to the whole joint surface4. This was determined by measuring the surface area of the cartilage of the antebrachiocarpal joint of a recently euthanized adult Warmblood gelding using Rhinoceros 7.0 software.
In this study, doses of 10, 15, and 20 IU of recombinant insulin [Humalog Lispro® (100 UI/ml), Eli Lilly and Company. Indianapolis, USA] were instilled into the antebrachiocarpal joint. These three doses were calculated by considering the systemic dose of insulin used to treat horses for hypoglycemia, and the concentration needed to achieve mitosis in cell culture plates; also considering the normal synovial fluid volume of the antebrachiocarpal joint8. Sterile 0.9 % saline solution was added to the insulin to increase the volume injected to 1 ml.
The left antebrachiocarpal joint of each horse was treated with insulin, and at the same time, the right antebrachiocarpal joint was injected with 0.9 % saline solution as control. The volume injected in the control joint was identical to that injected into the treated joint (i.e., 1 ml). Synoviocentesis was performed aseptically using a dorsal approach as previously described9. All horses were walked in hand for 10 min twice daily, the day of injection and for the entire duration of the study.
The concentration of glucose in blood, obtained from the jugular vein with a 25-ga needle, was measured by using a portable glucometer (Accu-chek Performa®, Roche Laboratories, USA). Blood was collected at 10 and 30 min and then hourly until 8 h, and then, every 6 h until 74 h post intra-articular injection of the insulin and isotonic saline solution. The concentration of glucose in at least 1 mL of synovial fluid collected from the antebrachiocarpal joint at 2, 4, and 6 h post intra-articular injection of insulin was determined by using the same glucometer.
Synovial fluid was assessed for its color, appearance viscosity, protein concentration, quality of its mucin clot, and types of cells contained within it before intra-articular injection of insulin and isotonic saline solution and at 2, 4, and 6 h post injection. These samples were taken by using the naive pooled-data analysis10. Insulin concentration in the joint was determined by HPLC, on samples obtained at 30 min, 1, 2-, 4-, 6-, 8-, and 12-h post-injection. IGF-1 concentration in synovial fluid was determined by ELISA (Horse IGF-1 ELISA kit, #MBS017382, MyBio-Source®) on samples obtained at 2, 4, and 6 h post intra-articular injection of two different doses of insulin, 15 IU and 20 IU. All samplings for the different evaluations made this a cross-over study of one factor (insulin) and three levels (dosages).
High-performance liquid chromatography (HPLC)
Synovial fluid, at least 1 mL, obtained from the antebrachiocarpal joints at 30 min, 1, 2, 3, 4, and 6 h post intra-articular injection of insulin and saline solution or saline solution alone was examined using HPLC. Samples were stored in Eppendorf tubes and analyzed by following the HPLC technique previously described11. Using this technique, the samples were deproteinized with acetonitrile:propanol (1:1); the mobile phase was with water and acetonitrile (1:1) and 1% trifluoroacetic acid. A C18 (5µm 4.6 x 250 mm) column was used, providing a recovery of 98 % of the elution volume, with a variation coefficient of 5 %. The limit of detection of this analysis was 0.39 µg/mL, and the limit of quantification was 0.39 µg/mL. The elution time was 20 min.
The serum concentrations of insulin vs time relationships were analyzed using compartmental pharmacokinetics through the software from PKAnalyst (MicroMath. Scientific Software, Salt Lake City, Utah, USA, 1995). With the results from the PkAnalyst program, a chi square was made to establish if there was a significant difference between the following measurements: half-life (K AE_half ), time of maximum concentration (T Conc_Max ), and time of residence (residence_time), for the three different dosages of insulin.
Results
Clinical evaluations before injection of insulin
None of the six horses used in this study had any clinical signs of equine metabolic syndrome (EMS) or insulin resistance, such as hoof deformities or abnormal adipose tissue deposits (Table 1).
Table 1 Physical characteristics of all horses. Hoof deformities, cresty neck and corporal condition were considered clinical signs of EMS.
| Cresty neck scale1 |
Corporal condition2 |
Height (m) |
Weight (kg) |
Sex* | |
|---|---|---|---|---|---|
| Group 1 | |||||
| Horse 1 | 1/5 | 4/9 | 1.69 | 465 | M |
| Horse 2 | 2/5 | 5/9 | 1.43 | 322.5 | G |
| Group 2 | |||||
| Horse 3 | 2/5 | 6/9 | 1.43 | 323 | G |
| Horse 4 | 2/5 | 6/9 | 1.46 | 351.2 | M |
| Group 3 | |||||
| Horse 5 | 2/5 | 5/9 | 1.53 | 388.5 | S |
| Horse 6 | 2/5 | 5/9 | 1.45 | 316.5 | G |
| Average | 1.83/5 | 5.1/9 | 1.49 | 361.11 | |
1Carter RA, et al. 2009, 2Henneke DR, et al. 1983. S= Stallion; M= Mare; G= Gelding.
It was not observed signs of lameness in any horse during the evaluation, which was performed with the horses trotting in a straight line on a hard surface and in a circle on soft surface, no signs were observed off lameness after each carpus was flexed for 1 min.
No pathological abnormality was observed during radiographic evaluation of the carpi.
None of the six horses displayed any clinically evident reaction to intra-articular instillation of insulin or isotonic saline solution (Table 2).
Table 2 Evaluation of circumference of the carpi of all 6 horses, 24-h post injection of insulin (cm)
| Horse | Basal joint perimeter |
Joint perimeter |
Basal joint perimeter |
Joint perimeter |
|---|---|---|---|---|
| Control | Control (24h) |
Treated | Treated (24 h) |
|
| 1 | 34.5 | 34.5 | 34.5 | 34.5 |
| 2 | 28.0 | 28.0 | 28.0 | 28.0 |
| 3 | 28.5 | 28.5 | 28.5 | 28.5 |
| 4 | 28.5 | 28.5 | 28.5 | 28.5 |
| 5 | 30.0 | 30.0 | 30.0 | 30.0 |
| 6 | 28.0 | 28.0 | 28.0 | 28.0 |
The synovial fluid was evaluated for changes in color, appearance, cellularity, and protein concentration in both treated and control joints, with no visible changes between the different samples12.
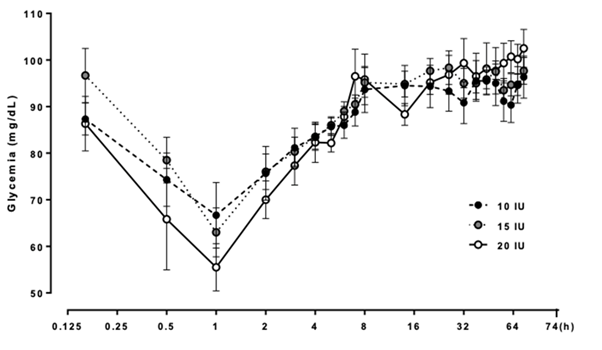
The oral sugar test revealed that none of the six horses had a concentration of glucose in the blood greater than 115 mg/dL (Figure 1). The concentration of glucose in the blood of all horses for all three doses, was significantly different (P<0.001) from the pre-treatment concentration at 30 min and 1 h after intra-articular injection of insulin (Figure 2).
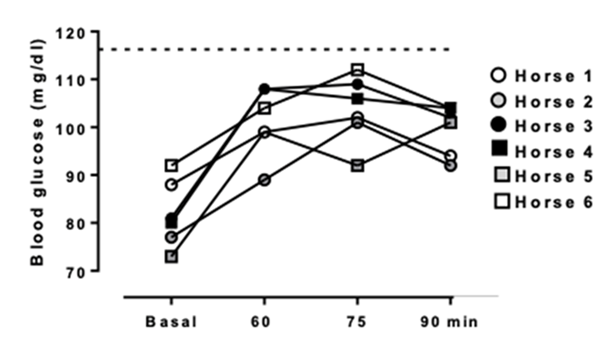
Blood samples were taken at 60, 75 and 90 minutes after oral administration of corn syrup.
Figure 1 Oral sugar test results, showing glycemia concentration for all 6 horses
A) 10 IU black circles; B) 15 IU gray circles; C) 20 IU white circles of insulin into the antebrachiocarpal joint.
Figure 2 Average concentration of blood glucose of all 6 horses after each horse was administered
A post hoc (Holm-Sidak, Tukey) test was used to determine if the difference was significant for all three doses in all blood samples taken from the 1-h sample, because the lowest blood concentration was seen at that sampling time in all three groups. The oral sugar test revealed that none of the six horses had a concentration of glucose in the blood greater than 115 mg/dL7.
There was no significant association between the changes seen in the concentration of blood glucose and the dose of insulin administered into the antebrachiocarpal joint, not when compared between all three different doses, 10 vs 15 vs 20 IU (P= 0.372) and nor when compared between different (paired) doses, 10 vs 15 IU (P= 0.369) and 15 vs 20 IU (P= 0.318).
Synovial glucose
The concentration of glucose within the antebrachiocarpal joint dropped at 2 and 6 h’ post-injection after 15 IU of insulin was administered into that joint, whereas the concentration of glucose within the antebrachiocarpal joint failed to drop at 2 and 6 h after isotonic saline solution was administered into that joint (Figure 3).
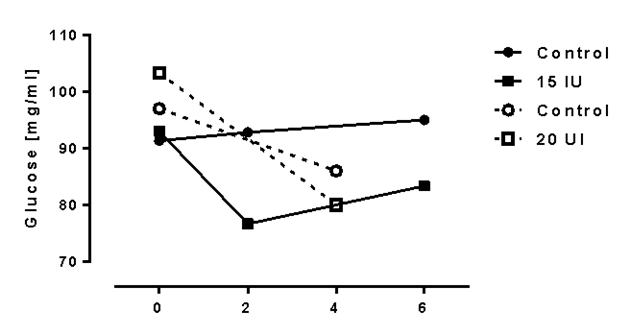
Figure 3 Concentration of glucose in the synovial fluid harvested from joints treated with 15 IU and 20 IU of insulin and joints treated with isotonic saline solution
The concentration of glucose within the antebrachiocarpal joint dropped at 4 h’ post-injection after 20 IU of insulin was administered into that joint, whereas the concentration of glucose within the antebrachiocarpal joint failed to drop at 4 hours after isotonic saline solution was administered into that joint (Figure 3).
The differences in concentration of glucose in the treated antebrachiocarpal joint did not differ significantly from that in the control antebrachiocarpal joint, however, when the dose of insulin injected into the treatment joint was 15 IU (P= 0.5945) or 20 IU (P= 0.235).
High performance liquid chromatography (HPLC)
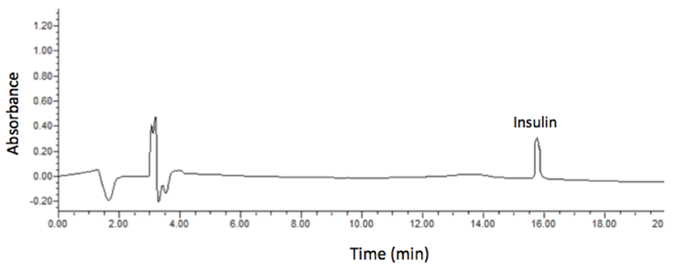
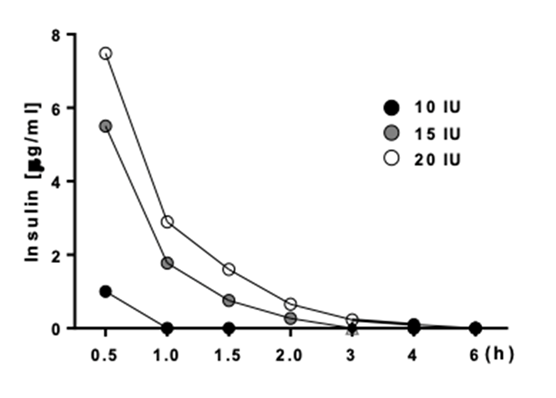
Insulin could not be detected in the synovial fluid in the treated joints at 8 and 12 h’ post-injection. Insulin in synovial fluid obtained at 2 and 6 h post injection from the antebrachiocarpal joint of all six horses treated with 15 IU of insulin and insulin in synovial fluid obtained at 1 and 4 h post injection with 20 IU of insulin taken at 30 min, showed a detection peak at 16 ± 0.5 min (Figure 4).
To establish a proper elimination curve, the synovial fluid sampling was set to obtain for 3 doses of insulin (10, 15 and 20 IU) from 7 samples in a 6-hour period, with a timeline of 0.5, 1, 1.5, 2, 3, 4, and 6 h.
Figure 4 Chromatogram of an absorbance peak of insulin at 16 min in every sample where insulin was detected
Insulin concentration within the treated joint varied through time and was dose dependent (Figure 5).
Pharmacokinetic analyses
The results obtained by HPLC were analyzed by using the program Micromath PkAnalyst®, using the program option for model: #5 one compartment, and first order kinetics.
This model provides the withdrawal, or absorption, constants, which in this case were the same, and the relationship between volume/dose found in the different sampling of concentration within the compartment (joint). It also provides the area under the curve (AUC) the half-life of elimination (T½(), the time of maximum concentration (T Conc_Max ), and the residence time (Residence_Time).
The mean values of the pharmacokinetic variables of the synovial fluid concentrations of insulin from the three groups (10, 15, and 20 UI), were compared using a non-parametric Kruskall-Wallis analysis, through the software package JMP (JMP Statistic Mode Visual 1989-1995 SAS Institute). As the data showed a non-normal distribution, individual pharmacokinetic values were compared using Dunn tests, after a Kruskall-Wallis analysis. The 10 IU group could not be compared pharmacokinetically since only had a one point of concentration and immediately it was found below the quantifiable limits. The group was considered statistically different from the other two groups. The independent variable was time, and the dependent variable was insulin concentration. The values were volume, dose, and the withdrawal constant K AE . The differences in these variables between the 15 and 20 IU doses were slight (Table 3).
Table 3 Calculated kinetic values for the 15 and 20 IU dose of insulin
| Variable | 15 UI Insulin | 20 UI Insulin | ||
|---|---|---|---|---|
| Result | Time (min) |
Result | Time (min) |
|
| Withdrawal half-life (KAE_half) | 0.199927931* | 11.99 | 0.232681513* | 13.8 |
| Maximum concentration time (TConc_Max) | 0.288435035* | 17.30 | 0.335688466* | 19.8 |
| Area under the curve (AUC) | 5.15211030 | NA** | 7.37122310 | NA** |
| Resident time | 0.576870070* | 34.61 | 0.671376931* | 40.2 |
A chi square test revealed, however, that there was no significant difference between the half-life of withdrawal or absorption (KAE_half), the time of maximum concentration (TConc_Max), and the residence time (Residence_Time) for the 15 and 20 IU doses (P=0.9851).
Synovial fluid analyses for IGF-1 concentration
To determine if there was correlation between the synovial concentration of exogenous insulin and synovial concentration IGF-1, it was measured IGF-1 concentration at 2, 4, and 6 h post intra-articular injection of insulin. It was evaluated only the groups of horses treated with 15 and 20 IU of insulin and observed significant differences between the basal concentrations of IGF-1 at the different sampling times (P<0.001); the 10 IU group was not considered for this analysis because the concentration parameters for this dose were too low to be measured by HPLC (Figure 6).
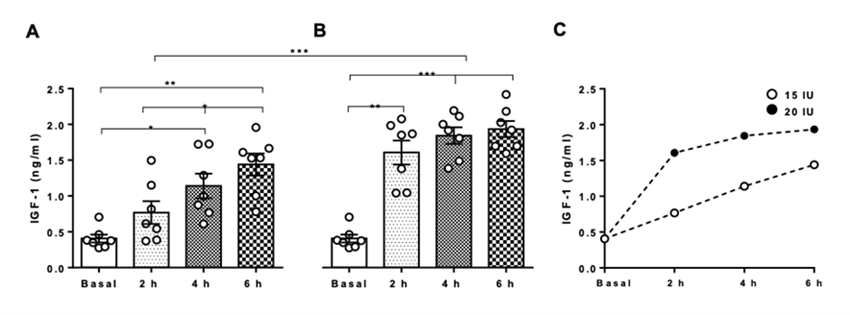
Filled circles represent horses treated intra-articularly with 20 IU and blank circles represent horses treated intra-articularly with 15 IU of insulin. *P<0.05; **P<0.01; ***P<0.001.
Figure 6 IGF-1 concentration in synovial fluid of horses treated intra-articularly with A) 15 IU and B) 20 IU of IGF-1 concentration in synovial fluid of horses treated intraarticularly. C) Positive correlation of the 2 distinct groups, between IGF-1 concentration and time of synovial fluid sampling
Discussion
Previous clinical evaluation
A basic clinical evaluation suggested that none of the six horses displayed clinical signs of Equine Metabolic Syndrome (EMS) or Insulin Resistance (IR), each had a body condition score below that established to be a risk factor for these conditions, and none had a cresty neck scale greater than 2 (a score greater 3 being a risk factor for EMS)6,7,13. An oral sugar test provided objective evidence that none of the horses had EMS or IR. No horse used in this study had a concentration of glucose in the blood greater than 115 mg/dL, the maximum concentration of normality as previously described7.
Clinical examination and the oral sugar test were both necessary to eliminate a metabolic abnormality that could alter glucose metabolism and, therefore, alter the degree of glycemia, caused by injecting insulin into a joint. The concentration of glucose in the blood sugar may have been altered had the horse been insulin resistant. It was not conducted more specific examinations for EMS or IR, such as determining the concentration of cortisol and/or ACTH in the blood, the intravenous glucose tolerance test, and the glucose insulin response test, and nor it did tested for pituitary pars intermedia dysfunction (PPID), because the aim of this paper was to determine the pharmacokinetic values of insulin instilled into the horse’s joint, its systemic and local effects, such as the analysis of variations of IGF-1 concentration on synovial fluid. The results obtained from the oral sugar test, along with the absence of clinical signs that could suggest risk factors to IR or EMS, were considered, by the authors, to be sufficient to include these horses in the study.
Post treatment clinical exam
The circumference of the carpus at the level of the antebrachiocarpal joint did not differ between the control and treated carpi, though this measurement was made with a measuring tape scaled in centimeters rather than millimeters. Based on the failure to detect a difference in circumference of treated and control carpi and failure of the horse to become lame on the treated limb, it was concluded that insulin injected into the antebrachiocarpal joints caused no clinical signs of inflammation.
Synovial analyses (Physical/Chemical)
Abnormal changes were seen in the synovial fluid obtained from treated and control joints, but the synovial fluid of the treated joints did not differ in color, appearance, protein concentration, and number of cells from that of the control joints. Changes seen in the treatment and control joints included a reddish discoloration, which was attributed to hemarthrosis caused by trauma to the synovium inflected during arthrocentesis12.
The incidence of develop septic synovitis post intra-synovial injection is quite high (34.1 %), however, if a proper aseptic technique is used, this is low. In a retrospective study of 192 horses admitted for treatment for septic arthritis or tenosynovitis, 22 % of infections were caused by synovial injection. In another retrospective study of 13 horses treated for tarsocrural joint infection, infection of 9 occurred after arthrocentesis of that joint. Because the concentration of protein in each treated joint was < 25 g/L and because only a small number of inflammatory cells (no bacteria) were observed during cytological examination of fluid harvested from the joint, it was concluded that instilling insulin to the joint causes no adverse reaction14,15,16.
In general, horses with septic arthritis have a cell count from 30-90 or 100x109/L, and a protein concentration of more than 25 g/L, even until 60 g/L. The protein values are associated with the pathologic condition that the joint goes by, it could be secondary to trauma or infection, where the values could be from 20-40 and >40 g/L respectively17.
None of the samples obtained in this study were near to the ones that are referred, which is why there was no infection or adverse reaction to insulin injected intra-articularly.
Statistical analyses
The amount of insulin instilled into the antebrachiocarpal joint significantly affected the concentration of blood glucose. For each of the three doses of insulin administered, the concentration of blood glucose was lowest at 1 h. It was found no association between the dose of insulin instilled into the joint and the concentration of glucose in the blood.
The concentration of glucose in the synovial fluid did not differ significantly between treated and control joints when 15 or 20 IU of insulin was instilled into the treated joint. A power study to determined how many samples of joint fluid showed that at least 30 samples would have to be tested to produce more reliable results.
High performance liquid chromatography (HPLC)
With an initial assay for the synovial fluid sampling by HPLC, it was not possible to analyze these results with the pkAnalyst program, because the elimination curve of the insulin instilled in the joint, could not be calculated, probably because the concentration of insulin was less than that, that could be detected by the equipment. Consequently, we had to modify the synovial fluid samplings to 30 min, 1 hour, 1.5, 2, 3, 4, and 6 h post intra-articular injection of all three doses of insulin for all horses.
The pharmacokinetics for the 15- and 20-IU doses were linear, but it was unable to establish a pharmacokinetic curve for the 10-IU dose, because the analytical technique was not sensitive enough to detect the concentration of insulin in the synovial fluid at 1 h. The curves for the 15- and 20-IU doses appeared similar, but was found slight differences in the pharmacokinetic values. For instance, for the 15-IU dose, the residence time of insulin, the maximum concentration time, and the area under the curve were slightly, but not significantly different from that of the 20-IU dose. For both doses (15 and 20-IU), the maximum concentration time was between 17-20 min, which correlates with the drop-in concentration of glucose in the blood seen at 30 min post intra-articular injection.
Studies are needed to evaluate the direct effect of insulin on chondrocytes, because the blood glucose concentration in treated joints did not differ significantly from that in the control joints, suggesting that the insulin does bind to its receptor causing the concentration of glucose in the synovial fluid to drop. Studies are needed to determine when the synovial concentration of glucose returns to normal.
The time of action of the insulin in the joint or its pharmacokinetic effects could vary from the ones observed in this study, if a similar study was performed using a larger number of horses (e.g., n>30), but this study provides data for comparison for future studies.
Based on the results of this study, it suggests that the horse should be observed for one hour after injecting insulin intra-articularly, to ensure that drop in concentration of blood glucose does not cause clinical signs of hypoglycemia.
The chromatograms obtained with HPLC were like the ones previously observed after instilling insulin to a joint, observed an insulin peak at 15.8 min11. In this study these peaks were observed at 16 ± 0.5 min. Because the residence time, half-life time, and maximum concentration time were higher with the highest dose of insulin (20 IU), it suggests using this dose when treating a horse for osteoarthritis by instilling insulin intra-articularly, because at this dosage, the insulin’s effect in the joint was more durable than were the lower doses.
Growth factors are a group of proteins, that play an important role in tissue repair by enhancing cellular proliferation, survival, division, growth, and differentiation. IGF-1 is the most important and powerful growth factor for cartilage repair18.
Insulin and IGF-1 have a very similar structure; they share a homologous sequence, they have a similar three-dimensional structure, and they have weakly overlapping biological activity19. IGF-1 folds into two thermodynamically stable disulfur isomers (via disulfur bond swipe), whereas insulin folds into one unique stable tertiary structure. This is due to post translation processing, that can achieve two different structures with the same aminoacidic sequence. The disulfur bond swipe of IGF-1 allows the protein to change its affinity for receptor bonding. It appears to be able to bond insulin and its own receptor19.
It hypothesizes that insulin can alter this affinity and in some cases bond to the IGF-1 receptor, activating its signaling pathway, since this growth factor has autocrine, paracrine and endocrine functions, it serves as its own positive feedback for activating MAPK/AKT signaling pathways. Instilling insulin into a joint, as a treatment for osteoarthritis of that joint, may be an option for horses suffering from osteoarthritis, because IGF-1 is not available commercially for use in joints of horses18,20.
Conclusions and implications
It was unable to detect any adverse local or systemic reaction to insulin instilled intra-articularly. The residence time of the insulin within the antebrachiocarpal joint was relatively short and proportional to the dose. None of the three doses used in this study [i.e., a low dose (10 IU), a medium dose (15 IU), and a high dose (20 IU)], significantly altered the concentration of glucose in the synovial fluid and blood. Intra-articular administration of exogenous insulin enhanced IGF-1 expression in synovial fluid, and this expression seemed to be dose and time dependent. Studies are needed to clarify the mechanism by which this expression of IGF-1 is enhanced in the equine joint. As far as it is known, there are no studies of insulin used intra-articularly in human or veterinary medicine, therefore this is the first in vivo study. This is a descriptive study, and believe it to be the first in vivo study demonstrating that insulin can be injected safely into a joint. This study could be a base for other studies examining the efficacy of insulin in ameliorating the clinical signs of osteoarthritis in horses.

