


Serviços Personalizados
Journal
Artigo
 texto em
  Inglês (pdf)
 Artigo em XML
 Referências do artigo
 Enviar este artigo por email
Indicadores
-
 Citado por SciELO
 -
 Acessos
Links relacionados
-
 Similares em
SciELO
Similares em
SciELO
Compartilhar

 Permalink
Revista mexicana de ciencias pecuarias
versão On-line ISSN 2448-6698versão impressa ISSN 2007-1124
Rev. mex. de cienc. pecuarias vol.12 no.1 Mérida Jan./Mar. 2021 Epub 20-Set-2021
https://doi.org/10.22319/rmcp.v12i1.5109
Articles
Genetic diversity of creole chickens in Valles Centrales, Oaxaca, using microsatellite markers
a Colegio de Postgraduados., Campus Montecillos. Recursos Genéticos y Productividad-Ganadería. Texcoco, México.
b Colegio de Postgraduados. Campus Montecillos. Recursos Genéticos y Productividad-Genética. Texcoco, México.
cInstituto Tecnológico del Valle de Oaxaca. Xoxocotlán, Oaxaca, México.
The population of creole chickens in small-scale farms is remarkably diverse and part of the poultry genetic reservoir in Mexico. Furthermore, this population represents a vital protein source for rural families. The genetic variability of creole chicken populations in the central region of Oaxaca was determined in blood samples collected from 109 creole chickens belonging to 17 populations and 30 Plymouth Rock chickens (control group). Ten microsatellite markers were used to detect a total of 109 alleles, with an average of 10.9 ± 3.1 alleles per locus. The observed heterozygosity (Ho) ranged from 0.575 (San Lucas) to 0.750 (San Antonio 2); the expected heterozygosity ranged from 0.625 (Control) to 0.733 (Huixtepec 2). Overall, it was observed an increase in the number of heterozygotes, evidenced by a global-level inbreeding (FIT) of 0.042; the FST population differentiation index was moderate (0.059), and the inbreeding of individuals within populations (FIS) was negative (-0.017), which indicates an excess of heterozygotes at that level. Cluster analysis grouped the Nazareno, ITVO, San Lucas, and San Antonio populations, indicating that these creole chicken populations are isolated and genetically differentiated in some characteristics. This information is important to design future conservation, selection, and multiplication programs for this species at the backyard level in the central region of Oaxaca, Mexico.
Key words Local poultry; SSR; Genetic diversity; Zoogenetic resources
Las poblaciones de gallinas criollas en explotaciones en pequeña escala poseen una gran diversidad y son parte del reservorio genético avícola en México; además, constituyen una importante fuente de proteína para las familias del medio rural. Con el propósito de conocer la variabilidad genética de poblaciones de gallinas criollas en la región central de Oaxaca, se tomaron muestras de sangre de 109 gallinas criollas, provenientes de 17 poblaciones y de 30 gallinas Plymouth Rock como testigos. Se usaron 10 marcadores de tipo microsatélites, con los que se detectó un total de 109 alelos, con 10.9 ± 3.1 alelos por locus en promedio. La heterocigosidad observada (Ho) varió de 0.575 (San Lucas) a 0.750 (San Antonino 2) y la esperada (He) de 0.625 (Testigo) a 0.733 (Huixtepec 2). A nivel general se encontró un incremento en el número de heterocigotos evidenciado por un nivel de endogamia global (FIT) de 0.042; el índice FST de diferenciación entre poblaciones fue moderado (0.059) y la endogamia de individuos dentro de poblaciones (FIS) resultó negativa (-0.017), lo que indica un exceso de heterocigotos a ese nivel. El análisis de conglomerados agrupó a las poblaciones de Nazareno, ITVO, San Lucas y San Antonio, evidenciando que son poblaciones de gallinas criollas aisladas y diferenciadas genéticamente en algunas características. Esta información es importante para diseñar futuros programas de conservación, selección y multiplicación de esta especie a nivel de traspatio en la región central de Oaxaca, México.
Palabras clave Aves locales; SSR; Diversidad genética; Recursos zoogenéticos
Introduction
The development of highly efficient and profitable intensive poultry production systems, in addition to the market demand for good quality and uniform meat and egg products, favors the incorporation of specialized breeds; this results in the decrease and genetic erosion of local genotypes, known as "creoles," due to the decline of their effective population size1. These creole genotypes are subjected to rustic practices in small-scale production units, adapted to the climate and low-input production systems, under favorable conditions, and are tolerant to diseases2. Furthermore, these genotypes are part of the cultural patrimony of rural communities. For this reason, the FAO3 has highlighted the importance of the identification and conservation of local chickens, paying particular attention to their breeding4. Due to their biological diversity, these chickens undergo continuous change as a result of natural selection and migration processes.
Microsatellites are molecular markers of genetic variability at the DNA level; they consist of tandem repeats of one to six base pairs. These markers are widely used because their random distribution in the genome, high polymorphism, and codominant inheritance5,6. This technique results in descriptive genetic statistics, such as heterozygosity, genetic distance, effective number of alleles, and polymorphic information content of the markers between closely related populations.
In Mexico, few studies have evaluated the genetic diversity of creole chickens in small-scale poultry systems using molecular markers. Therefore, it is essential to identify the existent populations of creole chickens and develop breeding and conservation programs that benefit the producers in rural areas7. This research aimed to determine the genetic diversity of populations of creole chickens in Valles Centrales, Oaxaca.
Material and methods
Sampling
Samples were collected from January to December 2015 using a two-stage cluster sampling8. The seven districts comprised the primary units, and the production units (PU) within the districts were considered secondary units. A sample of three primary units (n) was selected; 17 secondary units were randomly selected within these primary units. From each secondary unit (PU), six chickens were selected, resulting in a total sample size of 109 adult chickens: 93 adult creole hens, in the early laying stage and weighing 2.0 kg on average, and 16 adult roosters. The estimated inventory of adult chickens was 2,004 animals in the Valles Centrales region; thus, 6 % of the population was sampled. The sample size was obtained with a precision of 10 % and reliability of 90 %. Sampling was distributed in six geographic cores (ITVO: Nazareno and ITVO; Cuilápam: San Antonio, San Lucas, and Cuilápam; Etla: San Juan and Suchilquitongo; Huixtepec: Huixtepec 1, 2, 3, and 4; Ocotlán: Chichicapam, San Antonino 1 and 2; and Tlacolula: Teotitlán, Totolapam 1 and 2, plus a Plymouth Rock chicken control. Blood samples (2 mL) were drawn from the cubital vein of the wing of each animal and collected into Vacutainer tubes with EDTA. Samples were stored at -20 °C until further processing.
DNA extraction, microsatellite markers, and PCR procedure
DNA was extracted using the ChargeSwitch® gDNA Plant Kit (Invitrogen), following the protocol provided by the manufacturer. The DNA was then quantified using an ultra-low volume spectrophotometer (NanoDrop 2000, Thermo Scientific, Wilmington, DE, USA); DNA concentrations were adjusted to 10 ng μl-1. To evaluate genetic diversity, it was used ten pairs of previously reported9-11 microsatellite primers (Table 1). Primers were fluorescently labeled (6-FAM, HEX, or ROX) at their 5' end for PCR multiplex.
Table 1 Description of the primers of the microsatellite loci used; annealing temperature (Tm) and expected fragment size.
| Primer | 5’ - 3’ sequence | Tm (°C) | Size (bp) | Reference |
|---|---|---|---|---|
| MCW32-F | AGTTCCTTGTACAATTGTTA | 53.6 | 273 to 314 | b |
| MCW32-R | TCATTACTAGTACAATCAAGATGG | |||
| MCW68-F | CCTCACTGTGTAGTGTGGTAGTCA | 62 | 171 to 193 | c |
| MCW68-R | GAGAAGCTTGAACCTACCAGTCTT | |||
| MCW94-F | GGAGCTGGTATTTGTCCTAAG | 53.6 | 77 to 95 | a |
| MCW94-R | GCACAGCCTTTTGACATGTAC | |||
| MCW95-F | GATCAAAACATGAGAGACGAAG | 62 | 72 to 91 | a |
| MCW95-R | TTCATAGCTTGAATTGCATAGC | |||
| MCW114-F | AGCAAACTGCTCAGTGCTGTG | 62 | 261 to 293 | c |
| MCW114-R | GCGTTGAAAGTAGTGCTTCCG | |||
| MCW131-F | GTTGCTGATTCTAAGGCAGGC | 53.6 | 195 to 217 | c |
| MCW131-R | TTGCAGTTGTAAAGGTGTAGC | |||
| MCW134-F | GGAGACTTCATTGTGTAGCAC | 62 | 260 to 284 | b |
| MCW134-R | ACCAAAAGACTGGAGGTCAAC | |||
| MCW135-F | ATATGCTGCAGAGGGCAGTAG | 62 | 124 to 150 | a |
| MCW135-R | CATGTTCTGCATTATTGCTCC | |||
| MCW145-F | ACTTTATTCTCCAAATTTGGCT | 62 | 164 to 212 | b |
| MCW145-R | AAACACAATGGCAACGGAAAC | |||
| MCW158-F | GATCCATTTATAAAGACCCCAC | 53.6 | 164 to 224 | a |
| MCW158-R | TTCAATACTCCTTTGTAAAGCA |
a: Crooijmans et al. (1996); b: Yu et al. (2006); c: Horbańczuk et al. (2007).
The PCR reaction final volume was 25 µL, this included: 5 µL of 5X Buffer (Promega), 2 µL of 25 mM MgCl2 (Promega), 0.5 µL of 2 mM dNTPs mix (Promega), 1 µL of each primer (5 pmol), 1 UI of Taq polymerase (Promega), and 1 µL of template DNA (10 ng µl-1). The amplification was carried out in a thermocycler (Bio-Rad C1000TM) with the following conditions: initial denaturation at 94 °C for 5 min, followed by 35 denaturation cycles at 94 °C for 45 s, annealing for primer groups at 53.6 °C, 56.6 °C, and 62 °C for 1 min, extension at 72 °C for 1 min, and final extension at 72 °C for 10 min. PCR products were separated by capillary electrophoresis in an automated DNA sequencer (Genetic Analyzer ABI-3130 Applied Biosystems, Foster City, CA, USA) and analyzed with the GeneMapper® software of Applied Biosystems.
Statistical analysis
Based on the allelic profile determined in each individual for each locus, it was calculated the allelic frequencies, observed heterozygosity (Ho), expected heterozygosity (He), and Hardy-Weinberg equilibrium. Wright's F-statistics (FIS, FIT, and FST) were estimated based on the population's degree of genetic differentiation, considering the geographic cores as a clustering criterion. The POPGENE software (Version 1.3.2) was used to define the genetic diversity parameters. Furthermore, using the allelic frequencies of each locus, a principal component analysis was carried out with SAS V. 9.412, as well as a clustering analysis using the UPGMA method, which is based on the Euclidean distances between the creole chicken and reference populations, to determine their pattern of genetic similarity.
Results and discussion
Genetic diversity
A total of 109 alleles were identified in the 18 chicken populations. Considering the ten evaluated loci, the number of alleles ranged from six for MCW145 to 16 for MCW158, with an average of 10.9 alleles per locus. All loci were polymorphic (Table 2), coinciding with some of the primers with a chicken mapping9. MCW145 was the exception because it showed a lower value compared to previous reports9,10.
Table 2 Genetic diversity parameters detected with the 10 microsatellite loci evaluated in 109 creole chickens distributed in 17 populations
| Loci | Ra | Na | Ne | Ho | He |
|---|---|---|---|---|---|
| MCW131 | 7 | 8 | 2.493 | 0.596 | 0.601 |
| MCW158 | 8 | 16 | 8.682 | 0.525 | 0.888 |
| MCW32 | 6 | 13 | 5.175 | 0.877 | 0.809 |
| MCW94 | 7 | 10 | 5.170 | 0.912 | 0.809 |
| MCW114 | 7 | 11 | 3.748 | 0.590 | 0.736 |
| MCW134 | 9 | 12 | 5.065 | 0.927 | 0.805 |
| MCW135 | 7 | 15 | 10.982 | 0.845 | 0.912 |
| MCW145 | 8 | 6 | 2.210 | 0.080 | 0.549 |
| MCW68 | 7 | 9 | 4.035 | 0.749 | 0.755 |
| MCW95 | 7 | 9 | 2.176 | 0.476 | 0.542 |
| Mean | 10.9 | 4.974 | 0.658 | 0.738 | |
| Standard deviation | 3.142 | 2.866 | 0.133 | 0.133 |
Ra= previously reported alleles, Na= number of alleles, Ne= effective number of alleles, Ho= observed heterozygosity, He= expected heterozygosity, for each locus of the populations.
Previous studies of different local creole chicken breeds reported a lower total number of alleles per locus using different microsatellite loci in the same species. In Sweden, Germany, and Poland, studies reported 113, 217, and 62 alleles with 24, 29, and 10 loci, respectively1,13,14. Studies in China, Thailand, and India reported similar values; 276, 227, and 170 alleles with 29, 20, and 17 loci6,15,16. Similarly, researchers in Israel and Iran17,18 observed 211 and 310 alleles in local populations using 22 and 31 microsatellite loci, respectively, akin to what was observed in this study. The average number of reported alleles in the evaluated populations indicates a wide diversity of genes, similar to that in other countries with well-defined local chicken breeds.
The effective number of alleles per locus ranged from 2.1 (MCW95) to 10.9 (MCW135), with an average of 4.9. The observed heterozygosity (Ho) value ranged from 0.08 (MCW145 locus) to 0.92 (MCW134) (Table 2). Meanwhile, the expected heterozygosity (He) ranged from 0.54 (MCW95 and MCW145) to 0.91 (MCW135). Although these results suggest that the analyzed populations present a wide genetic diversity, they also indicate discrepancies between both types of heterozygosity, which indicates deviations from the Hardy-Weinberg equilibrium. These deviations result from migration or genetic drift processes, possibly attributed to the low number of individuals that generally make up each population. Other studies10,19 have reported He values of 0.69 and 0.75, respectively, for the MCW145 locus. These results were higher than what was observed in this study (0.54) because this locus is associated with a lower number of alleles, significantly influencing the He since each allele represents an additional term to the summation for He calculation. Previous studies10,20 for the MCW134 locus reported He values of 0.68 and 0.64 in China, respectively. These values are lower than the value obtained in this study (0.805).
The number of alleles found in populations per loci was in descending order: Plymouth Rock reference genotype, with 70 alleles, followed by Cuilápam with 65 alleles, contrasting with the Teotitlán population with 41 alleles, this being the lowest value (Table 3). However, the San Antonio 1 population had the higher effective number of alleles (43.8), followed by ITVO with 37.8 alleles; the Suchilquitongo population registered 29 effective alleles. These values imply the potential transmission of a high number of alleles to the following generation of creole chickens.
Table 3 Total number of alleles (TNa), total number of effective alleles (TNe), observed heterozygosity (Ho), and expected heterozygosity (He) in the studied populations
| Population | Ni* | TNa | TNe | Ho ± SD | He ± SD |
|---|---|---|---|---|---|
| Nazareno | 7 | 49 | 35.288 | 0.577 ± 0.296 | 0.684 ± 0.258 |
| ITVO | 7 | 60 | 37.805 | 0.674 ± 0.248 | 0.692 ± 0.229 |
| San Antonio | 7 | 48 | 31.166 | 0.630 ± 0.284 | 0.643 ± 0.234 |
| San Lucas | 7 | 48 | 32.506 | 0.575 ± 0.205 | 0.732 ± 0.098 |
| Cuilápam | 7 | 65 | 39.618 | 0.615 ± 0.311 | 0.691 ± 0.236 |
| Plymouth Rock† | 30 | 70 | 37.639 | 0.631 ± 0.297 | 0.625 ± 0.253 |
| Chichicapam | 6 | 53 | 34.564 | 0.633 ± 0.227 | 0.656 ± 0.238 |
| Teotitlán | 6 | 41 | 30.550 | 0.65 ± 0.298 | 0.654 ± 0.252 |
| San Juan | 7 | 53 | 32.539 | 0.587 ± 0.304 | 0.643 ± 0.265 |
| Suchilquitongo | 7 | 53 | 29.88 | 0.676 ± 0.361 | 0.661 ± 0.112 |
| San Antonino 1 | 7 | 63 | 43.851 | 0.690 ± 0.332 | 0.716 ± 0.230 |
| San Antonino 2 | 6 | 45 | 35.533 | 0.75 ± 0.316 | 0.695 ± 0.266 |
| Huixtepec 1 | 7 | 58 | 34.179 | 0.67 ± 0.316 | 0.71 ± 0.124 |
| Huixtepec 2 | 7 | 53 | 36.984 | 0.711 ± 0.262 | 0.733 ± 0.121 |
| Huixtepec 3 | 7 | 52 | 34.482 | 0.70 ± 0.247 | 0.718 ± 0.144 |
| Huixtepec 4 | 6 | 46 | 36.009 | 0.716 ± 0.324 | 0.710 ± 0.204 |
| Totolapam 1 | 7 | 42 | 32.729 | 0.673 ± 0.337 | 0.673 ± 0.264 |
| Totolapam 2 | 8 | 57 | 36.746 | 0.703 ± 0.325 | 0.681 ± 0.222 |
†Reference population Ni* = Number of individuals per population.
The observed heterozygosity (Ho) ranged from 0.575 in the San Lucas population to 0.75 in the San Antonino population, with an average of 0.741. Meanwhile, the expected heterozygosity (He) was lower in the reference group (0.625), suggesting that the kinship level between progenitors is lower. Furthermore, Huixtepec 2, San Lucas, and San Antonio 1 (0.733, 0.732, and 0.716, respectively) were the most genetically diverse populations, indicating greater potential in breeding programs. Previous studies in local chickens2,21-23, carried out in Sweden, Korea, China, and India, reported lower Ho and He values. Moreover, in local Tibetan and Chinese chicken populations, previous studies have reported He values of 0.798 and 0.7610,24, higher than those observed in this study, probably because of the use of different microsatellite loci.
Genetic differentiation of chicken populations
The Ocotlán and Tlacolula clusters had the lowest FIS values (-0.072 and -0.079), indicating a higher number of heterozygous individuals within each population. Overall, the less than zero values, close to the Hardy-Weinberg equilibrium, of these clusters indicate that the creole chickens are non-inbred populations. Studies have emphasized the adaptation of local chickens to the different geographical conditions in each country; therefore, the Hardy-Weinberg equilibrium remains constant across generations2,21.
As for the FIT, the lowest values were observed at the production unit level in the Ocotlán and control clusters (-0.003 and -0.037). In the Ocotlán cluster, the constant change of male breeders through direct purchase in regional markets results in an important local poultry genetic material flow at a regional level. While in the control group, due to its origin and established reproduction scheme, the production of heterozygous individuals is maximized. The Cuilápam cluster had the highest FIS (0.106) and FIT (0.177) values compared to the other clusters. However, statistically, by establishing confidence intervals, its heterozygous individuals are in equilibrium (Table 4); this is explained by the lack of a male substitution process in the production units, increasing the kinship relationship and the proportion of homozygous loci.
Table 4 Wright's F-statistics of ten microsatellite loci and confidence limits for seven chicken clusters in Valles Centrales, Oaxaca
| Populations | FIS | UL and LL | FIT | SL and IF | FST |
|---|---|---|---|---|---|
| ITVO | 0.015 | 0.1424 to -0.111 | 0.091 | 0.209 to -0.027 | 0.077 |
| Cuilápam | 0.106 | 0.253 to -0.040 | 0.177 | 0.337 to 0.017 | 0.079 |
| Control | -0.037 | 0.090 to -0.165 | -0.037 | 0.090 to -0.165 | 0.000 |
| Etla | -0.014 | 0.248 to -0.277 | 0.032 | 0.288 to -0.223 | 0.046 |
| Huixtepec | -0.040 | 0.170 to -0.250 | 0.038 | 0.234 to -0.156 | 0.076 |
| Ocotlán | -0.072 | 0.076 to -0.220 | -0.003 | 0.138 to -0.145 | 0.063 |
| Tlacolula | -0.079 | 0.172 to -0.330 | -0.001 | 0.227 to -0.229 | 0.072 |
| Global | -0.017 | 0.042 | 0.059 |
FIS, inbreeding indicator of an individual within a subpopulation; FIT, inbreeding indicator relative to the total population; FST, genetic differentiation index; UL, upper limit; LL, lower limit.
The Cuilápam, ITVO, and Huixtepec clusters had a moderate genetic differentiation (FST)25 (0.079, 0.077, and 0.076, respectively). These results indicate that these populations are different due to geographic isolation or handling practices, and, therefore, the genetic flow between the individuals from the different poultry regions is reduced. The global FST value of 0.059 indicates that 94.1% of the total variation is within the populations, only 5.9% between populations25 (Table 4). This value confirms a moderate genetic diversity within the populations, which is associated with the selection strategies of breeding males and replacement females carried out by the producers and demonstrates the potential for intrapopulation genetic breeding through recurrent selection schemes, taking advantage of the selection and recombination effects in a continuous process. Similar results have been reported26-28 in local chicken populations in Egypt, Bhutan, Asia, and China. Meanwhile, another study evaluating eight Korean domestic chicken breeds29 reported a differentiation coefficient of 0.180.
Relationships between the populations
The principal component analysis (PC) explained 32.2 % of the total variation with the three first components integrated by the most important alleles of the ten microsatellite loci (Table 5). The three-dimensional plane of the populations (Figure 1), based on the first three principal components, identifies the most distant populations: Nazareno= A, ITVO= B, Suchiquitongo= J, and Huixtepec=N, characterized for not allowing commercial poultry genetic material, suggesting a significant genetic flow within the same populations. Other studies have reported clear differentiation in local chicken populations of Kenya30 and India31, using PC and considering the two first components, with genetic variation values of 46.25 % and 23.37 %.
Table 5 Eigenvalues and proportion of the explained variance of the seven principal components with the frequency matrix of 109 alleles from chicken populations
| PC | Eigenvalue | Proportion | Accumulated | Alleles |
|---|---|---|---|---|
| 1 | 14.6493163 | 0.1344 | 0.1344 | MCW32-A, MCW32-E, MCW94-B, MCW94-D, MCW94-F, MCW134-A, MCW135-C, MCW135-E, MCW135 -G, MCW135-I, MCW135-O, MCW145-A, MCW95-A, MCW95-B |
| 2 | 10.7115308 | 0.0983 | 0.2327 | MCW158-B, MCW32-C, MCW32-D, MCW32-G, MCW32-H, MCW94-B, MCW114-K, MCW134-K, MCW135- B, MCW135-J, MCW68-A |
| 3 | 9.7335336 | 0.0893 | 0.322 | MCW131-C,
MCW131-H, MCW158- K, MCW94-A, MCW114-E, MCW134-G, MCW134-J, MCW135- D, MCW95-D, MCW95-H |
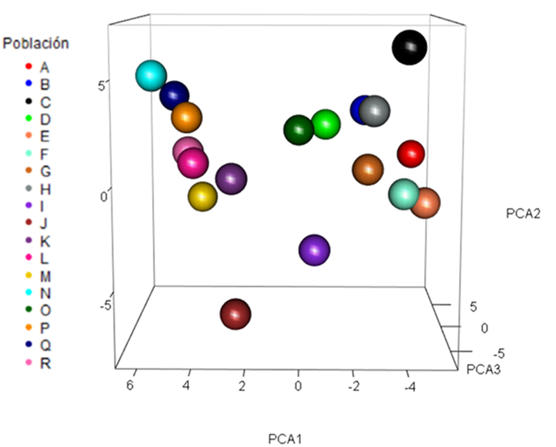
Figure 1 Three-dimensional plane of chicken populations with the principal components PC1 vs. PC2 vs. PC3, generated with the allelic frequencies of ten microsatellite loci
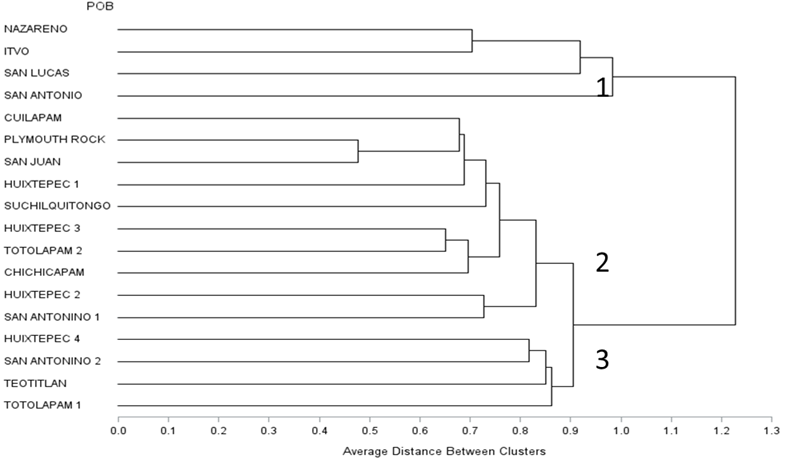
The groups obtained through the cluster analysis (Figure 2) were similar to those observed in the three-dimensional plane of the principal component analysis; three main groups are distinguished (genetic distance of 0.90). The first (Nazareno, ITVO, San Lucas, and San Antonio) includes isolated and genetically different populations that resulted from the reduced genetic flow between these creole populations and poultry populations with a degree of recombination with known breeds, such as Plymouth Rock. Subgroup 2 includes populations with a higher degree of genetic kinship, evidenced by the proportion of alleles with the reference group (Plymouth Rock) as a result of the introduction of this commercial breed as technological packages, which leads to crosses with chickens adapted to the environmental and handling conditions of the different rural areas, causing a loss and wear of the adaptation and survival characteristics of the creole chickens. The third subgroup included the Huixtepec 4, San Antonino 2, Teotitlán, and Totolapam 1 populations; these populations share similar allelic frequencies, suggesting variability in unique phenotypic traits characteristic of creole chickens.
Conclusions and implications
The creole chickens in Valles Centrales, Oaxaca, are genetically diverse; this is evidenced by the 109 alleles detected with the ten microsatellites used and expected heterozygosity of 0.738. The allelic profiles in this study allowed estimating a low degree of differentiation between individuals (FST=0.059) in the populations located in the geographic cores. In particular, the genetic diversity is more complex in the Tlacolula (0.072) and Ocotlán (0.063) populations. A minimal proportion (5.9 %) of the total genetic diversity is located between the creole chicken populations; the remaining 94.1 % resides within the populations.
Literatura citada
1. Abebe AS, Mikko S, Johansson AM. Genetic diversity of five local Swedish chicken breeds detected by microsatellite markers. PLoS One. 2015;10(4):1-13. [ Links ]
2. FAO. La situación de los recursos zoogenéticos mundiales para la alimentación y la agricultura. Food Agric Organ United Nations. 2010. [ Links ]
3. FAO. Recursos genéticos animales 56. Food Agric Organ United Nations. 2015;171. [ Links ]
4. Kaya M, Yildiz MA. Genetic diversity among Turkish native chickens, Denizli and Gerze, estimated by microsatellite markers. Biochem Genet 2008;46(7-8):480-91. [ Links ]
5. Muir WM, Cheng HW. Genetic influences on the behavior of chickens associated with welfare and productivity. 2nd ed. Genetics and the behavior of domestic animals. Elsevier Inc. 2014. http://dx.doi.org/10.1016/B978-0-12-394586-0.00009-3. [ Links ]
6. Dorji N, Daungjinda M, Phasuk Y. Genetic characterization of Thai indigenous chickens compared with commercial lines. Trop Anim Health Prod 2011;43(4):779-85. [ Links ]
7. Qu L, Li X, Xu G, Chen K, Yang H, Zhang L, et al. Evaluation of genetic diversity in Chinese indigenous chicken breeds using microsatellite markers. Sci China, Ser C Life Sci 2006;49(4):332-341. [ Links ]
8. Sukhatme, PV. Sampling Theory of Surveys with Application. Iowa State College Press. Ames, Iowa. 1970. [ Links ]
9. Crooijmans RP, van Oers PA, Strijk JA, van der Poel JJ, Groenen MA. Preliminary linkage map of the chicken (Gallus domesticus) genome based on microsatellite markers: 77 new markers mapped. Poult Sci 1996;75(6):746-54. [ Links ]
10. Ya-bo Y, Jin-yu W, Mekki DMM, Qing-Ping A, Hui-Fang L, Rong G, et al. Evaluation of genetic diversity and genetic distance between twelve Chinese indigenous chicken breeds based on microsatellite markers. Int J Poult Sci 2006;5(6):550-556. [ Links ]
11. Horbańczuk JO, Kawka M, Sacharczuk M, Cooper RG, Boruszewska K, Parada R, et al. A search for sequence similarity between chicken (Gallus domesticus) and ostrich (Struthio camelus) microsatellite markers. Animal Science Papers and Reports 2007;25(4):283-288. [ Links ]
12. SAS 9.4 Software. Institute Inc., Cary, North Carolina, USA. 2016. [ Links ]
13. Al-Qamashoui B, Simianer H, Kadim I, Weigend S. Assessment of genetic diversity and conservation priority of Omani local chickens using microsatellite markers. Trop Anim Heal Prod 2014;46:1-6. [ Links ]
14. Antos P, Andres K, Kapkowska E. Preliminary studies on genetic diversity of selected Polish local chicken varieties. J Cent Eur Agric 2013;14(1):11-22. [ Links ]
15. Bao WB, Shu JT, Wu XS, Musa HH, Ji CL, Chen GH. Genetic diversity and relationship between genetic distance and geographical distance in 14 Chinese indigenous chicken breeds and red jungle fowl. Czech J Anim Sci 2009;54(2):74-83. [ Links ]
16. Mukesh. Ruheena J, Uma G, Han J, Sathyakumar S. Cross-species applicability of chicken microsatellite markers for investigation of genetic diversity in Indian duck (Anas platyrhynchos) populations. African J Biotechnol. 2011;10(76):17623-17631. [ Links ]
17. Illel JH, Roenen MAMG, Reidlin PJF, Äki AM, Ortwijn MO. Biodiversity of 52 chicken populations assessed by microsatellite typing of DNA pools. Genet Sel Evol 2003;35:533-557. [ Links ]
18. Esfahani EN, Eskandarinasab MP, Khanian SE, Nikmard M, Molaee V. Genetic diversity of a native chicken breed in Iran. J Genet 2012;91:1-4. [ Links ]
19. Choi NR, Seo DW, Jemaa SB, Sultana H, Heo KN, Jo C, et al. Discrimination of the commercial Korean native chicken population using microsatellite markers. J Anim Sci Technol 2015;57(5):1-8. [ Links ]
20. Huo JL, Wu GS, Chen T, Huo HL, Yuan F, Liu LX, et al. Genetic diversity of local Yunnan chicken breeds and their relationships with red junglefowl. Genet Mol Res 2014;13(2):3371-3383. [ Links ]
21. Suh S, Sharma A, Lee S, Cho C, Kim J, Choi S. Genetic Diversity and Relationships of Korean Chicken Breeds Based on 30 Microsatellite Markers. Asian Australas J Anim Sci 2014;27(10):1399-1405. [ Links ]
22. Yang K, Luo X, Wang Y, Yu Y, Chen Z. Eight trinucleotide microsatellite DNA markers from Tibetan chicken, Gallus gallus domesticus. Conserv Genet Resour 2009;1:225-237. [ Links ]
23. Chatterjee RN, Bhattacharya TK, Dange M, Dushyanth K, Niranjan M, Reddy BLN, et al. Genetic heterogeneity among various Indigenous and other chicken populations with microsatellite markers. J Appl Anim Res 2015;43(3):266-271. [ Links ]
24. Yang K, Luo X, Wang Y, Yu Y, Chen Z. Ten polymorphic microsatellite loci in Tibetan chicken, Gallus gallus domesticus. Conserv Genet 2010;11(3):671-683. [ Links ]
25. Snyder L. Freifelder AD, Hartl DL. General genetics. UK: Jones and Bartlett publishers, Inc.;1985. [ Links ]
26. Ramadan S, Kayang BB, Inoue E, Nirasawa K, Hayakawa H. Evaluation of genetic diversity and conservation priorities for Egyptian chickens. Open J Anim Sci 2012;2(3):183-190. [ Links ]
27. Dorji N, Duangjinda M, Phasuk Y. Genetic characterization of Bhutanese native chickens based on an analysis of Red Jungle fowl (Gallus gallus gallus and Gallus gallus spadecieus), domestic Southeast Asian and commercial chicken lines (Gallus gallus domesticus). Genet Mol Biol 2012;35(3):603-609. [ Links ]
28. Ding FX, Zhang GX, Wang JY, Li Y, Zhang LJ, Wei Y, et al. Genetic diversity of a Chinese native chicken breed, Bian chicken, based on twenty-nine microsatellite markers. Asian-Australasian J Anim Sci 2010;23(2):154-161. [ Links ]
29. Zhao J, Li H, Kong X, Tang Z. Identification of single nucleotide polymorphisms in avian uncoupling protein gene and their association with growth and body composition traits in broilers. Can J Anim Sci 2006;345-350. [ Links ]
30. Noah O, Ngeranwa JJN, Binepal YS, Kahi AK, Bramwel WW, Ateya LO, et al. Genetic diversity of indigenous chickens from selected areas in Kenya using microsatellite markers. J Genet Eng Biotechnol 2017;15(2):489-495. [ Links ]
31. Kumar V, Mathew J, Sharma D, Kumar V, Shukla SK, Mathew J, et al. Genetic diversity and population structure analysis between Indian Red Jungle fowl and domestic chicken using microsatellite markers. Anim Biotechnol 2015;37-41. [ Links ]
Received: October 16, 2018; Accepted: February 03, 2020
 Este es un artículo publicado en acceso abierto bajo una licencia
Creative Commons
Este es un artículo publicado en acceso abierto bajo una licencia
Creative Commons
