


Servicios Personalizados
Revista
Articulo
 texto en
  Inglés (pdf)
 Artículo en XML
 Referencias del artículo
 Enviar artículo por email
Indicadores
-
 Citado por SciELO
 -
 Accesos
Links relacionados
-
 Similares en
SciELO
Similares en
SciELO
Compartir

 Permalink
Revista mexicana de ciencias pecuarias
versión On-line ISSN 2448-6698versión impresa ISSN 2007-1124
Rev. mex. de cienc. pecuarias vol.12 no.1 Mérida ene./mar. 2021 Epub 20-Sep-2021
https://doi.org/10.22319/rmcp.v12i1.5106
Articles
Genetic characterization of Mexican Pelibuey sheep using microsatellite markers
a Universidad Nacional Autónoma de México. Facultad de Medicina Veterinaria y Zootecnia, Departamento de Reproducción. Avenida Universidad 3000, Ciudad Universitaria, Ciudad de México, México.
b Universidad Nacional Autónoma de México. Instituto de Investigaciones Biomédicas, Departamento de Inmunología. Ciudad de México, México.
c Universidad Autónoma de Yucatán. Campus de Ciencias Biológicas y Agropecuarias. Yucatán, México
d Universidad Nacional Autónoma de México. Facultad de Medicina Veterinaria y Zootecnia, Departamento de Genética y Bioestadística. Ciudad de México, México.
e Universidad Nacional Autónoma de México. Facultad de Medicina Veterinaria y Zootecnia, Departamento de Fisiología y Farmacología. Ciudad de México, México.
This study aimed to genetically characterize 23 subpopulations of the Mexican Pelibuey sheep and a Cuban flock using nine microsatellite markers. A total of 99 alleles and a polymorphic information content (PIC) of 0.84 were observed. The observed FIS, FST, and FIT were 0.007, 0.151, and 0.158, respectively. Three primers (OarFCB304, OarJMP29, and ILSTS5) showed deviations in the Hardy-Weinberg equilibrium (HWE; P<0.05). In a subpopulation analysis, the number of alleles per subpopulation ranged from 28 to 49, the mean number of alleles (MNA) was 4.08, and the effective number of alleles (NE) was 3.25. The observed and expected heterozygosity values were 0.726 and 0.731, respectively. Six of the 24 evaluated subpopulations showed deviations of the HWE (P<0.05). The FIS values by subpopulation varied between -0.71 and 0.138. Nine private alleles were detected, and no shared alleles were observed. Using a principal component analysis (PCA), subpopulations were grouped into two clusters. Mantel's test determined that the genetic distance (measured by Nei's unbiased minimum distances) was not related to the geographic distance (r= -0.062; P>0.05). The population structure analysis determined two founder populations (K), similar to the PCA. This study concludes that the Pelibuey sheep in Mexico have high genetic diversity and that its subpopulations are grouped into two clusters, one of which shows the most preserved genetic material.
Key words Pelibuey; Genetic characterization; Microsatellites; Hair sheep
El objetivo fue caracterizar genéticamente 23 subpoblaciones de oveja Pelibuey de México y un rebaño cubano mediante nueve marcadores microsatélites. En el análisis por iniciadores, se observaron 99 alelos y un contenido de información polimórfica (PIC) de 0.84. El FIS, FST y FIT tuvieron valores de 0.007, 0.151 y 0.158, respectivamente. Tres iniciadores (OarFCB304, OarJMP29 e ILSTS5) mostraron desviaciones en el equilibrio de Hardy-Weinberg (HWE; P<0.05). En el análisis por subpoblaciones, se observó un rango de 28 a 49 alelos por subpoblación, número medio de alelos (MNA) de 4.08 y número efectivo de alelos (NE) de 3.25. Los valores de heterocigosis observada (HO) y esperada (HE) fueron 0.726 y 0.731, respectivamente. Seis de las 24 subpoblaciones evaluadas mostraron desviaciones del HWE (P<0.05). Los valores de FIS por subpoblación variaron entre -0.71 y 0.138. Se registraron nueve alelos privados y no se detectaron alelos compartidos por todas las subpoblaciones. Mediante un análisis de componentes principales (PCA), las subpoblaciones se agruparon en dos clústeres. La prueba de Mantel determinó que la distancia genética (medida mediante las distancias mínimas insesgadas de Nei) no se relacionó con la distancia geográfica (r= -0.062; P>0.05). El análisis de estructura poblacional determinó que el número de poblaciones ancestrales (K) fue igual a 2, mostrando consistencia con el PCA. Se concluye que la oveja Pelibuey de México tiene una alta diversidad genética y que sus subpoblaciones se agrupan en dos grupos, uno de los cuales muestra el material genético más preservado.
Palabras clave Pelibuey; Caracterización genética; Microsatélites; Oveja de pelo
Introduction
Pelibuey is the most important hair sheep breed in Mexico. It entered the country between 1930 and 1940 from Cuba1,2,3, and since then, no new genetic material has entered the country. Initially, Pelibuey sheep were distributed in tropical regions. Nowadays, it is spread throughout the country4. Pelibuey sheep are not highly productive; their biological importance lies in their ability to adapt to different environments and climates5 and reproduce throughout the year6.
The wide range of environments in which Pelibuey sheep have been bred has led to adaptive responses, which are part of their gene pool. However, in recent years, this breed has been subjected to indiscriminate crosses with breeds specialized in meat production to increase its productivity3,7; this has put at risk the original genetic diversity of the breed. Additionally, artificial insemination and the intense flow of genetic material between flocks have exacerbated the problem8.
An initial step for the conservation of animal genetic resources is breed characterization. The Food and Agriculture Organization of the United Nations (FAO) has proposed that the initial characterization should include a phenotypic description of the breed and its subsequent genetic characterization using molecular markers9. Molecular markers, such as microsatellites, have been used in population genetics to characterize several breeds9. More profound knowledge about the genetic diversity and variability and the population structure of different flocks in Mexico will allow us to determine the degree of risk of the Pelibuey sheep and, consequently, suggest viable strategies for its conservation. Therefore, this study aimed to characterize different Pelibuey subpopulations in Mexico using microsatellite markers.
Material and methods
Sampling
Blood samples were collected from 119 Pelibuey sheep from 23 domestic flocks and one Cuban flock. Domestic flocks were sampled in the agroecological zones that correspond to the tropical wet, tropical dry, and central mountainous regions. The geographical location of the domestic flocks is shown in Figure 1. Of the 24 flocks, 11 belong to universities or research institutes; the remaining 13 belong to private producers. All the flocks in this study were handled according to the Institutional Animal Care and Use Committee (SICUAE, as per its acronym in Spanish) of the School of Veterinary Medicine and Zootechnics of the UNAM. The flocks that belong to the Instituto Nacional de Investigaciones Forestales, Agrícolas y Pecuarias (INIFAP) in Yucatan (INIFAP Mocochá=IN-MOC) and Puebla (INIFAP Las Margaritas= IN-MAR) were considered as the domestic reference subpopulations because they were the first to settle in Mexico and their breeding practices have targeted the conservation of their breed. Furthermore, both have served as the basis for the formation of other domestic flocks. The inclusion criteria were the following: an external appearance characteristic of the Pelibuey sheep, female specimens, clinically healthy, and not related to each other.
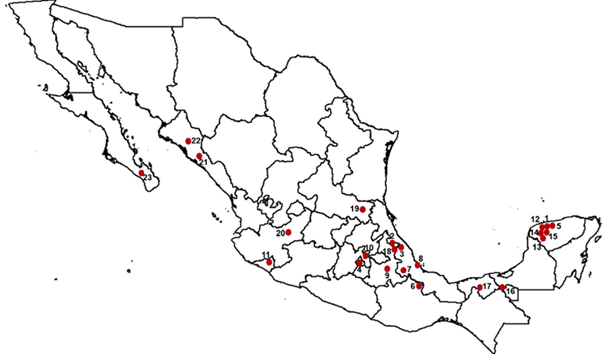
The order of the subpopulations can be found in Table 2. 1. INIFAP Mocochá (IN-MOC), 2. INIFAP Las Margaritas (IN-MAR), 3. Centro de Enseñanza, Investigación y Extensión en Ganadería Tropical (CEIEGT)-UNAM, 4. Centro de Enseñanza, Investigación y Extensión en Producción y Salud Animal (CEPIPSA)-UNAM, 5. Instituto Tecnológico de Conkal (ITC), 6. Universidad del Papaloapan (UNPA), 7. Colegio de Postgraduados Campus Córdoba (COLPOS-COR), 8. Universidad Veracruzana (UV), 9. Benemérita Universidad Autónoma de Puebla (BUAP), 10. Colegio de Postgraduados Campus Texcoco (COLPOS-TEX), 11. Universidad de Colima (UCOL), 12. Rancho San Alberto, 13. Rancho Garrido, 14. Rancho Belbesah, 15. Rancho Libertad, 16. Rancho Jalapa, 17. Rancho El Porvenir, 18. Rancho El Paraíso, 19. Rancho Santa Anita, 20. Posta El Cuatro, 21. Finca El Cielo, 22. Rancho La Fama, and 23. Rancho El Carrizal.
Figure 1 Geographical location of the domestic Pelibuey sheep flocks included in this study
Table 1 Global statistics obtained with the nine microsatellites
| Marker | TA (°C) |
SR (bp) |
NA | NE | HO | HE | PIC | I | HWE | FIT | FST |
|---|---|---|---|---|---|---|---|---|---|---|---|
| OarCP34 | 58 | 96-134 | 9 | 5.31 | 0.731 | 0.740 | 0.79 | 1.90 | NS | 0.111* | 0.099* |
| OarFCB304 | 58 | 140-210 | 11 | 7.34 | 0.812 | 0.741 | 0.85 | 2.11 | 0.0285* | 0.075* | 0.154 |
| OarJMP29 | 56 | 110-180 | 12 | 6.67 | 0.694 | 0.807 | 0.83 | 2.11 | 0.0002* | 0.185 | 0.056* |
| OarJMP58 | 58 | 130-185 | 14 | 8.68 | 0.737 | 0.761 | 0.87 | 2.35 | NS | 0.173 | 0.148 |
| DYMS1 | 58 | 155-225 | 11 | 8.53 | 0.697 | 0.778 | 0.87 | 2.26 | NS | 0.217* | 0.130 |
| ILSTS5 | 58 | 180-235 | 9 | 6.65 | 0.781 | 0.664 | 0.84 | 2.00 | 0.0180* | 0.092* | 0.228* |
| SRCRSP5 | 58 | 146-200 | 12 | 6.24 | 0.699 | 0.667 | 0.82 | 2.06 | NS | 0.180 | 0.215* |
| SRCRSP9 | 58 | 95-135 | 10 | 7.65 | 0.657 | 0.723 | 0.86 | 2.14 | NS | 0.255* | 0.180 |
| MAF33 | 60 | 115-170 | 11 | 5.73 | 0.730 | 0.707 | 0.80 | 1.97 | NS | 0.123 | 0.150 |
| Average | 11 | 6.97 | 0.726 | 0.732 | 0.84 | 2.1 | 0.158 | 0.151 |
Annealing temperature (TA), allele size range (SR), number of alleles (NA), effective number of alleles (NE), observed heterozygosity (HO), expected heterozygosity (HE), polymorphic information content (PIC), Shannon index (I), deviation from the Hardy-Weinberg equilibrium (HWE), fixation index of the entire population (FIT), and differentiation index between populations (FST) of the nine microsatellite markers used in the genetic characterization of Pelibuey sheep.
NS = non-significant; *P<0.05.
Table 2 Number of animals (n), total number of alleles (TNA), mean number of alleles (MNA), effective number of alleles (NE), observed heterozygosity (HO), expected heterozygosity (HE), and inbreeding coefficient within the population (FIS) in 24 Pelibuey sheep subpopulations, based on the analysis with nine microsatellite markers
| Population | State | n | TNA | MNA | NE | HO | HE | FIS |
|---|---|---|---|---|---|---|---|---|
| IN-MOC | Yucatan | 5 | 28 | 3.11 | 2.46 | 0.666 | 0.627 | -0.071 |
| IN-MAR | Puebla | 5 | 30 | 3.33 | 2.73 | 0.733 | 0.664 | -0.118* |
| CEIEGT | Veracruz | 5 | 30 | 3.33 | 2.62 | 0.689 | 0.651 | -0.064 |
| CEPIPSA | Mexico City | 5 | 30 | 3.33 | 2.73 | 0.779 | 0.677 | -0.171* |
| ITC | Yucatan | 5 | 36 | 4.11 | 3.0 | 0.778 | 0.721 | -0.089* |
| UNPA | Oaxaca | 5 | 49 | 5.44 | 4.20 | 0.778 | 0.840 | 0.081 |
| COL-CORD | Veracruz | 5 | 37 | 4.11 | 3.72 | 0.756 | 0.782 | 0.038 |
| UV | Veracruz | 5 | 37 | 4.11 | 3.28 | 0.711 | 0.674 | -0.062 |
| BUAP | Puebla | 5 | 37 | 4.11 | 3.32 | 0.711 | 0.738 | 0.041 |
| COL-TEX | Mexico State | 5 | 43 | 4.78 | 4.10 | 0.800 | 0.803 | 0.003 |
| UCOL | Colima | 5 | 36 | 4.0 | 3.10 | 0.733 | 0.709 | -0.039 |
| Rancho San Alberto | Yucatan | 5 | 38 | 4.22 | 3.47 | 0.711 | 0.733 | 0.033 |
| Rancho Garrido | Yucatan | 5 | 38 | 4.22 | 3.20 | 0.689 | 0.751 | 0.091* |
| Rancho Belbesah | Yucatan | 5 | 39 | 4.33 | 3.58 | 0.733 | 0.758 | 0.036 |
| Rancho Libertad | Yucatan | 5 | 43 | 4.89 | 3.89 | 0.711 | 0.812 | 0.138* |
| Rancho Jalapa | Tabasco | 4 | 32 | 3.56 | 2.92 | 0.694 | 0.706 | 0.019 |
| Rancho El Porvenir | Tabasco | 5 | 37 | 4.11 | 3.32 | 0.733 | 0.733 | 0.000 |
| Rancho El Paraíso | Puebla | 5 | 34 | 3.78 | 2.77 | 0.733 | 0.686 | -0.077 |
| Rancho Santa Anita | SLP | 5 | 31 | 3.44 | 2.82 | 0.689 | 0.699 | 0.015 |
| Posta El Cuatro | Jalisco | 6 | 44 | 4.89 | 3.45 | 0.685 | 0.735 | 0.075 |
| Finca El Cielo | Sinaloa | 5 | 38 | 4.22 | 3.40 | 0.711 | 0.746 | 0.051 |
| Rancho La Fama | Sinaloa | 5 | 39 | 4.33 | 3.60 | 0.733 | 0.787 | 0.076 |
| Rancho El Carrizal | BCS | 4 | 36 | 4.0 | 3.26 | 0.694 | 0.778 | 0.122* |
| Cuba | La Habana | 5 | 37 | 4.11 | 3.27 | 0.779 | 0.738 | -0.060 |
| Total/Average | 119 | 36.6 | 4.08 | 3.25 | 0.726 | 0.731 | 0.0072 |
INIFAP: Instituto Nacional de Investigaciones Forestales, Agrícolas y Pecuarias; CEIEGT: Centro de Enseñanza, Investigación y Extensión en Ganadería Tropical; CEPIPSA: Centro de Enseñanza, Investigación y Extensión en Producción y Salud Animal; COLPOS: Colegio de Postgraduados; BUAP: Benemérita Universidad Autónoma de Puebla.
*Indicates FIS different from zero (P˂0.05).
Following FAO recommendations, the analysis included five individuals from each flock10. We only included four samples of the Rancho Jalapa and Rancho El Carrizal flocks because of the DNA degradation of some samples.
Blood samples (6 ml) were obtained by jugular venipuncture and collected in Vacutainer® tubes with EDTA as an anticoagulant; samples were labeled at the time of sampling. Samples were stored at -80 °C until further processing and analysis.
DNA extraction and polymerase chain reaction (PCR)
DNA isolation was carried out based on a simple and inexpensive protocol for extracting DNA from poultry blood samples11. This protocol was subsequently adapted for sheep blood12.
The yield and purity of the extracted DNA were determined by spectrophotometry (NanoDrop Thermo Scientific, Wilmington, DE). These results were corroborated by a 0.8% agarose gel electrophoresis using 10 µL of the extracted DNA. The extracted DNA was stored at -80 °C until further used.
Nine microsatellite markers were amplified through PCR following the International Society for Animal Genetics (ISAG) and the FAO10,13 recommendations. The PCR reactions were carried out in a final volume of 25 µL and consisted of 100 ng of genomic DNA (2 µL), 0.2 µM of each primer (Forward and Reverse; 0.5 µL), 200 µM of each dNTP (2.5 µL), 2.5 mM of MgCl2+ (0.5 µL), 1.25 U of DNA Taq polymerase (0.25 µL), 10 X PCR buffer (2.5 µL), and 16.25 µL of sterile water.
PCR reactions were carried out in a thermocycler (Axygen Scientific Inc.). The PCR protocol was the following: an initial denaturation step at 95 °C for 5 min; followed by 35 cycles of denaturation at 94 °C for 45 s, annealing for 1 min at variable temperature, and extension at 72 °C for 1 min; with a final extension at 72 °C for 10 min. Amplifications were stored at 4 °C until further analysis.
Electrophoresis
Amplifications were subjected to a non-denaturing polyacrylamide (12 %) gel electrophoresis. Electrophoresis was carried out with 0.5% TBE as a running buffer. The size of the DNA fragments was determined using a 25 bp molecular weight ladder (Invitrogen Life Technologies, Carlsbad, USA). Gels were stained with 0.5 µg/ml of ethidium bromide and visualized under ultraviolet light (Kodak Gel Logic 2200 Imaging System). The gel images were processed using the MyImageAnalysisSystemTM (Fisher) software.
Statistical analysis
The number of alleles (NA), effective number of alleles (NE), mean number of alleles (MNA), Shannon index (I), observed heterozygosity (HO), and expected heterozygosity (HE) for each marker were estimated using the POPGENE v.1.3114 and FSTAT15 software. The polymorphic information content (PIC) was calculated with the CERVUS v 3.0.716 software. For each marker, exact tests were carried out to determine deviations from Hardy-Weinberg equilibrium (HWE) through the Markov chain Monte Carlo simulation method using the GENEPOP v 4.7.017,18 software.
F statistics measured genetic structure. The inbreeding index within a population (FIS), fixation index of the total population (FIT), and the genetic differentiation index between populations (FST) were calculated with the GENEPOP v 4.7.0 software, carrying out 1,000 permutations17,18. Private alleles were analyzed using the GENALEX v 6.5 software19,20. Shared alleles between subpopulations were analyzed by creating a binary matrix that recorded the presence (1) or absence (0) of each of the alleles in the subpopulations. Subsequently, the proportions of the subpopulations with the most and least common shared alleles were calculated.
The genetic flow between the subpopulations was measured through the number of migrants per generation (Nm) and calculated from the FST between pairs of subpopulations using the GENETIX v. 4.05 software21.
Isolation by distance between subpopulations was analyzed using a Mantel test22, which consisted of correlating the genetic distances (measured through Nei's unbiased minimum distances23) and the geographic distances between the subpopulation pairs using the XLSTAT software. This test used a significance of 0.05 and 10,000 permutations.
The spatial relationships between the subpopulations were analyzed using a principal component analysis (PCA) implemented in the PCAGEN software24. The population structure and degree of mixture were estimated using a Bayesian clustering model implemented in the STRUCTURE v 2.325 software. This analysis involved a mixture model with correlated allele frequencies. To choose the correct number of inferred clusters (K) needed to model the data, 2-24 clusters were inferred with 20 independent runs in each cluster. All runs used 100,000 interactions (burn-in), followed by 1,000,000 interactions (MCMC). The most probable number of K was calculated with the ΔK algorithm using the online software STRUCTURE HARVESTER26. Finally, results were processed using the online software CLUMPAK27 to interpret the obtained inferences.
Results
Genetic diversity of the entire population
Table 1 shows the global statistics obtained with the nine microsatellites. For the entire Pelibuey population, 99 alleles were detected in 119 animals genotyped with nine microsatellite primers. All loci were polymorphic in the analyzed subpopulations. The number of alleles per locus fluctuated from 9 (OarCP34, OarFCB304, and ILSTS5) to 14 (OarJMP58). The observed average number of alleles per locus was 11. The NE ranged from 5.31 (OarCP34) to 8.68 (OarJMP58).
The HO values ranged from 0.657 (SRCRSP9) to 0.812 (OarFCB304). The average HO for the entire population was 0.726. Moreover, HE fluctuated from 0.664 (ILSTS5) to 0.807 (OarJMP29), with an average of 0.732. The PIC for each marker ranged from 0.79 (OarCP34) to 0.87 (OarJMP58 and DYMS1), with a global average of 0.84. The I value was between 1.90 (OarCP34) and 2.35 (OarJMP58), with a global average of 2.1.
The microsatellite markers were tested for deviation from the HWE. Most loci were under HWE. However, OarFCB304, OarJMP29, and ILSTS5 showed a significant deviation from the HWE (P<0.05). The global values of FIS, FIT, and FST were 0.007, 0.158, and 0.151, respectively, with no significant differences (P>0.05). The highest FIS value (0.136) was observed in the OarJMP29 marker; the lowest value (-0.176) was observed in the ILSTS5 marker. The highest FIT value (0.255) was observed in the SRCRSP9 locus, the lowest (0.075) in the OarFCB304 locus. Furthermore, the highest FST value (0.228) was observed in the ILSTS5 locus, the lowest (0.056) in the OarJMP29 locus. The differences between subpopulations, evaluated by the multilocus values of FST, revealed that, for the most part, genetic variation corresponds to differences between individuals within the subpopulations (84.9 %); 15.1 % results from differences between subpopulations.
Genetic diversity between subpopulations
Table 2 shows the genetic diversity measures for each subpopulation. The subpopulation with the higher genetic diversity was UNPA (49 alleles); the subpopulation with the lowest genetic diversity was IN-MOC (28 alleles), with a global average of 36.6 alleles per subpopulation. The average MNA and NE were 4.08 and 3.25, respectively. The highest values were observed in the UNPA subpopulation (5.44 and 4.20, respectively); the IN-MOC subpopulation had the lowest values (3.11 and 2.46, respectively).
The average HO was 0.726. The lowest value was observed in the IN-MOC subpopulation (0.666), the highest in COL-TEX (0.800). The average HE was 0.731. The lowest value was observed in the IN-MOC subpopulation (0.627), the highest in UNPA (0.840).
The average FIS for each subpopulation, considering all loci, fluctuated from -0.171 (CEPIPSA) to 0.138 (Rancho Libertad). Nine of the 24 analyzed subpopulations (IN-MOC, ITC, UV, CEIEGT, IN-MAR, Rancho El Paraíso, CEPIPSA, UCOL, and Cuba) showed negative FIS values; the remaining 15 had positive values. Six subpopulations showed (Table 2) FIS values different from zero (P<0.05), with positive (Rancho Garrido, Rancho Libertad, and Rancho El Carrizal) and negative values (ITC, IN-MAR, and CEPIPSA).
The allele analysis (Table 3; end of manuscript) demonstrated the presence of nine private alleles (9.09% of the 99 alleles) distributed in seven subpopulations (29.1% of the 24 flocks). The Posta El Cuatro subpopulation had three private alleles; CEIEGT, COLPOS-CORD, Rancho San Alberto, Rancho Belbesah, Rancho Libertad, and Rancho Jalapa had one private allele. The loci that contributed to private alleles were OarFCB304 (2), OarJMP29 (2), SRCRSP5 (2), MAF33 (2), and SRCRSP9 (1). The frequencies of private alleles ranged from 0.083 in Posta El Cuatro (markers OarFCB304 and OarJMP29) to 0.400 in CEIEGT (marker SRCRSP9). The Cuban Pelibuey flock had no private alleles.
Table 3 Private and shared alleles in 24 Pelibuey sheep subpopulations genetically characterized with nine microsatellite markers
| OarCP34 | OarFCB304 | OarJMP29 | OarJMP58 | DYMS1 | ILSTS5 | SRCRSP5 | SRCRSP9 | MAF33 | |
|---|---|---|---|---|---|---|---|---|---|
| Private alleles | |||||||||
| Number of PA (SP %) |
0 (0) | 2 (4.33) | 2 (8.33) | 0 (0) | 0 (0) | 0 (0) | 2 (8.33) | 1 (4.17) | 2 (8.33) |
| SP with PA Alleles (frequency) |
― | Posta El Cuatro 140 (0.083) 210 (0.083) |
Rancho Libertad 170 (0.100) Posta El Cuatro 180 (0.083) |
― | ― | ― | COLPOS- CORD 172 (0.100) Rancho Jalapa 200 (0.125) |
CEIEGT 95 (0.400) |
San Alberto 170 (0.100) Rancho Belbesah 160 (0.100) |
| Shared alleles | |||||||||
| Most shared allele Number of SP (%) |
110 23 (95.83) |
164 15 (62.5) |
150 23 (95.83) |
135 16 (67.5) |
175/200 16/16 (66.7/66.7) |
225 19 (79.17) |
152 17 (70.83) |
125 14 (58.3) |
120 18 (75) |
| Least shared allele Number of SP (%) |
100 2 (8.33) |
150 7 (29.17) |
110/140 3/3 (12.5/12.5) |
177/185 2/2 (8.33/8.33) |
225 (4) 16.67 |
180 3 (12.5) |
154 2 (8.33) |
135 5 (20.8) |
155 5 (20.83) |
| SP mean
with SA (%) |
11
(45.8) |
10.3
(42.8) |
9
(37.5) |
7.36
(30.7) |
10.91
(45.45) |
9.89
(44.79) |
7.42
(33.3) |
9.2
(38.3) |
8.18
(34.1) |
PA= private alleles; SP= subpopulation; SA= shared alleles.
Although not all subpopulations shared alleles, it was identified two alleles ("110" and "150" of the OarCP34 and OarJMP29 loci, respectively) that were shared by 23 subpopulations (95.83 %). Table 4 (end of the manuscript) shows the analysis of the genetic flow (measured by Nm). The highest value of Nm was observed between the CEIEGT and CEPIPSA subpopulations. Of the 276 possible subpopulation comparisons, 222 (80.43 %) had a Nm higher than 1; 14 (5.07 %) had a Nm higher than 4.
Table 4 Gene flow measured through the number of migrants (Nm) between pairs of Pelibuey sheep subpopulations in Mexico.
| 1 | 2 | 3 | 4 | 5 | 6 | 7 | 8 | 9 | 10 | 11 | 12 | 13 | 14 | 15 | 16 | 17 | 18 | 19 | 20 | 21 | 22 | 23 | |
|---|---|---|---|---|---|---|---|---|---|---|---|---|---|---|---|---|---|---|---|---|---|---|---|
| 1 | ― | ||||||||||||||||||||||
| 2 | 3.13 | ― | |||||||||||||||||||||
| 3 | 2.56 | 1.73 | ― | ||||||||||||||||||||
| 4 | 2.62 | 1.83 | 16.39 | ― | |||||||||||||||||||
| 5 | 1.66 | 2.34 | 1.29 | 2.25 | ― | ||||||||||||||||||
| 6 | 2.15 | 1.42 | 1.48 | 1.62 | 2.10 | ― | |||||||||||||||||
| 7 | 0.94 | 1.05 | 0.87 | 0.92 | 1.74 | 5.40 | ― | ||||||||||||||||
| 8 | 0.81 | 0.77 | 0.82 | 1.21 | 1.49 | 1.40 | 1.41 | ― | |||||||||||||||
| 9 | 0.79 | 0.80 | 0.96 | 1.13 | 1.04 | 2.23 | 1.90 | 1.35 | ― | ||||||||||||||
| 10 | 1.12 | 1.07 | 1.18 | 1.22 | 1.21 | 4.17 | 2.08 | 1.07 | 2.20 | ― | |||||||||||||
| 11 | 0.65 | 0.93 | 0.71 | 0.78 | 1.39 | 2.56 | 2.41 | 0.80 | 1.26 | 1.55 | ― | ||||||||||||
| 12 | 1.17 | 1.09 | 1.29 | 2.13 | 1.11 | 2.39 | 1.16 | 0.81 | 1.17 | 1.91 | 1.00 | ― | |||||||||||
| 13 | 1.06 | 0.92 | 1.04 | 1.19 | 1.05 | 2.19 | 1.36 | 0.90 | 1.37 | 2.64 | 1.45 | 1.92 | ― | ||||||||||
| 14 | 1.16 | 1.13 | 1.32 | 1.36 | 1.26 | 3.05 | 1.68 | 1.04 | 1.31 | 2.14 | 1.45 | 1.91 | 3.40 | ― | |||||||||
| 15 | 1.18 | 1.36 | 1.56 | 1.93 | 1.40 | 2.40 | 2.24 | 1.31 | 2.20 | 6.43 | 1.37 | 4.34 | 3.91 | 5.53 | ― | ||||||||
| 16 | 1.04 | 1.09 | 1.98 | 1.79 | 1.07 | 1.73 | 1.17 | 0.82 | 1.08 | 1.49 | 0.84 | 1.87 | 1.90 | 1.92 | 5.41 | ― | |||||||
| 17 | 0.82 | 0.73 | 0.93 | 1.05 | 0.94 | 8.18 | 1.87 | 0.84 | 1.99 | 2.41 | 3.81 | 1.52 | 5.12 | 3.14 | 1.81 | 1.18 | ― | ||||||
| 18 | 0.59 | 0.98 | 0.73 | 0.80 | 1.37 | 1.25 | 1.53 | 0.73 | 0.98 | 1.30 | 1.28 | 0.86 | 1.29 | 1.16 | 1.34 | 0.81 | 1.12 | ― | |||||
| 19 | 0.90 | 0.91 | 1.16 | 1.29 | 0.85 | 1.54 | 0.93 | 0.70 | 1.31 | 1.53 | 0.93 | 2.53 | 2.08 | 1.80 | 2.50 | 2.38 | 1.13 | 0.75 | ― | ||||
| 20 | 0.91 | 0.95 | 1.18 | 1.14 | 1.18 | 1.78 | 1.31 | 1.07 | 2.38 | 1.49 | 1.07 | 1.47 | 2.25 | 1.81 | 2.21 | 1.78 | 1.71 | 0.86 | 2.12 | ― | |||
| 21 | 1.54 | 1.19 | 1.43 | 1.99 | 1.55 | 7.73 | 1.77 | 1.08 | 1.28 | 1.73 | 0.97 | 2.25 | 1.69 | 3.15 | 2.89 | 2.47 | 1.41 | 0.96 | 1.78 | 1.65 | ― | ||
| 22 | 1.13 | 1.06 | 1.28 | 1.66 | 1.53 | 2.59 | 1.48 | 1.87 | 1.77 | 3.37 | 1.34 | 1.53 | 7.85 | 3.07 | 9.46 | 2.05 | 2.14 | 1.05 | 1.42 | 2.73 | 2.52 | ― | |
| 23 | 0.80 | 0.87 | 0.86 | 0.87 | 0.97 | 2.81 | 2.01 | 0.99 | 2.68 | 3.79 | 1.32 | 1.62 | 4.54 | 2.36 | 5.72 | 1.93 | 1.93 | 0.99 | 2.30 | 1.77 | 1.44 | 2.41 | ― |
| 24 | 1.33 | 1.12 | 1.06 | 1.29 | 1.17 | 2.35 | 1.14 | 0.89 | 1.25 | 2.55 | 0.90 | 1.56 | 2.51 | 1.86 | 2.75 | 1.62 | 1.26 | 0.96 | 1.75 | 1.37 | 2.18 | 1.94 | 1.55 |
* The numbering of the subpopulations follows the same order as Table 2.
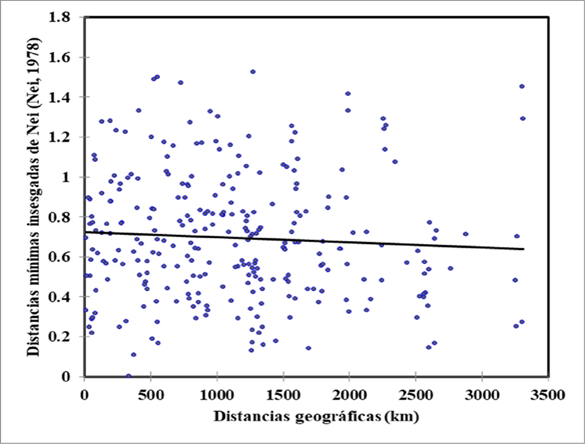
The isolation by distance in the subpopulations was corroborated using Mantel's test (Figure 2). This analysis showed that the genetic differentiation between the Pelibuey sheep subpopulations (measured through Nei's unbiased minimum distances) is not related to their geographic distances (r= -0.062; P>0.05).
Genetic relationships between subpopulations and population structure analysis
A PCA was carried out using the frequencies of the 99 alleles observed in the population. Figure 3 shows the global PCA. The first two principal components explained 30.21 % of the total variation. The first axis contributed 17.04 % of the variance and separated the flocks into two clusters. Subpopulations IN-MOC, IN-MAR, CEIEGT, CEPIPSA, and ITC comprise the first cluster. The second axis contributed 13.17% of the variance and separated the UCOL, COLPOS-CORD, Rancho el Paraíso, Universidad Veracruzana, ITC, and IN-MAR subpopulations.
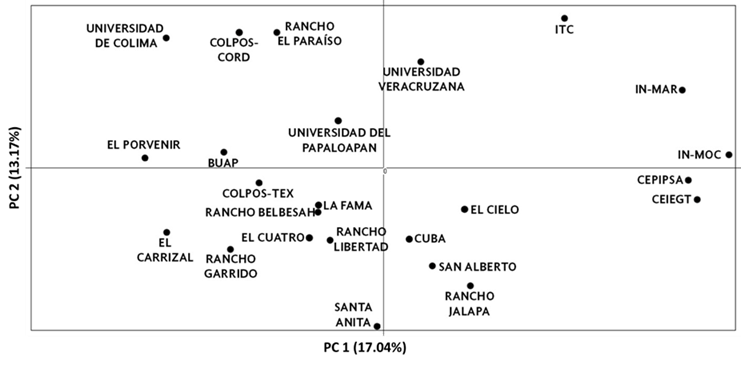
Figure 3 Principal component analysis between Pelibuey sheep subpopulations in Mexico. The first two components were included
The analysis with the STRUCTURE software demonstrated the presence of two ancestral populations (K), similar to the PCA. The first group included the IN-MOC, IN-MAR, CEIEGT, CEPIPSA, and ITC subpopulations (Figure 4). Hypothetically, if K=3 or K=4, it would be possible to observe the formation of new clusters; however, the subpopulations of the first group remain constant.
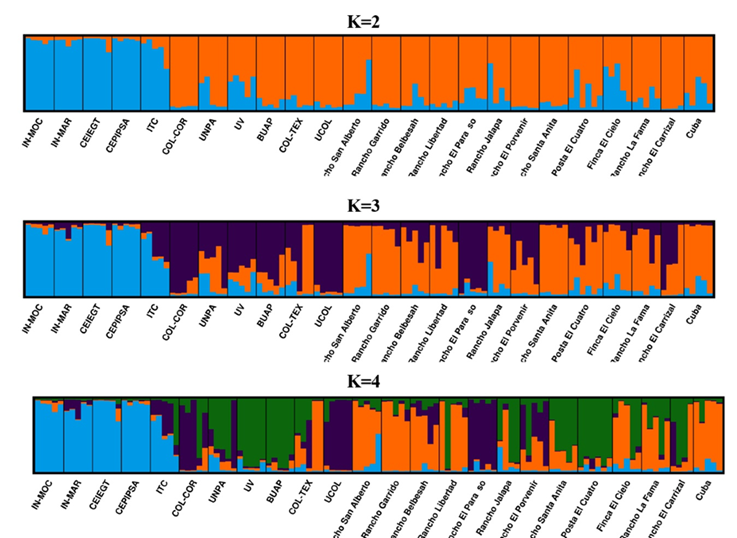
Each individual is represented by a vertical bar, which is typically segmented into various colors. The colors represent the proportions of the ancestral populations (K=2, K=3, K=4) that make up the individual genome. Black lines separate subpopulations.
Figure 4: Clustering of the different Pelibuey sheep subpopulations in Mexico using the STRUCTURE software
Discussion
Genetic diversity of the entire population
This study is the first genetic characterization of Pelibuey sheep using microsatellites. The average NA was 11, which is lower than the 14.27 value reported in a previous study carried out in 13 Colombian sheep breeds using 11 microsatellite markers28; however, it is very similar to the 10.96 value reported in nine Spanish, Cuban, Mexican, and African breeds using 26 microsatellite markers29. The average NE was 3.25, which is lower than the 3.73 observed in five Chinese sheep breeds30 and the 4.68 value reported in Colombian sheep breeds28. When contemplating all loci, the NA was higher than the NE, which indicates that alleles are irregularly distributed in each of the loci; this could be because of the geographic isolation or the selection or flow of genetic material between subpopulations31.
Heterozygosity is a parameter that reflects the genetic diversity in the population. The average values of HO and HE (0.726 and 0.732, respectively) were very similar in all loci. Values are similar to those observed in several Spanish, Cuban, Mexican, and African sheep breeds, in which an average HE value of 0.731 was reported29. A different study reported HO and HE values of 0.744 and 0.755, respectively, in several Hungarian sheep breeds32. In four of the nine analyzed markers (OarFCB304, ILSTS5, SRCRSP5, and MAF33), the HO was higher than the HE, suggesting an excess of heterozygotes in the analyzed subpopulations.
The PIC values in this study were greater than 0.7; this indicates that the markers used in this study correctly measure genetic diversity. The average value of the Shannon Index (2.1) was similar to the 2.2 value obtained in 14 types of Iranian sheep33 and the 2.38 value reported in four Nigerian sheep breeds34. This result reflects the high genetic variability of the analyzed subpopulations.
Three of the nine markers showed a deviation from the HWE due to either high (OarFCB304 and ILSTS5) or low heterozygosity (OarJMP29). Although the deviation from the HWE can have biological implications, such as intensive selection, inbreeding, migration, mutation, or an insufficient number of samples35, it is also possible that this deviation results from errors during genotyping36. In this study, it was only observed deviation from the HWE in 20 of the 216 Fisher's exact tests; therefore, it was decided to keep all markers in subsequent analyses.
The observed FIT value (0.158) indicates a global deficiency of 15.8 % of heterozygotes in the population. Furthermore, the FST value (0.151) indicates that 15.1 % of the genetic variation corresponds to differences between subpopulations. Similar values in both indexes were found in several sheep breeds, where FIT and FST values of 14.2 and 13.4 %, respectively, were observed29. Thus, both values indicate that there is moderate genetic differentiation between the studied flocks.
Genetic diversity between subpopulations
The highest NA, MNA, and NE values corresponded to the UNPA, COL-TEX, Rancho Libertad, and Posta El Cuatro subpopulations. The genetic diversity in these subpopulations can be attributed to the introduction of new individuals, which was corroborated with the flocks' record books. Furthermore, Posta El Cuatro corresponds to a unit intended for the production of record Pelibuey specimens. In recent years, pure Pelibuey breeders have substantially improved the productive yield of this breed by resorting to the crosses between different Pelibuey lines. In Rancho Libertad, the high values of FIS (0.138) do not support the latter. However, this result could be attributed to the reduced sample size of the subpopulation. The lowest NA, MNA, and NE were observed in the IN-MOC, IN-MAR, CEIEGT, and CEPIPSA subpopulations; this is probably because these subpopulations belong to universities and research institutes, which have remained as closed centers and have not allowed the introduction of new animals. Thus, the breed's original genetic material is expected to be more conserved in these subpopulations. The negative FIS values confirm that these flocks follow a minimum inbreeding policy.
The HO (0.726) and HE (0.731) values obtained in this study were higher than those observed in a Pelibuey flock in Queretaro, Mexico (HO= 0.652 and HE= 0.659)29. Furthermore, an HO of 0.72 and an HE of 0.71 was observed in a Colombian Pelibuey flock28. The high global values of HO and HE could be attributed to the analysis of several subpopulations since the other studies only evaluated one flock.
The total value of FIS was 0.0072. However, in nine subpopulations (IN-MOC, UV, Rancho El Paraíso, IN-MAR, ITC, UCOL, CEIEGT, CEPIPSA, and Cuba), FIS was negative, suggesting an excess of heterozygotes. In the remaining subpopulations, FIS was positive, indicating a deficiency of heterozygotes; this coincides with the heterozygosity values since, in the same subpopulations, the HO was higher than the HE. Previous studies in Pelibuey sheep have reported FIS values of 0.02329 and 0.0228, indicating a slight deficiency of heterozygotes. The negative FIS values could be explained by the absence of inbreeding, high heterozygosity values, and low selection pressure, similar to what has been observed in other studies33. High FIS values (Rancho Garrido, Rancho Libertad, and Rancho El Carrizal) indicate a deficiency of heterozygotes commonly associated with selection and inbreeding37. In farm animal populations, inbreeding is a common finding due to flaws in reproductive programs and the fact that they are relatively small populations. Furthermore, the small number of sampled individuals per subpopulation could also contribute to the estimations obtained in these subpopulations.
Private alleles are defined as those that occur in a single population or subpopulation. Nine private alleles were detected in six of the evaluated subpopulations. The subpopulation with the highest number of private alleles (3) was Posta El Cuatro. The CEIEGT, COLPOS-CORD, Rancho San Alberto, Rancho Belbesah, Rancho Libertad, and Rancho Jalapa had one private allele. Except for allele "95" (CEIEGT subpopulation, locus SRCRSP9), which had a 0.400 frequency, private alleles showed relatively low frequencies (0.083-0.125). Thus, these private alleles are more at risk of disappearing if not considered in breeding programs. Private alleles with higher frequencies indicate that a population is unique and has a certain degree of isolation38, which is compatible with the recent history of the CEIEGT flock; this flock has behaved as a closed core, avoiding the introduction of new genetic material. Additionally, the negative FIS (-0.064) rules out the possibility that the high frequency of the allele mentioned above is due to an inbreeding process.
The private alleles observed with low frequencies in the analyzed subpopulations could be due to relatively recent mutation events39. Microsatellites have high mutation rates that range from 10-6 to 1x10⁻²(40; this allows the appearance of a mutation in 1/1,000,000-1/100 individuals per generation. Additionally, private alleles could also be due to the high gene flow between subpopulations41; this is corroborated by the global FST (0.151) observed in this study, which indicates a moderate gene flow between subpopulations.
The private allele analysis could not differentiate the Cuban subpopulation from the Mexican flocks. It is important to consider the founder effect that resulted from the introduction of the Pelibuey breed into Mexico, in which only a few specimens of the total Cuban population were selected. The genetic drift of the Pelibuey specimens introduced into Mexico played an important role in the extinction or fixation of available alleles. Furthermore, mutations could significantly contribute to the emergence of new alleles within the newly formed flock. Therefore, a substantial difference between the genetic diversity of the Mexican and Cuban flocks would be expected. However, in this study, it was observed that the Cuban flock shares alleles with the Mexican flock; this could be because the Cuban subpopulation consisted of only five individuals, representing a minimum sample of the actual genetic diversity. Therefore, it is impossible to carry out an objective comparison of both subpopulations; results should only be considered indicative.
The analysis of shared alleles did not identify alleles shared between all subpopulations. However, alleles "110" and "150", corresponding to the OarCP34 and OarJMP29 loci, were found in 23 of the 24 analyzed subpopulations; only UV and Rancho Belbesah were missing these alleles. Future research should determine if these alleles could be used as markers of the Pelibuey breed.
The gene flow analysis, measured by the Nm, showed that CEIEGT and CEPIPSA (Nm= 16.39) had the highest gene flow, which corresponds with their record books. These flocks belong to the Universidad Nacional Autónoma de México (UNAM), where rams from CEIEGT have been regularly introduced to CEPIPSA for some years. Furthermore, the Nm analysis confirmed that the value was greater than one in 80.43 % of the subpopulation pairs. Meanwhile, 5.07 % of the subpopulation pairs reached values higher than four. Nm values lower than one indicate that the gene flow is not enough to counteract the differentiation caused by the genetic drift between subpopulations; therefore, subpopulations tend to differentiate. Values greater than one prevent differentiation. Moreover, if the Nm is higher than four, subpopulations behave as a panmictic population42; this is corroborated by the global FST (0.151), which indicates a moderate gene flow between subpopulations.
The correlation between the genetic and geographic distances was nonsignificant; this means that the genetic structure of the Pelibuey flocks does not correspond to isolation by distance model between subpopulations. This could be attributed to the flow of Pelibuey specimens across the country.
Genetic relationships between subpopulations and population structure analysis
The PCA showed that the first component separated the IN-MOC, IN-MAR, CEIEGT, CEPIPSA, and ITC subpopulations from the rest. This result was expected since these populations belong to research institutes and universities, where the main focus is research and breed conservation. The latter was previously corroborated by the negative FIS values that indicate high heterozygosity. The second group was conformed of flocks from other universities and research institutes (BUAP, COL-TEX, COL-COR, UCOL, and UNPA), all the private producers, and the Cuban flock. The divergence of the second group is probably due to the current flow of specimens between Pelibuey subpopulations in Mexico; this is supported by the moderate FST value of 0.151 and the significant proportion of subpopulation pairs with an Nm greater than one. Recently, reproductive technologies, such as embryo transfer and artificial insemination, have enabled faster genetic improvement8. Such technologies and the specimen flow (especially rams) between production units have substantially modified the original Pelibuey sheep genetic diversity. Additionally, the crossings with other breeds have significantly increased, resulting in greater divergence. Exhaustive studies should verify the breed's genetic erosion.
The second component of the PCA separated the UCOL, COLPOS-CORD, Rancho el Paraíso, Universidad Veracruzana, ITC, and IN-MAR subpopulations. These subpopulations belong to research institutes, universities, and private producers. Although it is difficult to explain, this clustering could be due to the practices to which the flocks have been subjected in recent years. For example, the UCOL and IN-MAR populations have drastically decreased; furthermore, Rancho El Paraíso has started introducing new genetic material.
The analysis with the STRUCTURE software suggests that all the Pelibuey subpopulations in Mexico originated from two ancestral populations that have diverged after several years of adaptation to different environments and practices. Furthermore, each of the subpopulations has a mixture of both clusters to a greater or lesser degree. The IN-MOC, IN-MAR, CEIEGT, CEPIPSA, and ITC subpopulations were grouped into one cluster, as observed in the PCA (first component). The relationship between the Mexican reference subpopulations and the other flocks was confirmed with the shared allele analysis previously mentioned. Furthermore, the analysis with STRUCTURE shows low mixture levels between the subpopulations in this cluster and the second one.
Additionally, it has been confirmed that the main objective of those populations is research and breed conservation. If hypothetically is considered a K= 3 or K= 4, it would be possible to observe that the IN-MOC, IN-MAR, CEIEGT, CEPIPSA, and ITC subpopulations continue clustering together; this allows to conclude that these subpopulations have the most preserved genetic material.
Conclusions and implications
The Pelibuey sheep subpopulations in this study showed high genetic diversity and were genetically different from each other. The principal component analysis and the population structure study conclude that the IN-MOC, IN-MAR, CEIEGT, CEPIPSA, and ITC subpopulations have the most preserved genetic material. These results suggest that animals from these subpopulations could be used to implement national conservation programs for the Pelibuey breed. During this study, was observed that despite the significant importance of the Pelibuey breed in sheep farming and research, there are flocks, such as IN-MAR and UCOL, in which the number of individuals has decreased and could potentially disappear. Currently, there are research groups and organizations in Mexico, such as the Unidad Nacional de Ovinocultores [National Unit of Sheep Farmers], that have recognized the importance of the Pelibuey breed in Mexican sheep farming. Through individual efforts, they have tried to contribute to its conservation. A comprehensive plan is required for the conservation of this breed and the preservation of their genetic material. Further studies are essential to determine if there is genetic erosion of the Pelibuey sheep in Mexico.
Acknowledgments
The PAPIIT project 28RN-219115 financed this research. The authors thank all the owners and people in charge of the flocks included in this study, especially the M.S. Octavio Rojas from INIFAP Mocochá.
REFERENCES
1. Berruecos VJM, Valencia ZM, Castillo RH. Genética del borrego Tabasco o Peligüey. Téc Pecu 1975;29:59-65. [ Links ]
2. Montalvo MP, Romualdo MJG, Sierra VA, Ortiz OJ, Hernández ZJ, Medrano HA. El ovino Pelibuey en el trópico mexicano. En: Delgado BJV, Nogales BS editores. Biodiversidad ovina iberoamericana. Caracterización y uso sustentable. España, Universidad de Córdoba. Servicio de Publicaciones 2009:363-375. [ Links ]
3. Aguilar-Martínez CU, Berruecos-Villalobos JM, Espinoza-Gutiérrez B, Segura-Correa JC, Valencia-Méndez J, Roldán-Roldán A. Origen, historia y situación actual de la oveja Pelibuey en México. Trop Subtrop Agroecosys 2017;20(3):429-439. [ Links ]
4. Arteaga CJD. Diagnóstico actual de los ovinos en México. En: Memorias del 8 Congreso Mundial de la Lana y el Cordero. Asociación Mexicana de Criadores de Ovinos. Querétaro, Qro.2007:9-12. [ Links ]
5. Magaña-Monforte JG, Huchin-Cab M, Ake-López RJ, Segura-Correa JC. A field study of reproductive performance and productivity of Pelibuey ewes in southeaster Mexico. Trop Anim Health Prod 2013;45(8):1771-1776. [ Links ]
6. Valencia J, Porras A, Mejía O, Berruecos JM, Trujillo J, Zarco L. Actividad reproductiva de la oveja Pelibuey durante la época de anestro: influencia de la presencia del macho. Rev Científica FCV-LUZ 2006;16(2):136-141. [ Links ]
7. Arredondo-Ruiz V, Macedo-Barragán R, Molina-Cárdenas J, Magaña-Álvarez AJ, Prado-Rebolledo O, García-Márquez LJ, Herrera-Corredor A, Lee-Rangel H. Morphological characterization of Pelibuey sheep in Colima, México. Trop Anim Health Prod 2013;45(4):895-900. [ Links ]
8. Taberlet P, Valentini A, Rezaei HR, Naderi S, Pompanon F, Negrini R, Ajmone-Marsan P. Are cattle, sheep and goats endangered species? Mol Ecol 2008;17(1):275-284. [ Links ]
9. Organización de las Naciones Unidas para la Alimentación y la Agricultura (FAO). The second Report on the State of the World’s Animal Genetic Resources for Food and Agriculture. Scherf BD, Pilling D (eds). FAO Commission on Genetic Resources for Food and Agriculture Assessments. Rome 2015. [ Links ]
10. Organización de las Naciones Unidas para la Alimentación y la Agricultura (FAO). Molecular genetic characterization of animal genetic resources. FAO Animal Production and Health Guidelines. No. 9. Roma 2011. [ Links ]
11. Bailes SM, Devers JJ, Kirby JD, Rhoads DD. An inexpensive, simple protocol for DNA isolation from blood for high-throughput genotyping by polymerase chain reaction or restriction endonuclease digestion. Poult Sci 2007;86(1):102-106. [ Links ]
12. Roldán RA. Identificación de ovejas Pelibuey con actividad reproductiva continua mediante polimorfismos de ADN [tesis maestría]. México, D. F.: Universidad Nacional Autónoma de México; 2015. [ Links ]
13. International Society for Animal Genetics (ISAG). Panel of markers for parentage verification tested 2001/02 ISAG comparison test. 2002. [ Links ]
14. Yeh FC, Yang RC, Boyle T. POPGENE version 1.31. Microsoft Windows based freeware for population genetic analysis, University of Alberta and the Centre for International Forestry Research, Edmonton, 1999. [ Links ]
15. Goudet J. FSTAT, a program to estimate and test gene diversities and fixation indices F-statistics. Version 2.9.3. 2001. Disponible en: http://wwww.unil.ch/izea/softwares/fstat.html . [ Links ]
16. Kalinowsky ST, Taper ML, Marshall TC. Revising how the computer program CERVUS accommodates error increases success in paternity assignment. Mol Ecol 2007;16(5):1099-1106. [ Links ]
17. Raymond M, Rousset F. GENEPOP (version 1.2) population genetics software for exact test and ecumenicism. J Hered 1995;86(3):248-249. [ Links ]
18. Rousset F. Genepop’007: a complete reimplementation of the GENEPOP software for Windows and Linux. Mol Ecol Resour 2008;8(1):103-106. [ Links ]
19. Peakall R, Smouse PE. GENALEX 6: a genetic analysis in Excel. Population genetic software for teaching and research. Mol Ecol Notes 2006;6:288-295. [ Links ]
20. Peakall R, Smouse PE. GenAlEx 6.5: genetics analysis in Excel. Population software for teaching and research-an update. Bioinformatics 2012;28(19):2537-2539. [ Links ]
21. Belkhir K, Borsa P, Chikhi L, Raufaste N, Bonhomme F. GENETIX 4.05, logiciel sous WindowsTM pour la génetique des populations. Laboratoire Génome. Populations, Interactions, CNRS UMR 5000, Université de Montpellier II, Montpellier (France) 1996-2004. [ Links ]
22. Mantel N. The detection of disease clustering and a generalized regression approach. Cancer Res 1967;27(2):209-220. [ Links ]
23. Nei M. Estimation of average heterozygosity and genetic distance from a small number of individuals. Genetics 1978;89(3):583-590. [ Links ]
24. Goudet J. PCAGEN. Principal component analysis of gene frequency data (version 1.2). Lausanne, Switzerland: Population Genetics Laboratory, University of Lausanne. 1999. [ Links ]
25. Pritchard JK, Stephens M, Donnelly P. Inference of populations structure using multilocus genotype data. Genetics 2000;155(2):945-959. [ Links ]
26. Earl DA, VonHoldt BM. STRUCTURE HARVESTER: a website and program for visualizing STRUCTURE output and implementing the Evanno method. Conserv Genet Resour 2012;4(2):359-361. [ Links ]
27. Kopelman NM, Mayzel J, Jakobsson M, Rosenberg NA, Mayrose I. CLUMPAK: a program for identifying clustering modes and packaging populations structure inferences across K. Mol Ecol Resour 2015;15(5):1179-1191. [ Links ]
28. Ocampo R, Cardona H, Martínez R. Genetic diversity of Colombian sheep by microsatellite markers. Chil J Agric Res 2016;76(1):40-47. [ Links ]
29. Álvarez I, Capote J, Traouré A, Fonseca N, Pérez K, Cuervo M, Fernández I, Goyache F. Genetic relationships of the Cuban hair sheep inferred from microsatellite polymorphism. Small Ruminant Res 2012;104(1-3):89-93. [ Links ]
30. Sun W, Chang, H, Tsunoda K, Musa H, Ma Y, Guan W. Analysis of geographic and pairwise genetic distances among sheep populations. Biochem Genet 2010;48(5-6):376-384. [ Links ]
31. Qu D, Yang Z, Guo X, Mao Y, Sun W, Gen R et al. Study of polymorphisms of microsatellite DNA of six Chinese indigenous sheep and goat breeds. Front Agr China 2007;1(4):472-477. [ Links ]
32. Neubauer V, Volg C, Seregi J, Sáfar L, Brem G. Genetic diversity and population structure of Zackel sheep and other Hungarian sheep breeds. Arch Anim Breed 2015;58:343-350. [ Links ]
33. Taghi VEM, Mhammadabadi M, Esmailizadeth A. Using microsatellite markers to analyze genetic diversity in 14 sheep types in Iran. Arch Anim Breed 2017;60:183-189. [ Links ]
34. Agaviezor BO, Peters SO, Adefenwa MA, Yakubu A, Adebambo OA, Ozoje MO et al. Morphological and microsatellite DNA diversity of Nigerian indigenous sheep. J Anim Sci Biotechnol 2012;3(1):38. [ Links ]
35. Usha AP, Simpson SP, Williams JL. Probability of random sire exclusion using microsatellite markers for parentage verification. Anim Genetic 1995(26):155-161. [ Links ]
36. Morin PA, Leduc RG, Archer FI, Martien KK, Huebinger R, Bickham JW, Taylor BL. Significant deviations from Hardy-Weimberg equilibrium caused by low levels of microsatellite genotyping errors. Mol Ecol Res 2009;9(2):498-504. [ Links ]
37. Bhatia S, Arora R. Genetic diversity in Kheri-A pastarolist developed Indian sheep using microsatellite markers. Indian J Biotechnol 2008;7(1):108-112. [ Links ]
38. Dalvit C, De Marchi M, Zanetti E, Cassandro M. Genetic variation and population structure of Italian native sheep breeds undergoing in situ conservation. J Anim Sci 2009;87(12):3837-3844. [ Links ]
39. Konzen ER, Martins MP. Contrasting levels of genetic diversity among populations of the endangered tropical palm Euterpe edulis. CERNE 2017;23(1):31-42. [ Links ]
40. Schlötterer C. Evolutionary dinamics of microsatellite DNA. Chromosoma 2000;109(6):365-371. [ Links ]
41. Slatkin M. Gene flow in natural populations. Annu Rev Ecol Syst 1985;16(1):393-430. [ Links ]
42. Piñero D, Barahona A, Eguiarte L, Rocha OA, Salas LR. La variabilidad genética de las especies: aspectos conceptuales y sus aplicaciones y perspectivas en México. In: Sarukhán KJ et al. (editores). Capital natural de México, vol. I: Conocimiento actual de la biodiversidad. CONABIO, México, D. F. CONABIO 2009:603-649. [ Links ]
Received: October 10, 2018; Accepted: July 01, 2020
 Este es un artículo publicado en acceso abierto bajo una licencia
Creative Commons
Este es un artículo publicado en acceso abierto bajo una licencia
Creative Commons
