


Services on Demand
Journal
Article
 text in
  English (pdf)
 Article in xml format
 Article references
 Send this article by e-mail
Indicators
-
 Cited by SciELO
 -
 Access statistics
Related links
-
 Similars in
SciELO
Similars in
SciELO
Share

 Permalink
Revista mexicana de ciencias pecuarias
On-line version ISSN 2448-6698Print version ISSN 2007-1124
Rev. mex. de cienc. pecuarias vol.11 suppl.2 Mérida Mar. 2020 Epub June 30, 2020
https://doi.org/10.22319/rmcp.v11s2.4704
Articles
Estimation of the transport factor of the phosphorus index in climatology and climate change scenarios in Jalisco, Mexico
a Instituto Nacional de Investigaciones Forestales, Agrícolas y Pecuarias (INIFAP). Campo Experimental Centro-Altos de Jalisco. Tel: 01 800 0882222. AV. Biodiversidad 2470. 47600 Tepatitlán de Morelos. Jalisco, México.
b Universidad de Guadalajara. Centro Universitario de Ciencias Biológicas y Agropecuarias. Camino Ramón Padilla Sánchez No. 2100 Nextipac, 44600, Zapopan, Jalisco, México.
c INIFAP. Campo Experimental La Laguna. Coahuila. México.
d Universidad de Guadalajara. Centro Universitario de los Altos. México.
The phosphorus index (PI) is a planning tool for identifying agricultural or livestock fields with the potential to contribute phosphorus to water bodies and distinguish those nutrient management practices that favor this process. The transport factor of the PI (PITF) implicitly includes non-controllable elements of the environment, such as rainfall, which contributes to agriculture uncertainty, and it is favored by the current climate change process. In Mexico, few studies have considered the PITF; therefore, the objective of this work was to apply the calculation methodology for the PITF and identify those areas that are vulnerable to the loss of phosphorus from land to water bodies in two climate change scenarios and three climates of Jalisco. The PI model of Gburek was applied in two representative routes of concentration of greenhouse gases (CPR): 4.5 and 8.5, with climatologies for 2030, 2050 and 2070, and for 2010 as baseline. The PITF was calculated using ARCGIS and the IDRISI GIS. The results showed levels of vulnerability to the loss of phosphorus ranging from very low to high at the baseline, while in RCP4.5 the PITF was rated very low to medium, and in the RCP8.5, very low to high. An element that stood out in the PITF was the high vulnerability of the plots located near a drainage network or water body.
Key words Phosphorus loss; Environmental risk; Water quality
El índice de fósforo (IP) es una herramienta de planeación para identificar los campos agrícolas o ganaderos con potencial de aporte de fósforo para los cuerpos de agua y distinguir prácticas de manejo de nutrientes que favorecen este proceso. El factor de transporte del IP (FTIP), tiene implícitos elementos no controlables del ambiente, como la lluvia, la cual da incertidumbre a la agricultura y es favorecido por el proceso de cambio climático actual. En México pocos estudios se han realizado con el FTIP, por lo que el objetivo del presente trabajo fue aplicar la metodología de cálculo para el FTIP e identificar áreas vulnerables a la pérdida de fósforo de las tierras a los cuerpos de agua en dos escenarios de cambio climático y tres climatologías de Jalisco. Se utilizó el modelo de IP de Gburek, aplicado en dos rutas representativas de concentración de gases efecto invernadero (RCP 4.5 y 8.5), con las climatologías 2030, 2050 y 2070, y 2010 como línea base. En el cálculo del FTIP se utilizaron ARCGIS y GIS IDRISI. Los resultados mostraron niveles de vulnerabilidad a la pérdida de fósforo de muy bajo a alto en la línea base, mientras en el RCP4.5 se calificó el FTIP como muy bajo a medio y en la RCP8.5 fue de muy bajo a alto. Un elemento que resultó sobresaliente en el FTIP fue la alta vulnerabilidad de los predios con poca distancia a la red de drenaje o cuerpo de agua.
Palabras clave Pérdida de fósforo; Riesgo ambiental; Calidad de agua
Introduction
The loss of phosphorus (P) from diffuse agricultural and livestock sources pollution is the main cause of eutrophication of freshwater in the agricultural regions in the developed countries1,2 and in developing countries like Mexico3,4. In some regions of Mexico, with high concentration of livestock, such as the Highlands of Jalisco4, or with a high intensity of land use, such as the central region of Jalisco5, the effects are visible in the superficial water bodies, due to the excessive growth of algae and aquatic weeds6-10.
This problem has been addressed by using the Phosphorus Index (PI)11. In the United States of America, it is used as a common tool for strategic planning of the use of nutrients12. The PI allows to identify the potential for P contribution from agricultural fields or cattle ranchers to the water bodies and distinguish the management practices that reduce the losses of P and which contribute to preserve the quality of the soil and water13. The PI has been evaluated and calibrated for the Highlands de Jalisco9.
The PI address is characterized by two types of factors: 1) The transport factors of P which are soil erosion, the superficial runoff and the distance between the plots and a superficial drainage network or a surface water body (connectivity), and 2) the source of P, constituted by the phosphorus content in the soil, the frequency and method of application of chemical fertilizers, and the organic sources of P11. The Phosphorus Index Transport Factors (PITF) take into account the transfer of dissolved and adsorbed P in runoff by the sediments that travel from the plot to the surface water bodies or to the superficial drainage network. The PITF implicitly include non-controllable elements of the environment, such as rain, which provides agriculture with a high uncertainty for production, but also with the mechanisms for the phosphorous loss. Each factor is classified into five levels of vulnerability according to its intensity, a rate that is subsequently multiplied by a weighting value. The PITF are the result of the multiplication of each weighted factor in order to obtain vulnerability levels of P loss with values ranging from 0 to 1. Finally, the value of the PITF is multiplied by the source of the P factor in order to obtain the PI14,15.
From the point of view of climate change, several effects on ecosystems associated with climatological and hydrological processes with extreme events related to floods, large water runoff, periods of drought or drought and forest fires with direct implications for the PITF are expected16,17,18. However, the effects of rain events of rain that cause soil erosion and cause severe land degradation and environmental deterioration are particular important1,19,20. The Universal Soil Loss Equation (USLE) is used to estimate the water erosion in the PI9. The rainfall erosivity factor (R) of the USLE determines the current potential strength of the soil erosion from rain19,21 as an effect expected in the future due to the climate change22.
For the above reasons, the changing precipitation patterns and the superficial runoff from the climate modification have caused a high degree of uncertainty for agriculture and stockbreeding in Jalisco, particularly because of the possibility of increases in the diffuse phosphorus pollution that these primary activities generate. Hence the need to evaluate the PITF under different climatologies and climate change scenarios in Jalisco. The aim of the present work was to apply the Phosphorous Index Transport Factor methodology and calculation and identify those areas that are vulnerable to the loss of phosphorus from the land to the water bodies in two climate change scenarios and three climatologies of Jalisco, Mexico.
Material and methods
This study was developed for the state of Jalisco, Mexico. This has a surface area of 1'487.832 ha, of which 3.26 % are forests, 64.82% are utilized for grazing by livestock, 21.84% have an agricultural use, and 10.08% have some other use. Of the agricultural area, 292,903 ha are sown with irrigation crops, and 1'343.167 ha, with rain-fed crops23. The larger proportion of the surface with livestock grazing is an indicator of the importance of this activity in Jalisco, which is greatly supported by agriculture, also a primary activity that devotes to corn crops 72.1 % of the planted surface area.
The average annual precipitation in Jalisco in the period from 1961 to 2010 was 897 mm, with a maximum of 1,934 mm and a minimum of 461 mm. In this regard, 82.9 % of the rain is concentrated in the months from June to September, with the highest amount in July.
The Phosphorus Index Transport Factor (PITF) components determined by Gburek et al.11) were utilized. The estimated value of the PITF ranges between 0 and 1, with very low levels of vulnerability when the PITF is less than 0.15, 0.15 to 0.3; medium, when 0.3 to 0.5; high, when 0.5 to 0.8, and very high when above 0.824.
Estimation of the Factors of Transport of the Phosphorus Index (PITF)
The conceptual model shown in Figure 1 summarizes the PITF process of evaluation for determining the levels of vulnerability to the phosphorus loss. This figure describes the process of estimating water erosion with the USLE constituted by the factors rainfall erosivity of the soil (R), soil erodibility (K), length and steepness of the slope (LS), soil cover (C), and soil management practices (P); the annual runoff is evaluated with the Curve Number, and the phosphorus contributing distance between a plot and the drainage network or surface water body. The value of vulnerability with the levels of PITF varies from 0.072 to 1.

P Transport factors
These include water erosion, surface runoff, and the return period or the distance to the surface water bodies or the surface drainage network. Each of these components is described below.
Water erosion. Water erosion was estimated with the USLE, which was designed to calculate sheet erosion and erosion in furrows of plots25; it consists in a multifactorial mathematical model that integrates six processes involved in erosion, as indicated by the expression26:
where:
E is the annual loss of soil in (t)·(ha·yr) -1 ,
R is the soil erosivity factor from the rain in (MJ·mm)·(ha·h)-1,
K is the soil erodibility factor (in t·ha-1)·(ha·h)·(MJ·mm)-1,
L is the length of the slope (dimensionless),
S is the factor of the degree of the slope (dimensionless),
C is the factor of crop management (dimensionless),
P is the factor of mechanical practices for erosion control (dimensionless).
The factor R. Maps were generated with the average annual rainfall of the area of study for the 1961-2010, 2021-2040, 2041-2060 and 2061-2080 climate scenarios27. The R factor was estimated for each climate change scenario with the equations presented by Figueroa et al28, corresponding to regions IV, VII and X of the Mexican Republic, where the state of Jalisco is located. The following models were applied: (Region IV)
The K factor values were used as indicated by Figueroa et al28 for each unit of the soil charts of INEGI30 in the state of Jalisco, with the FAO soil classification.
The length of the land slope (L). The following function was used for calculating the length of the slope (L):
The slope factor (S) was calculated using the following equations:
The crop cover and crop management factor (C). The use of the soil was derived from the vector maps of series IV of INEGI. As for the land with agricultural use, it was considered to be planted with corn, and therefore the factor applied for this use was C= 0,433; grasslands were assigned a value of C= 0.16. Flores et al33 report other values of C for land use.
The mechanical practices factor (P). The values of the P-factor for erosion control in agricultural land recommended by Williams et al34 were used. These are a ratio of the slope percentage to the maximum length of the contour ploughed furrows, and they were applied only to soils used for rain-fed agriculture. On land with other uses (livestock and forestry), the P value was equal to 1, because it was assumed that no mechanical practices are developed in them.
Surface runoff. The effect of surface runoff on the transport of phosphorus is evaluated based on the Curve Number (CN). The CN was calculated using the following procedure:
The parameter of moisture retention (s) was estimated using the average runoff volume and the amount of rain, with the following expression35:
The CN was determined based on the parameter s, using the following equation38:
Distance between a plot and the drainage network or surface water body. The distance from the site of origin to the point of connection with the drainage network or surface water body was determined using ARCGIS, with the commands flow direction and flow accumulation, applied to the digital elevation model of the INEGI for Jalisco.
Climate change scenarios
These were estimated using the median of 11 general circulation models (GCMs) of monthly precipitation generated by Ruiz-Corral et al27, belonging to the CMIP5 (Intercomparison of Coupled Models Phase 5): BCC-CSM1-1, Ccsm4, GISS-E2-R, HadGEM2-AO, HadGEM2-IS, Ipsl-CM5A-LR, MIROC-ESM-CHEM, MIROC-ESM, MIROC5, MRI-CGCM3, NorESM1-M. The reduced and calibrated results for the rainfall of two representative routes of concentration of greenhouse gases (RCP) were utilized: RCP8.5 and RCP4.5, applied to three climatologies in the study area -2030, 2050 and 2070-, and at the rainfall baseline, the climatology for 1961 to 2010, identified in the analysis as 2010 and generated in previous study by Ruiz-Corral et al27.
Analysis of the information
The PITF was estimated based on the annual rainfall of the climatologies for 2010, 2030, 2050 and 2070, according to the methodology described in raster images with a resolution of 3" for the routes of concentration of greenhouse gases (RCP) 4.5 and 8.5 in the state of Jalisco. The same land use was considered for the future scenarios. The changes in the FTPI were obtained with the subtraction on images of the 2010-2030, 2010-2050 and 2010-2070 periods, a calculation performed with IDRISI Selva. The rate of change in the PITF was evaluated with the linear regression slope between the surface of PITF strata in the years of evaluation for RCP 4.5 and 8.5.
Results and discussion
The Phosphorus Index Transport Factor (PITF) on the RCP4.5 scenario
Figures 2a, b, c and d show the PITF in Jalisco with RCP 4.5 in the climatologies for 2010, 2030, 2050 and 2070, respectively. The PITF for baseline climatology ranged from 0.072 to 0.54; in the climatology for 2030 and 2050, it was 0.072 to 0.491, and in the climatology for 2070, it changed from 0 to 0.486. Table 1 shows the area occupied by the levels of vulnerability to loss of P.
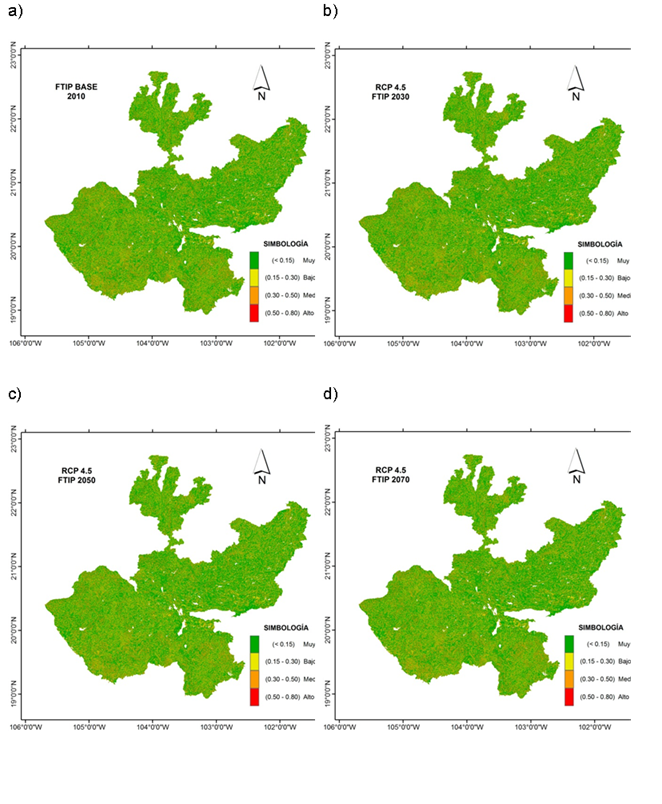
Figure 2 Phosphorus Index Transport Factor for the RCP 4.5 scenario in the climatologies for a) 2010, b) 2030, c) 2050, and d) 2070, in the lands of Jalisco
Table 1 Surface area occupied by each stratum with the Phosphorus Index Transport Factor (FTIP) in climate change scenario RCP4.5 with three climatologies
| Level of vulnerability | PITF per year of climatology (thousand ha) | ||||
|---|---|---|---|---|---|
| Description | PITF value | 2010 | 2030 | 2050 | 2070 |
| Very low | < 0.15 | 4,682.6 | 4,676.9 | 4,675.2 | 4,674.1 |
| Low | 0.15 to.30 | 889.3 | 906.5 | 913.7 | 919.8 |
| Medium | 0.30 to.50 | 2,188.3 | 2,177.0 | 2,171.4 | 2,166.3 |
| High | 0.50 to.80 | 0.109 | 0 | 0 | 0 |
At the baseline, the level of vulnerability to the phosphorus loss in the land is rated very low to high risk, while in the climatologies for 2030, 2050 and 2070, the level of risk is rated very low to medium, and the high level disappears. The very low level of vulnerability due to the PITF (< 0.15) occupies the largest area, followed by the average (0.30 to 0.50) and low (0.15 to 0.30) levels. The tendency of each layer of the PITF of the RCP4.5 scenario in the climatologies studied with the occupied surface area is depicted with the slopes of linear regression models shown in Table 5. These slopes show that surfaces at the very low and medium vulnerability levels have a greater tendency to decrease per year, while at the low level, the tendency is to increase.
Table 2 Surface area with expected positive and negative changes in the Phosphorus Index Transport Factor (PITF) in the climatologies for 2030, 2050 and 2070, in relation to 2010, under the RCP4.5 scenario
| Level of change in the PITF | Surface area (thousand ha) | ||
|---|---|---|---|
| 2010 to 2030 | 2010 to 2050 | 2010 to 2070 | |
| Negative change |
7,492.4 | 11.5 | 18.5 |
| Positive change ( |
267.9 | 7,748.7 | 7,741.8 |
Table 3 Surface area by strata of Transport Factor of the Phosphorus Index (PITF) in the climatology of reference and three future climatologies in the RCP8.5 scenario
| Level of vulnerability | PITF per year of climatology (thousand ha) | ||||
|---|---|---|---|---|---|
| Description | PITF value | 2010 | 2030 | 2050 | 2070 |
| Very low | < 0.15 | 4,682.6 | 4,675.1 | 4,673.9 | 4,672.0 |
| Low | 0.15 to.30 | 889.3 | 919.6 | 931.3 | 944.2 |
| Medium | 0.30 to.50 | 2,188.3 | 2,165.3 | 2,154.5 | 2,143.3 |
| High | 0.50 to.80 | 0.109 | 0.269 | 0.486 | 0.825 |
Table 4 Estimated surface area due to the level change in the Phosphorus Index Transport Factor (PITF) in Jalisco, from 2010 to 2030, 2050 and 2070 under the RCP8.5 scenario
| Level of change in PITF | Change of climatology in the RCP 8.5 scenario (Thousand ha) | ||
|---|---|---|---|
| 2010 to 2030 | 2010 to 2050 | 2010 to 2070 | |
| < 0 | 54.6 | 0 | 0 |
| 0 - 0.05 | 7,703.5 | 5,242.2 | 5,257.6 |
| 0.05 - 0.10 | 0.283 | 448.8 | 440.7 |
| > 0.10 | 1.8 | 2,069.3 | 2,062.0 |
Table 5 Linear regression models between the surface areas occupied by each level of vulnerability of the PITF with the year of the climatology
| Level of vulnerability | RCP 4.5 scenario | RCP 8.5 scenario | |||
|---|---|---|---|---|---|
| Description | PITF value |
Model | R2 | Model | R2 |
| Very Low | < 0.15 | y = -0.136x + 4953.8 | 0.86 | y = -0.165x + 5012.0 | 0.84 |
| Low | 0.15 to.30 | y = 0.495x - 101.6 | 0.94 | y = 0.882x - 877.7 | 0.94 |
| Medium | 0.30 to.50 | y = -0.357x + 2904.8 | 0.96 | y = -0.729x + 3649.8 | 0.96 |
| High | 0.50 to.80 | y = 0.012x - 23.7 | 0.97 | ||
Given that the risk of transport of phosphorus is associated with the mobility generated by water, producing particle detachment due to the splashing of rain water and its contained kinetic energy, the flow of subsurface and surface water39. This process is identified in the medium and high risk values of the RCP 4.5 scenario and the studied climatologies, associated mainly to plots with close proximity to the drainage networks or bodies of water. This result is consistent with other studies at a watershed scale40,41,42. For this reason, the value of the vulnerability due to the current PITF with regard to the RCP 4.5 scenario in the assessed climatologies does not reflect major changes, as the precipitations estimated for future climatologies in Jalisco are not expected to increase significantly, and in some areas they are even expected to diminish, causing a decrease in the risk of PITF at very low and medium levels, adding this surface to the very low level of risk that tends to increase. This trend is similar to that estimated in the PITF for Lake Poyang in China43 in the climate change scenarios RCP2.6, 4.5, and 8.5, even when including changes in the intensity of extreme events and their frequency.
Table 2 shows the comparison between the PITF baseline and that estimated for the climatologies for 2030, 2050 and 2070 in the RCP4.5 climate scenario. The PITF negative changes indicate a higher value of the index in the future scenario; on the other hand, when the change is positive, the index decreases, and the surface area of the future climatology diminishes. Within this context, the positive change in the PITF implies a reduction in the risk due to diffuse phosphorus pollution. The 2010-2030 period exhibits the largest surface with a negative change in the PITF; however, in the 2010-2050 and 2010-2070 periods, the situation is reversed, with higher PITF in 2010 than in 2050 and 2070. This implies a greater risk due to diffuse phosphorus pollution in the 2010-2030 period and a lower risk in the climatologies for 2010-2050 and 2010-2070 in Jalisco.
The precipitation of the climatologies for 2030 to 2070 in the RCP4.5 climate change scenario expressed no significant increases in the annual rainfall utilized by the PI model. The most important change is expected in rainfall patterns with events of greater intensity16, but the PITF model uses only the annual rainfall in the climatology of the baseline and future climatologies. With extreme events in the future precipitations, the effects will possibly be reflected in a greater hydric erosion and a larger amount of surface runoff; however, the current knowledge does not allow to identify these characteristics in climate prediction models16,18.
Transportation Factor of the Phosphorus Index (PITF) in the RCP8.5 scenario
Figures 3a, b, c and d show the distribution of the PITF for the lands of Jalisco in the climatologies for 2030, 2050 and 2070 in the RCP 8.5 scenarios. Based on these maps, strata were identified by level of vulnerability of the PITF shown in Table 3. The PITF for the baseline climatology and the climatologies for 2030, 2050 and 2070 ranged between 0.03 and 0.54, with generation of the strata with the PITF shown in Table 3. The strata with the greatest surface were very low (PITF < 0.15) and medium (PITF 0.30 - 0.50), with a tendency to reduce the transport factor of the future climatologies, while at the low and high levels, despite having a low surface area, they tended to increase it in the future climatologies.
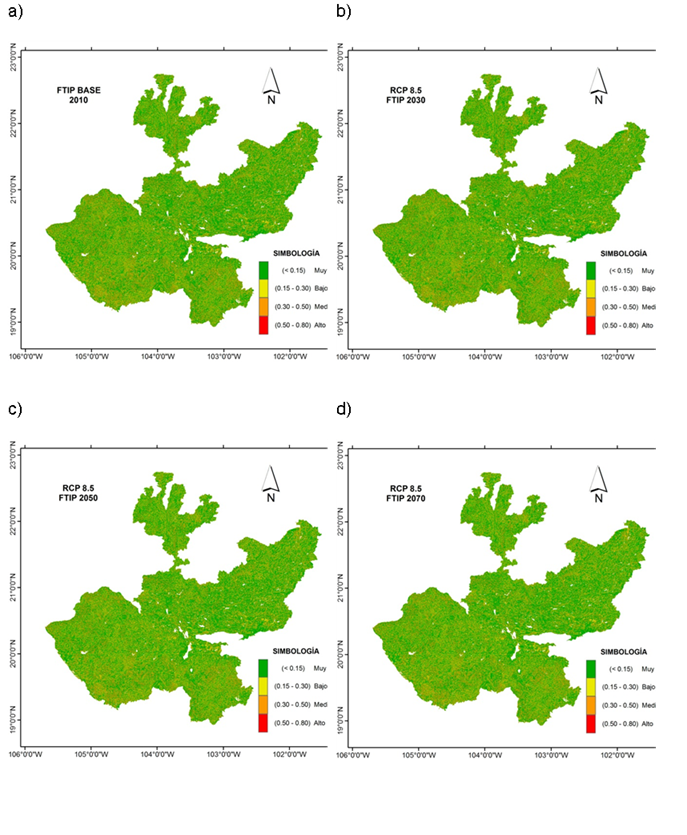
Figure 3 Phosphorus Index Transport Factor for the RCP 8.5 scenario in the climatologies for a) 2010, b) 2030, c) 2050 and d) 2070
The comparison between the values of the PITF in the climatologies for 2010-2030, 2010-2050 and 2010-2070 is shown in Table 4, which summarizes the change in the surface areas associated with the various levels of the PITF in this scenario and in the studied climatologies. This comparison led to changes in the surface of PITF from less than zero to over 0.10, all of them considered to be very low vulnerability levels. In the level with a PITF below 0, the surface area was larger in 2030 with respect to 2010 by more than 54 thousand ha; however, in the 2010-2050 and 2010-2070 periods this level disappears.
The PITF level of 0 to 0.05 exhibited the largest surface area in the 2010-2030 period, with a significant reduction on the surface for the 2010-2050 and 2010-2070 periods. In the levels of 0.05-0.10 and above 0.10 of the PITF, the surface area increases, particularly in the PITF level above 0.10 in the 2010-2050 and 2010-2070 periods. These changes are attributed to the expected increase in the rainfall, which leads to a greater phosphorus loss in agricultural lands, similarly to those reported for the RCP 8.5 of Lake Poyang in China43.
The exchange rates observed in the surfaces of each level of vulnerability of the PITF and study climatologies of study are shown in Table 5. Although the response observed in the PITF is very low, it is the product of the minimum changes in rainfall of the climatologies for 2030, 2050 and 2070 in the RCP 8.5 scenario; it is also a reflection of the small increase in annual rainfall used by the PI model. For this reason, it is possible that the PITF is being underestimated, as a change in rainfall patterns is expected with events of greater intensity16,44 that the PITF model does not consider in its components of soil erosion and runoff. In this regard, on September 7, 2003, Flores29 reported a rainfall event of 150.05 mm in 24 h with its maximum intensity in 30 min of 68.5 mm/h in Tepatitlán, Jalisco. A possible solution is to calculate the water erosion and surface runoff at a monthly or even daily scale, as indicated in the PITF11, for use with future climate information27.
The models to estimate soil erosivity due to rainfall with a monthly scale are achieving good results in recent studies45,46 and are generating new mathematical functions for monthly and daily time scales47, which it is important for Mexico to develop, given the predicted expectations of climate change16, and regarding which there is little progress to date. Although the current models for the calculation of the rainfall soil erosivity28 show the tendency to increase the aggressiveness of the rains with the increase in annual precipitation, it is advisable to evaluate this index under broader conditions than those referred to in the present study. In addition, however, there is an urgent need to obtain future rainfall estimates at a daily scale, because these events may be underestimated when using a monthly or annual scale48,49.
Although the surfaces with the PITF were similar in the RCP4.5 and RCP8.5 scenarios in the studied climatologies, the risk of diffuse phosphorus pollution persists with a high level of risk in areas near surface water bodies and drainage networks, which should be addressed, in both the current and future scenarios, by designing good agricultural practices to restrain the diffuse phosphorus pollution in these areas.
Conclusions and implications
The results of this study demonstrate the feasibility of applying the PITF to the conditions of Jalisco with the baseline climatology for 2010 and climate change scenarios with proposed future climatologies. With results obtained, it was possible to identify tendencies in the route of the concentration of greenhouse gases under the RCP 4.5 and RCP 8.5 scenarios in Jalisco. For the RCP4.5 scenario, the negative change in the PITF implied an increase in the P index, which entails a higher risk due to diffuse phosphorus pollution; however, a positive change brings about a reduction of the risk of diffuse phosphorus pollution. In contrast to the RCP8.5 the largest surface area was identified with a very low and medium vulnerability, with a tendency to reduce the PITF, whereas in the strata with low and high levels of vulnerability, the tendency was to increase it. In general, the PITF in scenarios RCP 4.5 and RCP 8.5 of the assessed climatologies do not reflect major changes in the value of vulnerability due to PITF, as no significant increases are expected in the amounts of rainfall estimated for Jalisco in the future climatologies. Because the PITF model is calculated based on the annual precipitation, this time scale does not consider rainfall patterns with high intensity events or the heavier precipitations expected in the climate change scenarios; therefore, it is advisable to develop functions to estimate the rainfall soil erosivity and the runoff at a monthly or even daily scale when calculating the PITF, the surface runoff and the hydric erosion. In the studied RCP scenarios and climatologies, areas with proximity to water bodies and surface drainage network represent a greater vulnerability to the PITF.
Literatura citada
1. Zhou B, Vogt RD, Xu C, Lu X, Xu H, Bishnu JP, Zhu L. Establishment and validation of an amended phosphorus index: Refined phosphorus loss assessment of an agriculture watershed in Northern China. Water Air Soil Pollut 2014;(225):2103. [ Links ]
2. Sharpley AN, Daniel TC, Edwards DR. Phosphorus movement in the landscape. J Produ Agric 1993;6(4):492-500. [ Links ]
3. Flores LHE, Ireta MJ, Pérez DJF, Ruíz CRC, Díaz MP. Identificación de buenas prácticas agrícolas para reducir la degradación del suelo e incrementar la calidad del agua. Jalisco, México. INIFAP. 2009. [ Links ]
4. FAO. Food and Agriculture Organization. Reporte de la iniciativa de la ganadería, el medio ambiente y el desarrollo - Integración por zonas de la ganadería y de la agricultura especializadas (AWI) - Opciones para el manejo de efluentes de granjas porcícolas de la zona centro de México. 2003. http://www.fao.org/wairdocs/LEAD/X6372S/x6372s00.htm Consultado 28 Jun, 2007. [ Links ]
5. SIAP. Servicio de Información Agroalimentaria y Pesquera. Estadísticas de producción. 2016. Tomado de: Tomado de: http://www.gob.mx/siap/ Consultado 12 Oct, 2016. [ Links ]
6. De La Mora OC, Flores LHE, García VJ, Chávez DAA, Ruíz CJA. Caracterización taxonómica del plancton en la presa El Jihuite en Tepatitlán de Morelos, Jalisco. Jalisco, México: INIFAP. 2011. [ Links ]
7. Flores LHE, Hernández JAL, Figueroa VU, Castañeda VAA. Calidad Microbiológica del agua por contaminación difusa de la aplicación de estiércoles en maíz y pasto. Tecnologías y Ciencias del Agua. TyCA-RETAC 2012; (III):127-141. [ Links ]
8. Román MMR. Confort térmico y características del sistema de producción de bovinos de leche en la cuenca hidrográfica el Jihuite de los Altos de Jalisco [tesis licenciatura]. Tepatitlán de Morelos, Jalisco: Universidad de Guadalajara; 2009. [ Links ]
9. Flores LHE, Figueroa VU, De La Mora OC, Núñez GG, Valdivia GL. Evaluación y calibración del índice de fósforo en los Altos de Jalisco, México. Rev Mex Cienc Agríc 2014;5(3):367-378. [ Links ]
10. Flores LHE, Paredes MR, Ruvalcaba GJM, De La Mora OC, Pérez DJF, Ireta MJ. Metodología para la evaluación del valor agregado del programa de maíz de alto rendimiento (PROEMAR) 2010 en Jalisco y Guanajuato. Jalisco, México. INIFAP. 2011. [ Links ]
11. Gburek WJ, Sharpley AN, Heathwaite L, Folmar GJ. Phosphorus management at the watershed scale: a modification of the phosphorus index. J Environ Quality 2000; (29):130-144. [ Links ]
12. Sharpley AN, Weld JL, Beegle DB, Kleinman PJA, Gburek WJ, Moore Jr PA, Mullins G. Development of phosphorus indices for nutrient management planning strategies in the United States. J Soil Water Conserv 2003;(58):137-152. [ Links ]
13. Dechmi F, Isidoro D, Stambouli T. A phosphorus index for use in intensive irrigated areas. Soil Use Manage 2013;29 (Suppl 1):64-75. [ Links ]
14. Marjerison RD, Dahlke H, Easton ZM, Seifert S, Walter MT. A Phosphorus Index transport factor based on variable source area hydrology for New York State. J Soil Water Conserv 2011;(66):149-157. [ Links ]
15. Mallarino AP, Stewart BM, Baker JL, Downing JD, Sawyer JE. Phosphorus indexing for cropland: Overview and basic concepts of the Iowa phosphorus index. J Soil Water Conserv 2002;57(6):440-447. [ Links ]
16. IPCC. Intergovernmental Panel on Climate Change. Climate Change 2014: Synthesis Report. Contribution of Working Groups I, II and III to the Fifth Assessment Report of the Intergovernmental Panel on Climate Change [Core Writing Team. Pachauri RK and Meyer LA, editors]. IPCC, Geneva, Switzerland. 2014. [ Links ]
17. Burlando P, Rosso R. Extreme storm rainfall and climatic change. Atmos Res 1991; (27):169-189. [ Links ]
18. Zhang GH, Nearing MA, Liu BY. Potential effects of climate change on rainfall erosivity in the yellow river basin of china. Trans ASAE 2005;(48):511−517. [ Links ]
19. Diodato N, Bellocchi G, Romano N, Chirico GB. How the aggressiveness of rainfalls in the Mediterranean lands is enhanced by climate change. Climatic Change 2011;(108):591-599. [ Links ]
20. Guhathakurta P, Sreejith OP, Menon PA. Impact of climate change on extreme rainfall events and flood risk in India. J Earth Syst Sci 2011;120(3):359-373. [ Links ]
21. Heckrath G, Bechmann M, Ekholm P, Ule`n B, Djodjic F, Andersen HE. Review of indexing tools for identifying high risk area of phosphorus loss in Nordic catchments. J Hydrol 2008;(349):68-87. [ Links ]
22. NASEM. National Academies of Sciences, Engineering, and Medicine. Attribution of Extreme Weather Events in the Context of Climate Change. Washington, DC: The National Academies Press; 2016. [ Links ]
23. SIAP. Servicio de Información Agroalimentaria y Pesquera. SIACON 2017. https://www.gob.mx/siap/acciones-y-programas/produccion-agricola-33119 Consultado 15 Dic, 2017. [ Links ]
24. Troitiño F, Trasar-Cepeda C, Leirós MC, Gil-Sotres F. Validation and modification of the phosphorus loss index as applied to a small catchment. Soil Use Manage 2013;29(Suppl 1):114-123. [ Links ]
25. Wischmeier WH. Use and misuse of the universal soil loss equation. J Soil Water Conserv 1976;31(1):5-9. [ Links ]
26. Wischmeier WH, Smith DD. Predicting rainfall erosion losses-a guide to conservation planning. Agriculture Handbook 537. USDA, Washington, DC; 1978. [ Links ]
27. Ruiz-Corral JR, Medina-García G, Rodríguez-Moreno VM, Sánchez-González JJ, Villavicencio-García R, Durán Puga N, et al. Regionalización del cambio climático en México. Rev Mex Cienci Agríc 2016; Pub Esp (13):2451-2464. [ Links ]
28. Figueroa SB, Amante OA, Cortés THG, Pimentel LJ, Osuna CES, Rodríguez OJM, Morales FFJ. Manual de predicción de pérdidas de suelo por erosión. San Luis Potosí, México: SARH-Colegio de Posgraduados; 1991. [ Links ]
29. Flores LHE. Rutas de transporte superficial de nitrógeno y fósforo en un área de drenaje de Jalisco, México [tesis doctorado]. Montecillo, Texcoco, Estado DE México: Colegio de Posgraduados; 2004. [ Links ]
30. Instituto Nacional de Estadística, Geografía e Informática (INEGI). Cartas Edafológicas, escala 1:1’000,000. México, DF; 1993. [ Links ]
31. Foster GR, Meyer LD, Onstad CA. A runoff erosivity factor and variable slope length exponents for soil loss estimates. Trans ASAE 1977;(20):683-687. [ Links ]
32. McCool DK, Brown LC, Foster GR, Mutchler CK, Meyer CK. Revised slope steepness factor for the Universal Soil Loss Equation. Trans ASAE 1987;10(5):1387-1396. [ Links ]
33. Flores LHE, Pérez DJF, Ireta MJ. Estimación de la erosión hídrica en agave tequilero en Jalisco. Jalisco, México. INIFAP; 2010. [ Links ]
34. Williams JR, Dyke PT, Fuchs WW, Benson VW, Rice OW, Taylor ED. EPIC- Erosion/Productivity Impact Calculator: 2 User manual. Technical Bulletin 1768. USDA-ARS, Temple, Texas. 1990. [ Links ]
35. Jasso IR, Sánchez CI, Stone JJ, Melgoza CA, Simanton JR, Martínez RJG. Estimación de parámetros para la modelación del escurrimiento superficial y erosión hídrica. En: Sánchez CI, et al, editores. Uso de la lluvia artificial para parametrizar modelos de procesos hidrológicos. Gómez Palacio, Durango. INIFAP. 1999. [ Links ]
36. SARH-CP. Manual de Conservación del Suelo y del Agua. 2da ed. Texcoco, México: Colegio de Postgraduados; 1982. [ Links ]
37. Flores LHE, Martínez MM, Oropeza MJL, Mejía SE, Carrillo GR. Integración de la EUPS a un SIG para estimar la erosión hídrica del suelo en una cuenca hidrográfica de Tepatitlán, Jalisco, México. Terra 2003;(21):233-244. [ Links ]
38. NRCS. Natural Resources Conservation Service. Phosphorus Assessment Tool for Texas. USDA-NRCS. Texas, USA; 2012. [ Links ]
39. Schoumans OF, Chardon W. Risk assessment methodologies for predicting phosphorus losses. J Plant Nutr Soil Sc 2003;(166):403-408. [ Links ]
40. Reichmann O, Chen Y, Iggy LM. Spatial model assessment of P transport from soils to waterways in an Eastern Mediterranean watershed. Water 2013;(5):262-279. [ Links ]
41. Zhou H, Gao C. Assessing the risk of phosphorus loss and identifying critical source areas in the Chaohu Lake Water shed, China. Environ Manage 2011;(48):1033-1043. [ Links ]
42. Ortega-Achury SL, Martinez-Rodriguez GA, Sotomayor-Ramirez DR, Ramirez-Avila JJ. Caribbean phosphorus index validation and management practices evaluation on fields under manure applications. An ASABE Meeting Presentation Paper. Reno, Nevada. 2013. [ Links ]
43. Jiang S, Zhang Q. Modelling phosphorus transport and its response to climate change at upper stream of Poyang Lake-the largest fresh water lake in China. Geophys Res Abst 2017;(19):EGU2017-2365-1. [ Links ]
44. Meelh GA, Arblaster JM, Tebaldi C. Understanding future patterns of increased precipitation intensity in climate model simulations. Geophys Res Lett 2005;(32):L18719. [ Links ]
45. Lee MH, Lin HH. Evaluation of annual rainfall erosivity index based on daily, monthly, and annual precipitation data of rainfall station network in southern Taiwan. INT J DISTRIB SENS N 2015; 11(6):1-15 INT J DISTRIB SENS N 2015; 11(6):1-15 http://journals.sagepub.com/doi/full/10.1155/2015/214708 Accessed 14 Dec, 2017. [ Links ]
46. Sadeghi SH, Tavangar S. Development of stational models for estimation of rainfall erosivity factor in different timescales. Nat Hazards 2015;77(1):429-443 Nat Hazards 2015;77(1):429-443 https://link.springer.com/article/10.1007/s11069-015-1608-y Accessed 14 Dec, 2017. [ Links ]
47. Bonilla CA, Vidal KL. 2011. Rainfall erosivity in Central Chile. J Hydrol 2011;(410):126-133. [ Links ]
48. Sun Y, Solomon S, Dai A, Portmann RW. How often does it rain? J climate 2006; (19):916-934. [ Links ]
49. Sun Y, Solomon S, Dai A, Portmann RW. How often will it rain? J climate 2007; (20):4801-4818. [ Links ]
Received: November 20, 2017; Accepted: August 22, 2018
 Este es un artículo publicado en acceso abierto bajo una licencia Creative Commons
