


Services on Demand
Journal
Article
 text in
  English (pdf)
 Article in xml format
 Article references
 Send this article by e-mail
Indicators
-
 Cited by SciELO
 -
 Access statistics
Related links
-
 Similars in
SciELO
Similars in
SciELO
Share

 Permalink
Revista mexicana de ciencias pecuarias
On-line version ISSN 2448-6698Print version ISSN 2007-1124
Rev. mex. de cienc. pecuarias vol.11 n.4 Mérida Oct./Dec. 2020 Epub Mar 02, 2021
https://doi.org/10.22319/rmcp.v11i4.5457
Articles
Pedigree analysis in ten sheep populations in Mexico
a Universidad Autónoma de Chihuahua. Facultad de Zootecnia y Ecología. Periférico Francisco R. Almada km 1. 31453, Chihuahua, Chih. México.
b Universidad Complutense de Madrid. Facultad de Veterinaria. Madrid. España.
Pedigree analysis is vital in designing genetic improvement strategies. Population genetic parameters were analyzed in ten sheep breeds in Mexico: Blackbelly (BBL; n= 19,695); Charollais (CHA; n= 5,033); Dorper (DOR; n= 42,171); White Dorper (DOB; n= 4,213); Dorset (DOS; n= 5,557); Hampshire (HAM; n= 12,210); Katahdin (KAT; n= 77,955); Pelibuey (PEL; n= 42,256); Rambouillet (RAM; n= 11,951); and Suffolk (SUF; n= 14,099). All animals were born between 1992 and 2018. The analyses were run with the ENDOG software. Known parents values ranged from 76.4 % (SUF) to 95.3 % (KAT), with an 86.0 % average; animals with unknown parents corresponded to founders. The consanguineous population (as a percentage of total population) fluctuated from 12.3 % in DOS to 48.7 % in DOB, with a 29.7 % average. Average inbreeding (F) ranged from 3.9% (KAT) to 14.6% (DOB), with an 8.0 % average. The proportion of consanguineous individuals in all populations increased (P<0.05). Genetic relatedness was stable, and F had negative trends (P<0.05). The highest consanguineous population growth rates were present in the KAT, DOB and BBL populations. Inbreeding (F) was highest in DOB and DOS, while genetic relatedness was highest in DOB and CHA. Effective population size (Ne) was greater than 50 in six of the populations but less than 37 in the remaining four. These low Ne values highlight the need to monitor the evolution of F and its possible implications. The generational interval (GI) ranged from 3.0 to 4.15, with a 3.45 years’ average. The highest GI values were for RAM and SUF, and the lowest for BBL and DOR.
Key words Inbreeding; Effective size; Population parameters; Generational interval; Founding ancestors
Se analizó el pedigrí en diez razas de ovinos mediante parámetros genéticos poblacionales. Las poblaciones fueron Blackbelly (BBL; 19,695), Charollais (CHA; 5,033), Dorper (DOR; 42,171), Dorper Blanco (DOB; 4,213), Dorset (DOS; 5,557), Hampshire (HAM; 12,210), Katahdin (KAT; 77,955), Pelibuey (PEL; 42,256), Rambouillet (RAM; 11,951) y Suffolk (SUF; 14,099); nacidos de 1992 a 2018. Los análisis se realizaron con el software Endog. En padres conocidos, los valores oscilaron de 76.4 % (SUF) a 95.3 % (KAT), con promedio general de 86.0%, los animales con padres desconocidos correspondieron a los fundadores. La población consanguínea (como porcentaje de la población total) fluctuó del 12.3 % en DOS al 48.7 % en DOB, con promedio general de 29.7 %; la consanguinidad (F) promedio osciló de 3.9 (KAT) a 14.6 (DOB), con promedio general de 8.0. La evolución de F y sus componentes fue: en todas las poblaciones, la proporción de consanguíneos se incrementó (P<0.05); los niveles de relación genética (RG) son estables; y, la F presentó tendencias negativas (P<0.05). KAT, DOB y BBL con altas tasas de crecimiento en población consanguínea; DOB y DOS, DOB y CHA con los niveles más altos de F y RG, respectivamente. Seis poblaciones presentaron tamaño efectivo (Ne) mayor a 50; el resto presentaron Ne menor a 37, lo cual señala el estatus de cuidado para monitorear la evolución de F y sus posibles implicaciones. El intervalo generacional (IG) osciló de 3.0 a 4.15, con promedio general de 3.45 años, los mayores IG fueron para RAM y SUF, BBL y DOR con IG menores.
Palabras clave Consanguinidad; Tamaño efectivo; Parámetros poblaciones; Intervalo generacional; Ancestros fundadores
Introduction
Sheep farming occurs throughout Mexico with regional variations in response to natural resources availability and markets1. The Organism of National Sheep Farmer Unity (Organismo de la Unidad Nacional de Ovinocultores - UNO) encompasses producers of specialized and registered sheep breeds, coordinates the genealogical registry of breed purity, and organizes genetic improvement programs based on genetic evaluations2. Selection based on the best linear unbiased predictor (BLUP), generated from genetic evaluations, favors selection of related animals, consequently increasing inbreeding3. Furthermore, levels of inbreeding and kinship are involved in genetic evaluations and BLUP predictions4,5.
Selection schemes can allow a small number of breeder stock or select families to generate changes in population structure, increasing inbreeding levels, reducing genetic variability, and possibly resulting in genetic drift6,7. Genetic variability determines a population’s capacity to respond to selection and genetic progress. Identifying the factors that affect genetic variability is essential when evaluating breeding strategies and deciding whether to continue with a selection scheme or take corrective actions8. Pedigree analysis is based on population genetic parameters and describes a population’s genetic dynamics and variability. The genetic structure of a population helps to track gene flow, providing information on the founding ancestors and their contributions to variability in the current population9,10.
The present study objective was to analyze the pedigree and population structure of ten sheep breeds using population genetic parameters such as pedigree integrity, number of generations, kinship and inbreeding, ancestors and founders, effective number and generational interval, among others. The results can be applied in developing selection schemes aimed at optimizing population response to selection by limiting the genetic variability loss rate.
Material and methods
Analyses were done using the national genealogical registry databases for each of ten sheep breed populations: Blackbelly (BBL); Charollais (CHA); Dorper (DOR); White Dorper (DOB); Dorset (DOS); Hampshire (HAM); Katahdin (KAT); Pelibuey (PEL); Rambouillet (RAM); and Suffolk (SUF). The pedigrees incorporated individuals born between 1992 and 2018, the Table 1 describes the genealogical information analyzed, pedigree analyses were run with the ENDOG ver. 4.0 software11 to evaluate the following population genetic descriptors.
Table 1 Pedigree structure, inbreeding and average relatedness coefficient levels in ten sheep breed populations in Mexico
| Breed | Pedigree | Sires (PS) |
Dams (PD) |
SD% (D/S) |
Fi (AFi) |
Fm (AFm) |
βP βF |
ARC |
|---|---|---|---|---|---|---|---|---|
| BBL | 19,695 | 544 (29.7) |
5,847 (2.8) |
32.4 (10.7) |
26.8 (8.4) |
16.9 (9.1) |
5.6x *
-0.29x ns |
0.88 |
| CHA | 5,033 | 266 (17.5) |
1,433 (3.4) |
33.8 (5.4) |
45.8 (8.0) |
36.5 (10.1) |
5.6x *
-0.56x * |
3.06 |
| DOR | 42,171 | 1,571 (24.1) |
12,818 (2.9) |
34.1 (8.2) |
26.9 (6.1) |
17.2 (6.9) |
6.5x *
-0.77x * |
0.66 |
| DOB | 4,213 | 166 (22.7) |
1,287 (2.9) |
34.4 (7.7) |
48.7 (14.6) |
32.3 (14.9) |
5.6x *
-0.59x * |
7.78 |
| DOS | 5,557 | 173 (25.5) |
1,601 (2.8) |
31.9 (9.3) |
12.3 (9.8) |
8.6 (9.9) |
5.5x *
-0.42x ns |
1.00 |
| HAM | 12,210 | 467 (22.9) |
3,687 (2.7) |
33.4 (8.5) |
21.3 (5.9) |
12.6 (6.3) |
4.9x *
-0.54x * |
1.13 |
| KAT | 77,955 | 2,927 (27.3) |
23,844 (3.3) |
34.3 (8.2) |
47.8 (3.9) |
33.5 (4.1) |
6.5x *
-0.01x ns |
1.28 |
| PEL | 42,256 | 1,285 (26.3) |
13,293 (2.6) |
34.5 (10.3) |
22.8 (6.8) |
13.8 (7.7) |
7.7x *
-0.24x * |
0.47 |
| RAM | 11,951 | 291 (37.1) |
3,534 (3.1) |
32.1 (12.1) |
24.9 (7.4) |
15.4 (7.5) |
7.4x *
-0.17x * |
1.21 |
| SUF | 14,099 | 347 (30.2) |
4,006 (2.8) |
30.1 (11.5) |
19.2 (9.2) |
14.2 (9.6) |
1.4x ns -0.53x * |
0.86 |
Breeds: Blackbelly (BBL); Charollais (CHA); Dorper (DOR); White Dorper (DOB); Dorset (DOS); Hampshire (HAM); Katahdin (KAT); Pelibuey (PEL); Rambouillet (RAM); and Suffolk (SUF). Pedigree = total individuals in the pedigree; Sires = total sires in pedigree (PS, average number of progeny per sire); Dams = total dams in pedigree (PD, average number of progeny per dam); Fi = percentage of consanguineous animals (AFi, average inbreeding); Fm = percentage of consanguineous mothers (AFm, average inbreeding of mothers); Slope of percentage of consanguineous animals (βP) and level of inbreeding (βF); ARC = average additive genetic relatedness coefficient; ns = not significant (P>0.05); * = significant (P<0.05).
Pedigree integrity
Integrity was evaluated using four parameters8,12. First is the proportion of known ancestors to the third generation, that is, parents, grandparents and great-grandparents. Second is the number of complete generations (NCG), which identifies the furthest generation with two known ancestors. Third is the number of traced generations (NTG), an indicator of the number of generations separating an individual from its furthest ancestor. Finally, the number of complete equivalent generations (NEG) expresses the sum of all known ancestors based on the number of generations (n) separating an individual from each ancestor (NEG= ∑(1/2)n).
Reproductive management
Reproductive management was quantified using four parameters: average number of progeny per sire (PS); average number of progeny per dam (PD); total number of sires and dams as a proportion of a pedigree’s total population (SD%); and ratio of number of dams to number of sires (D/S).
Inbreeding (F)
Inbreeding was estimated for each individual (Fi) and its mother (Fm) using the MTDFNRM program in the MTDFREML package13. Trends over time were generated using the birth year of consanguineous individuals from 2010 to 2018. The percentage of consanguineous animals (βP) and average inbreeding (βF) were calculated with a linear regression analysis for the period 2010 to 2018, based on the model ŷ = β0 + βx; where ŷ is the variable analyzed in year x, β0 is the intercept, and ( is the slope or rate of change. The analysis was run with the SAS statistical software package14.
Generational interval (GI)
This parameter was calculated using the mean age of a reproducing animal and replacing it with that of a descendent15. Average age of parents was calculated at the birth of their descendants using four selection routes: father-son, father-daughter , mother-son and mother -daughter16,17.
Average additive genetic relationship coefficient (ARC)
This parameter was generated using the matrix of additive genetic relationships between all the individuals in a pedigree by calculating the average value of the coefficients of each individual with the rest of the pedigree; that is, the average additive genetic relationship coefficient (ARC)9,18.
Effective number of founders (fe)
Individual founders are animals with unknown parents. The effective number of founders (fe) was defined as the number of founders that, when contributing equally, would produce the genetic diversity in the existing population10,19.
Effective number of ancestors (fa)
An ancestor is every individual, founder or not, that has contributed to the population’s genetic variability. The effective number of ancestors (fa) was defined as the number of ancestors required to explain a population’s total genetic variability, considering the genetic variability contributed by an individual that cannot be explained by its offspring’s contribution19,20.
Effective population size (Ne)
Realized Ne was estimated based on the formula 1 / 2ΔF; where ΔF is the average change in inbreeding as calculated from the number (t) of complete equivalent generations (ΔF = 1 - (1-Fi)1/(t-1)). It considers the amount of a pedigree’s genealogical information and generational overlap21,22. Effective population size (Ne) is defined as the number of breeding animals that could generate the calculated inbreeding and/or rate of change in genetic variance in an ideal population10,23.
Results and discussion
The precision of a population structure analysis depends on pedigree integrity and genealogical information content over generations. Incomplete information can lead to only approximate assignment of individuals to generations and inaccurate calculations of F and Ne. The present results for percentage of ancestors reflect more complete, deep genealogical information for the maternal route (Table 2). At the parents level, values ranged from 76.4 % (SUF) to 95.3 % (KAT), with an overall average of 86.0 %. The percentages of animals with unknown parents corresponded to the group of founding animals. Similar integrity levels and genealogical information content have been reported for pedigrees of the Nilagiri and Sandyno24, Santa Inés25 and Malpura17 breeds. In contrast, analyzed pedigrees for the Mehraban12, Guilan26 and Morada Nova8 had percentages of less than 60% for known parents, less than 40 % for grandparents and less than 30 % for great-grandparents. Of note is that, in all these reports the genealogical information was more extensive and complete for the maternal route, as occurred in the present study.
Table 2 Percentage of known parents in the pedigrees of ten sheep breeds in Mexico
| BBL | CHA | DOR | DOB | DOS | HAM | KAT | PEL | RAM | SUF | |
|---|---|---|---|---|---|---|---|---|---|---|
| Parents | ||||||||||
| S | 82.0 | 92.6 | 89.9 | 89.5 | 79.5 | 82.6 | 95.4 | 80.1 | 90.2 | 74.3 |
| D | 83.2 | 95.5 | 90.1 | 89.5 | 80.1 | 81.2 | 95.1 | 80.4 | 91.2 | 78.5 |
| Grandparents | ||||||||||
| SS | 59.6 | 61.6 | 63.4 | 63.9 | 36.4 | 56.9 | 90.7 | 57.4 | 67.3 | 39.1 |
| DS | 58.9 | 68.0 | 64.6 | 63.7 | 42.7 | 58.2 | 89.9 | 57.9 | 70.4 | 42.3 |
| SD | 59.8 | 81.9 | 74.9 | 76.2 | 46.8 | 57.5 | 89.5 | 53.8 | 60.1 | 48.1 |
| DD | 59.2 | 86.4 | 75.2 | 75.3 | 49.4 | 57.6 | 89.1 | 54.3 | 60.6 | 48.1 |
| Great Grandparents | ||||||||||
| SSS | 37.2 | 31.9 | 37.2 | 32.8 | 14.7 | 27.8 | 79.7 | 39.0 | 43.6 | 20.5 |
| DSS | 38.4 | 38.6 | 37.6 | 32.8 | 15.6 | 30.1 | 78.7 | 38.1 | 43.8 | 19.4 |
| SDS | 39.9 | 49.6 | 47.9 | 35.9 | 18.5 | 40.7 | 79.8 | 38.1 | 28.1 | 30.3 |
| DDS | 38.2 | 57.8 | 46.3 | 34.9 | 20.8 | 41.9 | 79.6 | 38.7 | 27.5 | 27.7 |
| SSD | 38.9 | 38.9 | 46.5 | 42.7 | 21.4 | 33.3 | 79.1 | 36.4 | 42.2 | 26.5 |
| DSD | 38.6 | 46.9 | 47.5 | 42.5 | 24.1 | 33.3 | 77.6 | 36.5 | 42.4 | 27.0 |
| SDD | 38.7 | 66.3 | 55.2 | 55.3 | 29.1 | 35.9 | 77.9 | 32.9 | 31.8 | 29.9 |
| DDD | 39.1 | 71.1 | 55.0 | 54.3 | 30.0 | 35.0 | 77.1 | 33.8 | 31.9 | 28.4 |
Breeds: Blackbelly (BBL); Charollais (CHA); Dorper (DOR); White Dorper (DOB); Dorset (DOS); Hampshire (HAM); Katahdin (KAT); Pelibuey (PEL); Rambouillet (RAM); and Suffolk (SUF). Parents: S= sire; D= dam.
Pedigree integrity is linked to estimates of NCG, NTG and NEG. In the present results the maximum values were similar across the ten breeds (Table 3). However, the interbreed averages differed noticeably, with the highest values for KAT and the lowest for DOS. Population structure is the result of the selection and reproductive management strategies applied by producers. The differences observed between the analyzed populations may be attributed to sire-based reproductive management which could have implications in Ne and GI. The PS and PD values (Table 1) show to what extent breeder stock were used across generations, and the SD% and D/S estimates are related to selection intensity and pressure.
Table 3 Number of generations, founding ancestors and effective size in ten sheep breeds in Mexico
| Breeds | NCG | NTG | NEG | Anc (fa) |
Anc% | Found (fe) |
Ne |
|---|---|---|---|---|---|---|---|
| BBL | 5.0 (1.66) |
11.0 (3.23) |
7.19 (2.24) |
2,110 (105.0) |
39 (3.3) |
3,425 (182.3) |
36.8 |
| CHA | 4.0 (1.67) |
11.0 (4.73) |
5.89 (2.67) |
235 (35.0) |
13 (7.1) |
299 (44.3) |
22.1 |
| DOR | 5.0 (1.65) |
12.0 (4.66) |
6.75 (2.55) |
2,836 (173.0) |
74 (3.0) |
4,219 (226.1) |
53.8 |
| DOB | 4.0 (1.67) |
10.0 (3.58) |
5.61 (2.31) |
271 (14.0) |
7 (22.3) |
441 (16.9) |
12.2 |
| DOS | 4.0 (1.06) |
8.0 (2.4) |
5.0 (1.60) |
735 (86.0) |
32 (4.2) |
1,104 (143.4) |
50.0 |
| HAM | 4.0 (1.29) |
10.0 (3.33) |
5.28 (1.97) |
1,380 (74.0) |
28 (4.7) |
2,090 (124.4) |
56.8 |
| KAT | 6.0 (2.70) |
13.0 (6.12) |
8.03 (4.02) |
2,578 (109.0) |
48 (3.9) |
3,295 (227.6) |
73.5 |
| PEL | 6.0 (1.50) |
11.0 (3.12) |
6.99 (2.10) |
5,296 (196) |
94 (3.6) |
8,348 (349.3) |
51.5 |
| RAM | 5.0 (1.60) |
8.0 (2.98) |
5.78 (2.12) |
1,073 (93.0) |
38 (5.6) |
1,111 (147.7) |
53.2 |
| SUF | 4.0 (1.09) |
9.0 (2.60) |
5.39 (1.65) |
1,746 (82.0) |
44 (5.1) |
3,332 (159.1) |
34.7 |
NCG = Maximum values (average values) for number of complete generations (NGC); NGT = number of traced generations; NEG = number of equivalent complete generations; Anc = total ancestors (fa = effective number of ancestors); Anc% = number of ancestors required to explain 50% of pedigree variability (maximum percentage that one ancestor explains pedigree variability); Found = total number of founders (fe = effective number of founders); Ne = realized effective population size. Breeds: Blackbelly (BBL); Charollais (CHA); Dorper (DOR); White Dorper (DOB); Dorset (DOS); Hampshire (HAM); Katahdin (KAT); Pelibuey (PEL); Rambouillet (RAM); and Suffolk (SUF).
In the evaluated pedigrees the consanguineous population fluctuated from 12.3 % in DOS to 48.7 % in DOB, with an overall average of 29.7 % (Table 1). Inbreeding (F) levels ranged from 3.9 % in KAT to 14.6 % in DOB, with an 8.0 % average. The levels and trends of F and its components (ACR, Ne, fe and fa) help in evaluating the evolution of genetic variability over time. Consanguineous animals are directly affected by the effects of inbreeding depression and all the consequences that an increase in F brings with it. Given the importance of maternal effects in sheep27,28, the possible effects of inbreeding depression also need to be evaluated through maternal inbreeding levels, using parameters such as percentage of consanguineous mothers and average inbreeding (Table 1).
In the present results F exhibited three overall trends in its evolution. First, in all the studied pedigree populations the percentage of consanguineous animals increased over time (Table 1; Figure 1), with βP values ranging from 1.4 to 7.7 %. Second, inbreeding levels exhibited negative trends (Table 1; Figure 2), with an average βF value of -0.412 across the ten pedigrees. Third, ARC levels have remained stable over time and within each pedigree (Figure 3). Genetic improvement strategies need to consider an adequate balance between selection intensity, inbreeding and genetic variability. The scenarios commonly observed in the evolution of F can be attributed to three general factors: use of related breeders within a numerically large population with low ARC levels; selection based on BLUP, which raises the probability of selection of related animals; and advances in reproductive technologies, which can reduce the number of parents needed to produce the next generation of breeders3,4,10.
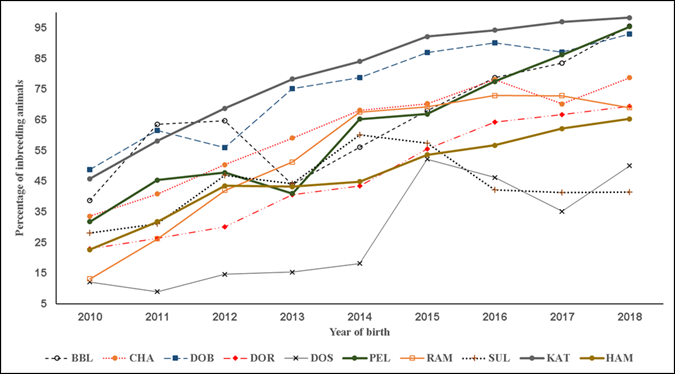
Figure 1 Trends of percentage of inbreeding individuals. Breeds: Blackbelly (BBL), Charollais (CHA), Dorper (DOR), White Dorper (DOB), Dorset (DOS), Hampshire (HAM), Katahdin (KAT), Pelibuey (PEL), Rambouillet (RAM) and Suffolk (SUF)
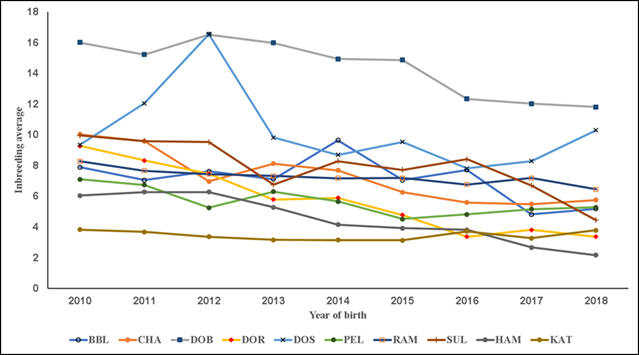
Figure 2 Trends in average inbreeding in the consanguineous population; inbreeding is defined as homozygosis levels in individuals caused by related progenitors. Breeds: Blackbelly (BBL), Charollais (CHA), Dorper (DOR), White Dorper (DOB), Dorset (DOS), Hampshire (HAM), Katahdin (KAT), Pelibuey (PEL), Rambouillet (RAM) and Suffolk (SUF).
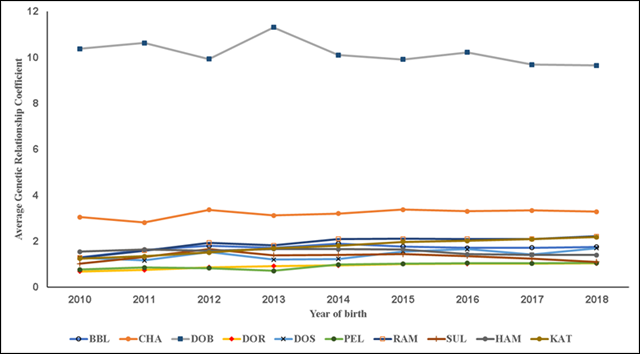
Figure 3 Trends of average additive genetic relatedness coefficient. Breeds: Blackbelly (BBL), Charollais (CHA), Dorper (DOR), White Dorper (DOB), Dorset (DOS), Hampshire (HAM), Katahdin (KAT), Pelibuey (PEL), Rambouillet (RAM) and Suffolk (SUF)
The KAT, PEL and RAM pedigree populations had the highest growth rates in consanguineous population (Table 1; Figure 1). The DOB and DOR pedigrees had the largest negative trends in F while DOB and CHA had the highest ARC values. The variation in the present results coincides with a diversity of F values reported elsewhere. For example, F values were near zero in a study of seven sheep populations in France29, but positive in a study of six breeds from Canada10. Positive trends in F and ARC have also been reported for the breeds Finnsheep30, Merino17 and Malpura18.
The concept of realized effective population size (Ne) was developed based on ideal population guidelines and is a basic concept in the design of genetic conservation and/or improvement programs. It reflects the accumulation of genetic relationships between individuals, making it possible to predict changes in F levels. In addition, it quantifies changes in genetic variance through genetic drift and changes in gene frequencies31. The breeding structure and reproductive demographics of the evaluated sheep populations differed from ideal population approaches, but, when applied, realized Ne tends to adjust for some of these differences32. Low Ne levels are associated with decreased genetic variability, increased crossing between related individuals, allele fixation and the greatest reduction in selection response33. A Ne value <50 is cause for concern; when developing pedigree populations, Ne values ≥50 are preferable since these imply the presence of more F levels ≤1%34. Even higher Ne values are recommended for populations subject to genetic improvement because these optimize selection response but with a minimal increase in F35. Six of the evaluated pedigree populations had Ne values between 50 and 73.5 (Table 3), indicating that any increases in F will be ≤1%. However, four populations had Ne values between 12.2 and 36.8, highlighting the need for close monitoring of F and ARC values, and their possible consequences in genetic improvement. The highest six Ne values in the present results are within previously reported ranges. In a report on forty sheep breeds evaluating Ne estimation methods the value range was 38 to 675, with a 191 average32. A series of studies evaluating the pedigree of a total of fifteen sheep populations found Ne estimates ranging from 55 to 27629,30,36,37.
The genetic relationships between founders and fe represent initial genetic variability, since the founders’ contribution to pedigree variability is the set of genes which has remained intact through generations38. The number of individuals explaining 50% of pedigree variability was 7 in DOB, 13 in CHA and 44 in SUF (Table 3). Low ancestor numbers explaining pedigree variability is associated with higher F and ARC values. The effective number of ancestors (fa) includes the possible causes of losses of genetic variability. In general, fe>fa; a wider discrepancy between them indicates that fewer founders are participating in the pedigree over the generations. The fe/fa ratio represents differential breeding management, considering any bottlenecks a population may have experienced. Higher ratio values indicate that most of the ancestors were founders, without bottlenecks39. In the present results the fe/fa ratio ranged from 1.2 to 2.0, a range which coincides with those reported for the breeds Baluchi16, Afshari40, Kermani36, Moghani37 and Morada Nova8.
The ARC can be seen as a summary of a population’s breeding management, while F represents the crossing of related animals but does not explain why these crosses occurred. In the relationship between fe and F, a founder’s ARC indicates the percentage of a population originating in her or him11. Use of the ARC allows design of crosses by maintaining certain levels of F in the progeny. In the present results ARC levels remained unchanged and F levels did not increase (Figures 2 and 3). However, over time the breed stock came from a small number of families, tended to be genetically related and was selected from within herds, with minimal interherd genetic flow (Figure 1).
Generational interval (GI) is vital in validating losses of genetic variability and genetic progress over time. Selection intensity, which is associated with SD% and D/S, tends to reduce the GI but produces losses in genetic variability given the minimal contribution of this breed stock to the population9,38. Average estimated GI in the present study was 3.45 yr with a 3.0 to 4.15 yr range, and no substantial differences between the four pairings (Table 4). The highest GI estimates were for the RAM and SUF pedigrees and the lowest for BBL and DOR. A study of seven sheep breeds in France reported an estimated average GI of 3.5 years and a range of 1.9 to 5.029; lower average GI values have been reported for Xalda sheep (2.9 yr)19 and Somali sheep (2.1 yr)41.
Table 4 Generational interval (GI) estimates (years) in ten sheep pedigrees in Mexico
| Breed | Father - son | Father - daughter | Mother - son | Mother - daughter | Mean |
|---|---|---|---|---|---|
| BBL | 3.15 | 3.12 | 3.06 | 3.02 | 3.09 |
| CHA | 3.77 | 3.64 | 3.55 | 3.29 | 3.56 |
| DOR | 3.04 | 3.13 | 3.02 | 3.08 | 3.07 |
| DOB | 3.70 | 3.55 | 3.00 | 3.30 | 3.39 |
| DOS | 3.28 | 3.69 | 3.97 | 3.79 | 3.68 |
| HAM | 3.23 | 3.33 | 3.31 | 3.64 | 3.37 |
| KAT | 3.47 | 3.25 | 3.53 | 3.29 | 3.38 |
| PEL | 3.31 | 3.09 | 3.46 | 3.36 | 3.30 |
| RAM | 3.55 | 4.15 | 3.89 | 4.06 | 3.91 |
| SUF | 3.86 | 3.59 | 3.84 | 3.58 | 3.71 |
| Mean | 3.44 | 3.45 | 3.46 | 3.44 |
Breeds: Blackbelly (BBL), Charollais (CHA), Dorper (DOR), White Dorper (DOB), Dorset (DOS), Hampshire (HAM), Katahdin (KAT), Pelibuey (PEL), Rambouillet (RAM) and Suffolk (SUF).
Conclusions and implications
The present pedigree evaluation represents a summary of the results of producers’ genetic and breeding management strategies. It is useful in designing genetic selection programs because it contemplates the relationship between selection response and increases in inbreeding, including their consequences. The trends did not differ greatly between the ten evaluated pedigree populations: inbreeding levels tended to decrease, with negative slopes (P<0.05); genetic relationships were stable over time; and the consanguineous population increased, with positive slopes (P<0.05). The KAT, PEL and RAM populations had high consanguineous population growth rates. Inbreeding was highest in the DOB and DOS populations, and genetic relationships were highest in DOB and CHA. Effective population size estimates were lowest in the BBL, CHA, DOB, and SUF populations, highlighting the need to monitor the evolution of inbreeding and its possible implications in these pedigrees.
Literatura citada
1. Partida de la PJA, Braña VD, Jiménez SH, Ríos RFG, Buendía RG. Producción de carne de ovina. Instituto Nacional de Investigaciones Forestales, Agrícolas y Pecuarias. Libro técnico No. 5. México. 2013. [ Links ]
2. Domínguez-Viveros J, Rodríguez-Almeida FA. Resumen de evaluaciones genéticas en ovinos. Catálogo de sementales de alto valor genético de doce razas. Organismo de la unidad nacional de ovinocultores. Universidad Autónoma de Chihuahua. Chihuahua, México. 2017. [ Links ]
3. Verrier E, Colleau J, Foulley JL. Long-term effects of selection based on the animal model BLUP in a finite population. Theo Applied Genet 1993;87:446-454. [ Links ]
4. Wu L, Schaeffer R. Reducing the effect of parent averages from animal solution in mixed model equations. J Anim Breed Genet 2000;117:361-374. [ Links ]
5. Ruiz-Flores A, García-Munguia CA, Núñez-Domínguez R, Ramírez-Valverde R, López-Ordaz R, García-Muñiz JG. Inclusión del coeficiente de consanguinidad en los modelos de evaluación genética de bovinos Jersey y Suizo Americano en México. Rev Mex Cienc Pecu 2011;2:381-391. [ Links ]
6. Selvaggi M, Dario C, Peretti V, Ciotola F, Carnicella D, Dario M. Inbreeding depression in Leccese sheep. Small Ruminant Res 2010;89:42-46. [ Links ]
7. Vostry L, Milerski M, Schmidova J, Vostra-Vydrova H. Genetic diversity and effects of inbreeding on litter size of the Romanov. Small Ruminant Res 2018;168:25-31. [ Links ]
8. McManus C, Facó O, Shiotsuki L, Jivago de PRJL, Peripolli V. Pedigree analysis of Brazilian Morada Nova hair sheep. Small Ruminant Res 2019;120:37-42. [ Links ]
9. Gutiérrez JP, Altarriba J, Diaz C, Quintanilla R, Cañón J, Piedrafita J. Pedigree analysis of eight Spanish beef cattle breeds. Genet Sel Evol 2003;35:43-64. [ Links ]
10. Stachowicz K, Brito LF, Oliveira HR, Miller SP, Schenkel FS. Assessing genetic diversity of various Canadian sheep breeds through pedigree analysis. Can J Anim Sci 2018;98:741-749. [ Links ]
11. Gutiérrez JP, Goyache F. A note on ENDOG: a computer program for analysis pedigri information. J Anim Breed Genet 2005;122:172-176. [ Links ]
12. Yavarifard R, Hossein-Zadeh NG, Shadparvar AA. Population genetic structure analysis and effect of inbreeding on body weights at different ages in Iranian Mehraban sheep. J Anim Sci Tech 2014;56:31-39. [ Links ]
13. Boldman KG, Kriese LA, Van Vleck DL, Van Tassell CP, Kachman SD. A Manual for use of MTDFREML. A set of programs to obtain estimates of variances and covariances (Draft). USDA. ARS. 1995. [ Links ]
14. SAS. SAS/STAT User's Guide (Release 9.0). Cary, NC, USA. SAS Inst. Inc. 2005. [ Links ]
15. James JW. A note on selection differentials and generation length when generations overlap. Animal Prod 1977;24:109-112. [ Links ]
16. Tahmoorespur M, Sheikhloo M. Pedigree analysis of the closed nucleus of Iranian Baluchi sheep. Small Ruminant Res 2011;99:1-6. [ Links ]
17. Gowane GR, Ashish C, Misra S, Prince LL. Genetic diversity of a nucleus flock of Malpura sheep through pedigree analyses. Small Ruminant Res 2014;120:35-41. [ Links ]
18. Gowane GR, Prakash V, Ashish C, Prince LL. Population structure and effect of inbreeding on lamb growth in Bharat Merino sheep. Small Ruminant Res 2013;114:72-79. [ Links ]
19. Goyache E, Gutiérrez JP, Fernández L, Gómez E, Álvarez I, Diez J, Royo LR. Using pedigree information to monitor genetic variability of endangered populations: the Xalda sheep of Asturias as an example. J Anim Breed Genet 2003;120:95-105. [ Links ]
20. Sheikhlou M, Abbasi MA. Genetic diversity of Iranian Lori-Bakhtiari sheep assessed by pedigree analysis. Small Ruminant Res 2016;141:99-105. [ Links ]
21. Gutiérrez JP, Cervantes I, Molina A, Varela M, Goyache F. Individual increase in inbreeding allows estimating realized effective sizes from pedigrees. Genet Sel Evol 2008;40:359-378. [ Links ]
22. Gutiérrez JP, Cervantes I, Goyache F. Improving the estimation of realized effective population sizes in farm animals. J Anim Breed Genet 2009;126:327-332. [ Links ]
23. Falconer DS, Mackay. TFC Introducción a la genética cuantitativa. Editorial Acribia. Zaragoza, España. 1996. [ Links ]
24. Venkataramanan R, Subramanian A, Sivaselvam SN, Sivakumar T, Sreekumar C, Iyue M. Effect of inbreeding and individual increase in inbreeding on growth in Nilagiri and Sandyno breeds of sheep. Animal Genetic Res 2016;58:63-71. [ Links ]
25. Teixeira NMR, Ferreira CJ, Souza CPL, Mendes MCH, Neves FHH. Parâmetros populacionais da raça ovina Santa Inês no Brasil. Pesq Agrop Bras 2013;48:1589-1595. [ Links ]
26. Eteqadi B, Hossein-Zadela NG, Ahad SA. Population structure and inbreeding effects on body weight traits of Guilan sheep in Iran. Small Ruminant Res 2014;119:45-51. [ Links ]
27. Bradford GE. The role of maternal effects in animal breeding. VII. Maternal effects in sheep. J Anim Sci 1972;35:1324-1334. [ Links ]
28. Gowane GR, Ashish C, Prakash V, Prince LL. The role of maternal effects in sheep breeding: a review. Indian J Small Rumin 2014;20:1-11. [ Links ]
29. Danchin-Burge C, Palhiere I, Francois D, Bibé B, Leroy G, Verrier E. Pedigree analysis of seven small French sheep populations and implications for the management of rare breeds. J Anim Sci 2010;88:505-516. [ Links ]
30. Li MH, Strandén I, Kantanen J. Genetic diversity and pedigree analysis of the Finnsheep breed. J Anim Sci 2009;87:1598-1605. [ Links ]
31. Crow JF, Kimura M. An introduction to population genetic theory. Haper & Row, New York, USA. 1970. [ Links ]
32. Leroy G, Mary-Huard T, Verrier E, Danvy S, Charvolin E, Danchin-Burge C. Methods to estimate effective population size using pedigree data: examples in dog, sheep, cattle and horse. Genet Sel Evol 2013;45:1-10. [ Links ]
33. Breda FC, Euclydes RF, Silva PC, Robledo de AT, Souza CPL, Rocha SJL, de Almeida TFR, França MAK. Endogamia e Limite de Seleção em Populações Selecionadas Obtidas por Simulação. Rev Brasil Zoot 2004;33:2017-2025. [ Links ]
34. FAO. Secondary guidelines for development of national farm animal genetic resources management plans: management of small populations at risk. Rome, Italy. 1998. [ Links ]
35. Meuwissen THE, Sonesson AK. Maximizing the response of selection with a predefined rate of inbreeding: overlapping generations. J Anim Sci 1998;76:2575-2583. [ Links ]
36. Mokhtari MS, Moradi SM, Esmailizadeh AK, Abdollahi-Arpanahi R, Gutiérrez JP. Genetic diversity in Kermani sheep assessed from pedigree analysis. Small Ruminant Res 2013;114:202-205. [ Links ]
37. Mokhtari MS, Miraei-Ashtiani SR, Jafaroghli M, Gutiérrez JP. Studying genetic diversity in Moghani sheep using pedigree analysis. J Agric Sci Tech 2015;17:1151-1160. [ Links ]
38. Biochard D, Maignel L, Verrier E. The value of using probabilities of gene origin to measure genetic variability in a population. Genet Select Evol 1997;29:5-23. [ Links ]
39. Barros EA, de A Brasil LH, Tejero JP, Delgado-Bermejo JV, Ribeiro MN. Population structure and genetic variability of the Segureña Sheep breed through pedigree analysis and inbreeding effects on growth traits. Small Rumianant Res 2017;149:128-133. [ Links ]
40. Ghafouri-Kesbi F. Using pedigree information to study genetic diversity and re-evaluating a selection program in an experimental flock of Afshari sheep. Arch Tierz 2012;55:375-384. [ Links ]
41. Paiva SR, Olivardo F, Faria DA, Lacerda T, Baretto GB, Carneiro PLS, Lobo RNB, McManus C. Molecular and pedigree analysis applied to conservation of animal genetic resources: the case of Brazilian Somali hair sheep. Trop Animal Health Prod 2011;43:1449-1457. [ Links ]
Received: July 17, 2019; Accepted: March 31, 2020
 Este es un artículo publicado en acceso abierto bajo una licencia Creative Commons
