text in
  English (pdf)
 Article in xml format
 Article references
 Send this article by e-mail
 Cited by SciELO
  Similars in
SciELO
Similars in
SciELO 
 Permalink
Introduction
Meat is a product that is highly susceptible to degradation due to its chemical composition, caused by factors such as storage temperature (chilling and freezing), modified atmospheres, microorganisms, among others. Pork is usually consumed as a main dish or in various by-products such as sausages, ripened and cooked. However, there is a need to extend its shelf life by applying conservation techniques that do not alter its properties, mainly the sensory one which is the most important for consumers1-3. With the increase in meat consumption in Mexico and its commercialization in places such as Asia, Europe, and South America, freezing storage in a chamber unit has been the most used method, because, among other factors, it is economical, control microbiological growth, and avoids enzymatic reactions and chemical deterioration. The method and the freezing rate are determinant for ice crystal formation (size and geometry); however, poor management of the process can cause damage to the meat fibers or develop important biochemical reactions such as proteolysis and lipid oxidation. The latter can irreversibly affects the physicochemical and functional properties of certain proteins such as: myofibrillar, sarcoplasmic, and connective4-6.
Myoglobin is the main protein responsible for the color in meat; it belongs to the group of sarcoplasmic proteins, which are soluble in water. Myoglobin consists of a single polypeptide chain (8 alpha helix) called globin, and a prosthetic heme group, with an iron atom at its center. Its molecular weight ranges between 14 to 18 kDa. Meat color is mainly influenced by the pigment content, and by the chemical form and structure of myoglobin. One of the factors which determine meat color is the iron oxidation status and the compounds (oxygen, water, or nitric oxide) bound to the molecule. The thermostability of this protein also depends on the chemical state, being the deoxymyoglobin (DMb) the more stable form to heat denaturation, followed by oxymyoglobin (OMb), and metmyoglobin (MMb). Therefore, the thermodynamics of the transformation reactions between DMb, OMb, and MMb are quite similar, with the exception of OMb to MMb transformation7.
This work aims to evaluate the changes that occur in the myoglobin oxidation state in pork muscle during freezing storage, and its effects on the various oxidative aspects that could affect the sensorial and quality characteristics of the system, such as the color profile and the thermal stability of the different chemical forms of myoglobin.
Material and methods
Sample preparation
Longissimus thoracis muscle was obtained from Pietrain male castrated pigs (6 mo of age), weighing approximately 110 ± 2 kg. The pigs were housed in a pen (4.9 × 2.0 m) with a concrete floor and a 0.5-m-wide slatted dunging area. Fed and water were offered ad libitum. The feeds used were manufactured by Nutricion Tecnica Animal S.A. de C.V. (Cuautitlan Izcalli, State of Mexico, Mexico). No antibiotics and other growth-promoting agents were added to the diets. Five pieces of muscle were obtained from the 9th to 13th rib section from which cuttings of 1 cm3 were refrigerated for 24 h after rigor mortis. Subsequently, samples were vacuum sealed using flexible low-density polyethylene films and frozen in a chamber (REVCO Ultima II, New Castle DE, USA) at -18 ± 2 °C for 24 h and then thawed at 4 ± 2 °C for 5 h in a typical chamber (Nieto, Mexico) with 70 % relative humidity. All experiments were carried out at UNAM-FES Cuautitlan, Multidisciplinary Research Unit L13 (Thermal and Structural Analysis of Materials and Foods).
Myoglobin was extracted following the methodology proposed by Warris8. Briefly, 5 g of meat was homogenized for 1 min in 40 mM potassium phosphate solution (pH=6.8) at 2 °C; afterwards, homogenizates were centrifuged at 50,000(g for 30 min at 5 °C in a K3 centrifuge (Centurion Scientific, UK) and the supernatant filtered through Whatman #1 filter paper.
Chemical analysis
The chemical analysis was conducted according to the methods proposed by the Association of Official Analytical Chemists9: moisture content (986.21), total ash (990.08), lipid (960.39), and protein (977.14). The pH was determined using the methodology described by Koniecko10, using a pH meter (HI99163, Hanna Instruments, RI, USA). In all cases, five repetitions were performed.
Color profile
The methodology described by the American Meat Science Association4 was employed using a CM600d reflectance spectrophotometer (Konica Minolta, Tokyo, Japan). The measurements conditions were: type A coupled illuminant (incandescent with tungsten filament at 2856 K), aperture size of 8 mm and an observation angle of 10°. The tri-stimulus values (L*, a*, and b*) were obtained according to the CieLab system using the software Spectra Magic NX™. The reflectance and absorbance phenomena were evaluated in the wavelength range from 400 to 700 nm. From the data, hue angle (°hue), chroma (C*), and the total color difference (ΔE*) were calculated11-14.
Surface myoglobin fraction
The quantification of the myoglobin fraction was made on the surface of the meat (perpendicular to the fibers), according to the recommendations of Tang et al15. The following equations were used:
Thermal analysis
Samples were analyzed using a differential scanning calorimeter with temperature modulation (DSC 2920, TA Instruments, New Castle DE, USA). Cooling was carried out using a refrigerated cooling system. The temperature and heat capacity calibrations were performed using TA Instruments software with indium (melting point value of 156.6 °C) and sapphire (aluminum oxide), respectively. The TA Instruments universal analysis software (2000V 4.5A) was used to register and analyze all thermograms. Samples (12 ± 0.53 mg) were packed down in hermetic aluminum pans and were analyzed in triplicate by heating in the modulated DSC furnace at a rate of 5 °C/min with temperature modulation of 0.8 °C every 60 sec Nitrogen was used as purge gas at a constant flow rate of 60 mL/min. Thermal decomposition data were collected over the temperature range of 20 to 90 °C6,16-18.
Activation energies (Ea)
The Ea required for protein denaturation was obtained using the methodology described by Coria et al11, Calzetta and Suarez19 and Cornillion20. The reaction order (n), the Arrhenius constant (Z), the degree of conversion (α), and the conversion rate (dα/dt) were also determined using the following expressions:
Where ΔHg is the enthalpy for each temperature in the transition zone (J g-1), and ΔHt is the total enthalpy (J g-1). To obtain the value of the unknown factors (Z, n and Ea), a multiple linear regression (MLR) analysis of eq .7 was performed.
FTIR-ATR Spectroscopy
The functional groups in the meat were further characterized using a Frontier SP8000 spectrophotometer (Perkin Elmer, Waltham, MA, USA) following the recommendations of Coria et al21. Briefly, samples were placed on top of the attenuated total reflection (ATR) crystal, and spectra were collected in the range of 400-4000 cm-1 at a resolution of 4 cm-1 by co-adding 32 scans. A background spectrum was obtained against air every day during the experiment.
Statistical analysis
The experiment was conducted as a completely randomized design (the experimental unit consisted of 25 cubes of 1 cm3 randomly taken from five Longissimus thoracis muscles). Experimental data were subjected to 1 and 2-way analysis of variance (ANOVA), and the means were separated using the Tukey test. A probability P<0.05 was used to distinguish significant differences employing the Minitab 16.0.1 software (Penn State University, Pennsylvania, USA). In multiple linear regression analysis, the Origin Pro 8 software (OriginLab Corp., Northampton, MA, USA) was utilized.
Results and discussion
Chemical analysis
The chemical composition of raw and thawed meat is shown in Table 1. Results are in close agreement to those reported by Meléndez et al6 and Karamucki et al22. There were significant differences in moisture content (P<0.05) between treatments. Due to the freezing process, large crystals were formed causing rupture in the meat fibers; consequently, in these samples some water was lost by exudation. Moreover, the loss of water in thawed samples had also an important effect in the decrease of ashes, but not in the protein and lipid contents, as previously reported by Karamucki et al22.
Table 1 Chemical composition for the raw and thawed meat
| Component | Raw | Thawed |
|---|---|---|
| Moisture | 75.30±1.19a | 74.86±0.46b |
| Proteins | 21.83±2.54a | 22.64±1.12a |
| Lipids | 1.87±0.09a | 1.96±0.20a |
| Ash | 1.0±0.03a | 0.54±0.11b |
Mean ± standard deviation
ab Means with a different letter in the same row are statistically different (P<0.05).
pH
There were significant differences (P<0.05) in the pH value in the frozen-thawed meat in comparison to raw meat, presenting values of 5.69 ± 0.08 and 5.63 ± 0.17, respectively. Therefore, it was confirmed that this conservation process produces important changes; among them, the modifications in the redox dynamics in the myoglobin due to a decrease in the formation of lactic acid from muscle glycogen by anaerobic glycogenolysis23. The latter, generates several inter-conversions that structurally alter the meat and, therefore, significant changes occurred in color appreciation, which lead to quality defects that results in the formation of PSE (pale, soft, and exudative) or DFD (dark, firm, and dry) meat24. According to Krzywicki25, reductions in pH values are usually accompanied by a diminution in light penetration depth and an increment in reflectance, which leads to an increase in luminosity (L*) and a decrement in the amount of the reduced form of myoglobin (DMb). At the same time, lower pH values are also associated with a greater susceptibility of the muscular pigments to oxygenation and oxidation and, consequently, the formation of greater amounts of OMb and MMb.
Color profile
The mean values of the color profile parameters are shown in Table 2. For raw meat, the values of L*, a* and b* are similar to those reported in other studies26-30. In general, the freeze-thaw process generates significant changes in the luminosity (L*) coordinate. Intra- and extracellular ice crystals have a molecular angle of 109.45° between hydrogen atoms31,32; this angle was different from that of liquid water (104.50°), generating ruptures in the meat fibers and some bonds, allowing exudates to exit. Moreover, the L* value depends on the total amount of light absorbed and reflected by the meat surface. Therefore, the impact of absorption and reflection on the appreciation of color luminosity varies depending on the pigment content in the tissue and its structure. It is well known that the relative content of the chemical form of the myoglobin on the meat surface also influences the L* coordinate22. The a* coordinate is usually correlated to a reddish coloration. In this research, the a* average value was slightly higher in the case of the thawed meat, which is attributed to the fact that the surface myoglobin underwent modifications when redox reactions were carried out by time effects in the freeze-thaw processes. The same phenomenon was observed in the b* coordinate. According to Lesiów and Xiong27 and Skrlep and Candek-Potokar30, the hue angle for pink and red meat should be in the range between 0 and 90°. In this research, the freeze-thaw process significantly affects the meat tone. Chroma values (C*) are consistent with those reported by other researchers(23, 30). Such differences in Chroma were statistically significant, indicating that changes in color saturation were not perceptible. The total color difference (ΔE*) between raw and frozen-thawed meat have an average value of 3.63 ± 0.68, indicating that the crystallization-melting process generates changes in the set of the three-color profile coordinates. However, according to the AMSA4 and Chmiel et al33, up to 5 units in the total color difference were not perceptible to the human eye.
Table 2 Color profile parameters in the CieLab system of raw and thawed meat
| Sample | L* | a* | b* | Hue angle | C* |
|---|---|---|---|---|---|
| Raw | 51.30±0.48a | 4.98±1.14a | 5.23±1.03a | 46.38±3.51a | 7.22±1.48a |
| Thawed | 50.91±1.75b | 5.39±0.90b | 7.91±0.94b | 55.76±5.20b | 9.57±0.98b |
Mean ± standard deviation.
ab Means with a different letter in the same column are different (P<0.05).
Figure 1-a shows the reflectance spectra of the raw and thawed meat, the characteristic band between 500 and 600 nm corresponds to myoglobin in its non-oxidized state4. It is also important to note that the differences among samples were significant (P<0.05). The thawed samples presented a certain quantity of exuded liquids, causing slightly lower reflectance values. Light plays an important role in color appreciation, since the phenomenon of paleness in PSE meat can be explained by the contraction of myofibrils due to low pH values, which increases the difference of refractive index and the reflectance at the meat surface34, opposite to the frozen-thawed meat. There are several theories that state that paleness is mainly originated from cold denaturation and precipitation of both myofibrillar and sarcoplasmic proteins6. In addition, myoglobin in PSE pork meat is very susceptible to cold denaturation, causing a small change in the helical structure, which contributes to a modification in its optical properties.

Surface myoglobin fraction
The absorbance spectra are also shown in Figure 1b. In general, samples with structural damage caused by the freeze-thaw processes presented strong absorption bands. This phenomenon was possible due to fiber ruptures by water crystallization. The above mentioned effect generates surface differences, reflected in changes in color profile parameters and visual appreciation4. Commonly, the absorbance for myoglobin in their different forms is found at 503, 525, 557 and 582 nm.
According to the values presented in Table 3, in the raw meat, the greater amount of myoglobin was found under the form of DMb, without perceptible alterations in its structure. The cooling process of the meat after slaughter had significant effects that modify the sarcoplasmic protein structure. In frozen-thawed samples, myoglobin was reduced into the MMb form in a higher extent. Heat treatment and the contact with the atmosphere increased the pH value causing differences between samples34. According to Cho and Choy35, the conformational stability of the myoglobin molecule is strongly affected by the attachment of the heme group to the polypeptide chain. Authors suggested that the structure of the iron atom is the main factor affecting the stability of this particular protein.
Table 3 Fraction of myoglobin molecules in pork meat
| Raw | Thawed | |
|---|---|---|
| Deoxymyoglobin | 0.3884±0.0023a | 0.3429±0.0006b |
| Oxymyoglobin | 0.2282±0.0021a | 0.2769±0.0018b |
| Metmyoglobin | 0.3843±0.0019a | 0.3760±0.0012b |
Mean ± standard deviation
ab Means with a different letter in the same row are different (P<0.05).
In the pH range of meat after slaughter, changes in the myofibrillar refractive index occurred; consequently, there were increments and decrements in reflectance. As the pH decreases, the absorbance changed inversely proportional to the reflectance. The strong intrinsic birefringence of myofibrils does not necessarily contribute to the reflectance and absorbance, but this phenomenon depends directly on the amount of water on the surface and the chemical status of the myoglobin molecule34,35.
Thermal analysis by MDSC
It has been reported that myoglobin has a denaturation temperature between 60 and 70 °C35-38. Figure 2 shows the thermogram of the heat flow and the specific heat (Cp) for the myoglobin extract. The transition observed was at an initial temperature (To) of 63.51 °C, the denaturation temperature (Tp) was 68.58 °C with an enthalpy (ΔH) value of 1.334 J g-1. There were notorious changes in Cp values, indicating that the process significantly modified the protein structure.

In the case of raw and frozen-thawed meat, the heat flow thermogram (Figure 3-a) shows the principal transitions of proteins. Significant differences between heat-flow values were observed. These endotherms are without exception associated with the phenomena of protein (myosin, actin, and myoglobin) denaturation6,17,39,40.

Figure 3 (a) Heat flow, (b) Derived heat flow as a function of the temperature of raw and thawed meat
In the heat flow derivative graphic (Figure 3-b), no significant changes occurred, thus, merely denaturation effects of myosin, actin, and sarcoplasmic proteins were observed. The values of To, Tp, and ΔH of each transition are summarized in Table 4. In general, the To value of he thawed meat was lower than the raw one. The ΔH value for protein denaturation was significantly different (P(0.05) between the raw and frozen-thawed meat samples. In the case of myoglobin, it was apparently unaffected in its native structure by the freeze-thaw process, but the small differences in both transition temperatures and denaturation enthalpies could be possibly due to the chemical transformation occurring in DMb in raw to MMb in the frozen-thawed meat.
Table 4 Temperatures (initial and maximum) and enthalpies of raw and thawed meat
| Raw | Thawed | ||
|---|---|---|---|
| Myosin | To (°C) | 50.09±2.53a | 48.12±1.88b |
| Tp (°C) | 55.07±1.98a | 53.38±2.01b | |
| ΔH (J g-1) | 0.16±0.05a | 0.26±0.03b | |
| Myoglobin | To (°C) | 59.75±1.34a | 59.36±1.55b |
| Tp (°C) | 65.34±3.43a | 64.49±2.26b | |
| ΔH (J g-1) | 0.25±0.04a | 0.24±0.06b | |
| Actin | To (°C) | 73.32±1.12a | 72.01±1.01ab |
| Tp (°C) | 77.88±1.28a | 76.59±1.46ab | |
| ΔH (J g-1) | 0.22±0.07a | 0.36±0.09b |
Mean ± standard deviation.
ab Means with a different letter in the same row are different (P<0.05).
In the case of the frozen-thawed meat, the MMb was found in its highest proportion (Table 3). Therefore, there was a reversible dissociation in both the heme and apoprotein groups, which is more feasible in this chemical form of myoglobin. Thus, the Tp of the myoglobin in thawed meat shifts to a lower temperature and the ΔH decreases, although the myoglobin was predominantly in the non-oxidized state (DMb). These results suggest that water molecules -before and after freezing- contribute to the conformational stability of the myoglobin molecule1. In this context, Chaijan et al1, Ledward37 and Atanasov and Mitova41 reported that the Tp value of the myoglobin is shifted to a lower temperature when MMb formation increases during meat refrigeration. Authors conclude that DMb was the most heat stable form, followed by OMb and MMb, respectively. Results are in accordance with those reported in this research. In the MDSC studies, structural changes in proteins can be obtained from the heat flow by means of the Cp value, which is calculated from the ratio of the modulated amplitude of the heat flow and the modulated amplitude of the discrete Fourier transform42. Thermograms for raw and thawed meat are shown in Figure 4. It can be noticed that similar changes in the protein structure occurred; however, these variations were only in magnitude.

Activation energies (Ea)
The activation energies required for protein denaturation were obtained by MLR analysis. The values for the myoglobin extract, raw meat, and thawed samples were 393.24 ± 2.14, 305.71 ± 3.74, and 327.89 ± 3.05 kJ mol-1, respectively. In general, the Ea showed significant variations attributable to several factors, including the concentration of the denatured and non-denatured proteins, as well as the structural modification of the proteins when subjected to the freezing process. In these conditions, conformational changes occurred, leading to a variation in the activation energy, which also influences the amount of soluble proteins, such as myoglobin. Moreover, variations in the Ea values could be also attributable to oxygenation reactions of myoglobin by air, as well as to the structural changes occurred from DMb to MMb. The structure of a protein is modified by the effects of redox reactions; generally, the MMb requires more energy and less temperature to initiate the denaturation process (Figures 3a and 4). Although the MMb is less thermostable; thus, more energy is required to cause conformational modifications.
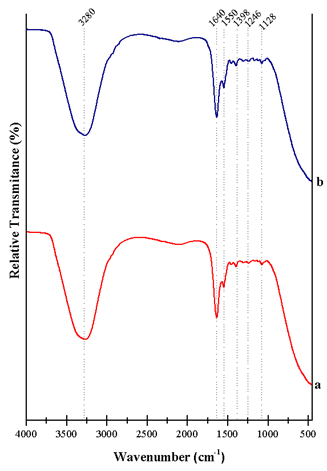
FTIR-ATR Spectroscopy
Figure 5 shows the FTIR-ATR spectra, which were collected in the range of 4000-400 cm-1. The characteristic band at around 3280 cm-1 is associated with the stretching vibrations of water molecules (OH-), and the NH vibration in secondary amides. Information about the biochemical changes occurring during the freeze-thaw process is provided in the range of 1750-1000 cm-1(43. The band at 1640 cm-1 indicates the presence of primary amides in the molecular structure of the α-helix in DMb. The band at 1,550 cm-1 was assigned to vibrations in secondary amides (stretching between CN) of the myoglobin molecule. This single band seems stronger in the case of thawed meat than the one observed in the raw meat, indicating a higher quantity of amide groups. Moreover, there was a stretching vibration mode of C-N amides at 1,398 cm-1. At 1,311 and 1,246 cm-1 there were C-N stretching in amines, mainly from myoglobin and myofibrillar proteins, and at 1,165 and 1,128 cm-1 there were vibrations of amines, amino acids, and the C-N stretching. These bands were more intense after the freeze-thawing processes because the existence of water molecules. Finally, there were important changes between the 1292-1371 cm-1 region, belonging to amines and tertiary amides of soluble proteins44,45.