


Serviços Personalizados
Journal
Artigo
 texto em
  Inglês (pdf)
 Artigo em XML
 Referências do artigo
 Enviar este artigo por email
Indicadores
-
 Citado por SciELO
 -
 Acessos
Links relacionados
-
 Similares em
SciELO
Similares em
SciELO
Compartilhar

 Permalink
Revista mexicana de ciencias pecuarias
versão On-line ISSN 2448-6698versão impressa ISSN 2007-1124
Rev. mex. de cienc. pecuarias vol.11 no.1 Mérida Jan./Mar. 2020 Epub 11-Jun-2020
https://doi.org/10.22319/rmcp.v11i1.4674
Technical notes
Growth dynamics and nutrient extraction curves of Pennisetum sp. (Maralfalfa)
a Instituto Tecnológico del Valle de Oaxaca, División de Estudios de Posgrado e Investigación. Programa de Maestría en Ciencias, Oaxaca, México.
b CIR Golfo Centro/INIFAP/SAGARPA. Campo experimental “La Posta”, Carretera La Tinaja-Paso del Toro, 94270 Medellín, Veracruz-Llave, México.
Mathematical models are useful in calculating forage nutrient concentration, nutrient extraction and growth curves. An analysis was done of growth and nutrient content in Pennisetum sp. (maralfalfa) applying Gompertz and Logistic models. Dilution curves for nitrogen, phosphorous and potassium (NPK) were generated using a negative potential model and maximum extraction values were calculated with a second order polynomial equation. Nutrient unitary extraction and nutrient recovery efficiency of NPK were also calculated. The goodness-of-fit models were compared using a completely randomized design with a 2 x 2 factorial arrangement, in which factor A was the two models and factor B was the real-world assay (fertilized treatment vs. control). Nutrient concentration curves were optimized with the Levenberg-Marquart algorithm. Both models’ goodness-of-fit were similar among the study plots, although the Gompertz model better represented biological reality. Maximum growth rate was reached at 21 d after sowing in the control plots and at 56 d in the fertilized plots. The inflection point was reached at 30 ds in the control plots and at 31 d in the fertilized plots. Nutrient concentration decreased over time in both the treatment and control, and dry matter production was highest in the fertilized treatment. Aside from calcium and magnesium, nutrient unitary extraction did not differ between the treatment and control. Nutrient recovery efficiency was 48 % for nitrogen, 39% for phosphorous and 104 % for potassium, suggesting excess nutrient levels.
Key words Gompertz; Logistics; Growth rate; Nutrient dilution
El crecimiento de una especie, así como la concentración y extracción de nutrientes en el forraje, se pueden conocer a través de modelos matemáticos. Se utilizaron las ecuaciones de Gompertz y Logistic para estudiar el crecimiento, un modelo potencial negativo para las curvas de dilución NPK y la extracción máxima a través de polinomios de segundo orden. Se calculó la Extracción Unitaria (EU) y Eficiencia de Recuperación del Nutriente (ERN) NPK. La bondad de ajuste de los modelos fue comparada bajo un diseño completamente al azar con arreglo factorial 2×2, factor A: dos modelos y factor B: fertilización y testigo con 16 repeticiones. La concentración de nutrientes se optimizó por algoritmo de Levenberg-Marquart. Los resultados indicaron que el ajuste del modelo fue similar para las parcelas en estudio; sin embargo, Gompertz mostró una mejor representación de la realidad biológica. La máxima tasa de crecimiento se alcanzó a los 21 días en parcelas testigo y 56 días en parcelas fertilizadas, el punto de inflexión a los 30 y 31 días, respectivamente. La concentración de nutrientes en el pasto, disminuyó a través de los cortes en ambos tratamientos y las parcelas fertilizadas además presentaron la mayor producción de materia seca. La EU se mostró casi de manera homogénea para parcelas fertilizadas y no fertilizadas. La ERN fue de 48 % para nitrógeno, 39 % para fósforo y 104 % para potasio, lo cual sugiere un suministro excedido de N y P con la dosis suministrada y un consumo de lujo para K.
Palabras clave Dilución de nutrientes; Gompertz; Logistic; Tasa de crecimiento
Continuous forage production is the greatest challenge in meeting feeding needs in beef and dairy cattle production systems1. Small and medium livestock producers in the tropics face chronic forage shortages caused by droughts and inadequate management practices2,3. Harvested forages cultivated on lands with productive potential are fundamental to reducing the production costs of feeding cattle4. Moreover, they require less area for forage production and therefore have a relatively lower impact on ecosystems transformed by increasingly intense livestock development3. Sustainable livestock production can be difficult, and continuous production forages are vital to its success. If a forage species is known to be productive further data is needed on its growth rate and basic reference parameters to facilitate effective management decisions and increase harvest efficiency5,6, as well as to guarantee expression of its maximum productive potential.
Due to their rapid growth and high production volume the forage grasses Pennisetum spp. can be used in intensive harvest systems7,8. Maximizing Pennisetum spp. production can benefit from mathematical models that estimate a specific species’ moment of maximum biological production and nutrient extraction (primarily NPK). This information assists in planning optimum time of harvest and fertilizer application, and minimizing environmental impacts.
Improving forage yields has been associated with soil nutrient contribution, which increases crop nutritional value and crop production9, as well as sufficient accumulation of heat units and adequate water supply to take full advantage of a forage species’ productive potential10.
The present study had two objectives. The first was to describe growth in Pennisetum sp. (ecotype maralfalfa) during the rainy season in a control (unfertilized) and fertilized treatment, and using the Gompertz and Logistic models. The second was to model the nutrient extraction and dilution curves, and calculate unitary extraction (UE) and nutrient recovery efficiency (NRE) for nitrogen (N), phosphorus (P) and potassium (K) to determine proper fertilizer load for the next production cycle.
A Pennisetum sp. (maralfalfa) pasture was established under seasonal conditions in July 2010 to January 2011 at the La Posta Experimental Field, in Paso del Toro, in the state of Veracruz, Mexico (19º00'49" N; 96º08'19" W). Located at 10 m asl11, regional climate is sub-humid tropical (Aw2 in Köppen climate classification)12. Accumulated rainfall during the six-month study period was 1,461 mm, average relative humidity was 77.4%, and average temperature was 25 °C (maximum = 35 °C; minimum = 15 °C). Soils at the experimental field are predominantly deep Vertisol type soils with acidic pH (5.4), a clay-sandy friable texture and 2.6% organic matter content13. Experimental unit area was 4.0 x 12.0 m (48 m2). It was planted in furrows 0.80 m apart with 0.80 m between plants, following a completely random block design with 16 replicates. In the fertilization treatment a 141-43-20 (N-P-K) dose was applied using 200 kg urea, 50 kg of 18-46-00 mixture and 200 kg of 20-10-10 mixture. This was applied in two applications: the first (8 days post standardizing cut) included 100 kg urea, 100 kg 20-10-10 mixture and 25 kg 18-46-00 mixture; the second (60 days later) included all the remaining N, P and K14.
The grass was harvested every 21 d at 25 cm above ground level, with a total of eight cuts and a study period of 168 days. In each sampling, fresh matter (FM) production per plot was recorded. A 300 g subsample was collected from the FM, dried in a forced air oven at 55 °C to constant weight, and dry matter (DM) content estimated with a correction at 105 °C15. The samples were milled (Thomas Wiley, model 3383L40) to a 1 mm particle size for NPK and chemical analyzes. Using the accumulated DM weights, the curve and growth rate were calculated with Equation 1.
Where: GR= growth rate kg DM ha-1 d-1; DMPt2= dry matter production at time 2, kg DM ha-1; DMPt= dry matter production at time 1, kg DM ha-1; T2= final time, T1= initial time.
The growth curves were created with the Gompertz16 and Logistic17 models, using the Micromath Scientist software (Micromath Research, 2006), and applying the Powell algorithm as the minimization method. The Gompertz function used was:
Where Y= yield, A= maximum production, -B= inflection point, µ= growth rate, and x= time in days. The Logistic function used was:
Where P= production, A= maximum production, B= inflection point, c= growth rate18.
Forage N content was calculated with the Kjeldhal method (VELP Scientifica, Series D-K6, USA), using 0.5 g samples in triplicate per whole plant. Phosphorous was quantified with ammonium vanadate in a UV-visible spectrophotometer (UV/VIS Lambda 2, Perkin Elmer, USA). Potassium, calcium and magnesium were measured by atomic absorption, while sulpher was measured with the turbidimetric method using barium sulfate in a UV/VIS spectrophotometer19. Comparison of nutritional NPK content in the forage samples at the different harvests was done with Equation 4 20.
Where a= critical concentration of nutrient in plant, x= DM production, -B= decrease (dilution) rate of nutrient in plant, calculated using the Levenberg-Marquart logarithm for minimizing variance.
Each nutrient’s unitary extraction (UE) was estimated based on the nutritional composition of each nutrient (N, P, K) in the grass species. It was calculated with Equation 5 21.
Where: UE= unitary extraction or efficiency of nutrient in the fertilizer, FY= forage yield (kg ha-1), and NAF= nutrient applied via fertilizer (kg ha-1).
Calculation of NPK nutrient recovery efficiency (NRE) was done with Equation 6 22:
Where: NRE= nutrient recovery efficient, NT= plant nutrient content (N, P or K) in treatment; Ncontrol = plant nutrient content (N, P or K) in control, and Dose in trat = nutrient dose applied in fertilizer (NPK). The NT and Ncontrol were calculated from the derivative of each fitted polynomial, for maximum NPK extraction.
The goodness-of-fit indicators in the Gompertz and Logistic models were R2, adjusted R2, r23, and the model selection criterium (MSC)24. For the coefficients A, B, C and µ, an analysis of variance (ANOVA) was applied to NRE using the GLM procedure (SAS ver. 9.01), and a comparison of means was done with the Duncan method (α=0.05)25.
The Gompertz model better represented the biological reality at the inflection point (B) for the treatment and the control plots. Maximum DM yield was 10,414 kg DM ha-1 in the treatment plots at 161 d, and 5,952 kg DM ha-1 in the control plots at 168 days (Table 1). Growth rate rose continually in the fertilized plots up to 56 d, with an inflection point at 31 d (Figure 1a). In the control plots, maximum growth rate occurred at 21 d and then descended thereafter, with an inflection point at 30 d (Figure 1b). This growth behavior for maralfalfa grass is similar to other tropical grass species26, with a sigmoid curve until reaching maximum expression followed by an asymptotic decrease. This behavior indicates a reasonable fit of the Gompertz model data to the biological reality represented in the curve; the resulting parameters provide trustworthy information on growth18.
Table 1 Goodness-of-fit indicators and Gompertz model coefficients for maralfalfa ecotype grass fertilization treatment (a), and control (b) during rainy season
| Indicators/coefficients | Treatment | Control |
|---|---|---|
| R2 | 0.98 ± 0.004 a | 0.98 ± 0.004 a |
| R2adj | 0.87 ± 0.028 a | 0.84 ± 0.046 a |
| r | 0.93 ± 0.015 a | 0.92 ± 0.025 a |
| MSC | 1.54 ± 0.262 a | 1.44 ± 0.378 a |
| A Maximum yield (kg ha-1) | 10,414 ± 2,254.57 a | 5,952± 2,684.75 b |
| B Inflection point (days) | 31.12 ± 7.094 a | 29.62 ± 15.946 a |
| µ Growth rate (kg DM ha-1day-1) | 43 ± 0.68 a | 31 ± 0.54 b |
ab Different letter suffixes in the same row indicate significant difference (Duncan= 0.05).
± standard error
R2= determination coefficient, R2adj= adjusted R2,
r= coefficient of correlation, MSC= model selection criterium.
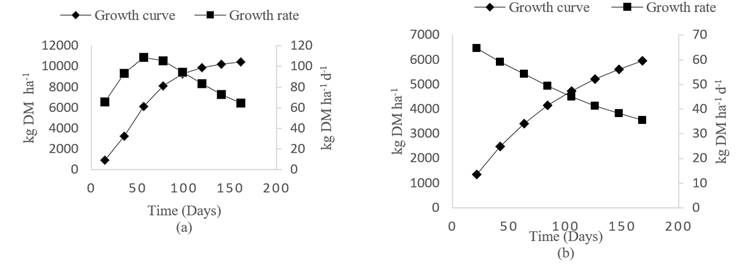
Figure 1 Fitted growth curve and rate (Gompertz), maralfalfa ecotype grass fertilization treatment (a), and control (b) during rainy season
The low forage yields in the control treatment are related to the low availability of nutrients in the soil27. At 56 d, fertilized Pennisetum OM-22 varieties have reported yields of 7 t DM ha-123, higher than the 6.1 t ha-1 produced at 56 d harvest in the present study. This is the maximum expressed potential yield based on the physiological processes of photosynthesis, heat unit accumulation, water absorption, nutrient availability and growth10. At this yield a forage is optimally utilized, avoiding losses in total biomass due to senescence and decomposition9.
Average nutrient concentrations in the fertilization treatment were 1.06 % for N, 0.20 % for P and 2.35 % for K, whereas in the control they were 0.79 % for N, 0.21% for P and 2.30 % for K (P>0.05). Of note is that the greater availability of nutrients in the soil due to fertilization continued for a longer time which resulted in higher accumulated DM. The growth rate (μ in Equation 2) was also higher in the fertilization treatment, translating into higher yields per units of time and space, a phenomenon reported in other crops and forages with higher protein levels than Pennisetum sp.5,28,29. However, maximum production did not coincide with the highest forage nutritional values. Rectifying this mismatch requires monitoring on the part of maralfalfa producers to determine at what point between 30 and 56 d to harvest the grass to attain both the best possible quality grass and maximum production. This is vital to producing the most nutritious possible livestock feed since N content decreases in maralfalfa even over 30 d29,30. Phosphorus and potassium levels behave in the same way, and these gradual decreases in chemical composition slowly reduce nutritional quality29,30.
Maximum nutrient extraction levels in the control were 30 kg ha-1 at 107 d for N, 10 kg ha-1 at 110 d for P, and 110 kg ha-1 at 120 d (Fig. 2a). Levels were substantially higher in the fertilization treatment with 68 kg ha-1 at 98 d for N, 17 kg ha-1 at 115 d P, and 208 kg ha-1 at 116 d K (Figure 2b). Unitary extraction (UE) did not differ between the treatment and the control. In the control (5,952 t DM ha-1) average total UE was 27.49 kg N, 10.05 kg P, and 116.0 kg K over 168 d. In the fertilization treatment estimated UE per ton DM was 4.72 kg N, 1.29 kg P, and 15.90 kg K. Average total extraction for the treatment (10,414 t DM ha-1) was 49.15 kg N, 13.43 kg P and 165.58 kg K over 161 d. Nutrient recovery efficiency (NRE) values were 48 % for N, 39 % for P and 104% for K. These indicate the amount of each nutrient required by the maralfalfa grass during the study period. Using the cumulative production of 58,205 t ha-1 at 161 d for the treatment, and applying the approach of Volke et al31 for fertilized forage crops, the calculations for the recommended fertilization levels for the next cycle would be 45-09-48 kg ha-1 (NPK).

Figure 2 NPK extraction curves (quadratic model) for maralfalfa ecotype grass (Pennisetum sp.) during rainy season for fertilization treatment (a) and control (b)
Excess soil N and K contents caused by fertilization is known to decrease the NRE of these nutrients32,33. This may lead to loss of N, consequent soil contamination, and excess K uptake33, a common situation faced by forage producers. Fertilization dose therefore needs to be adjusted based on a nutritional balance between crop nutrient demand, soil nutrient supply and nutrient recovery efficiency31. In the present study fertilization directly affected DM production and forage NPK content, although NRE was lower for N and P, suggesting that the fertilization dose utilized exceeded the required supply of these nutrients.
Under the studied local climatic conditions (rainy season) the maralfalfa ecotype took advantage of the nutrient supply provided by fertilization, doubling its growth rate in the first 60 d. Considering this behavior and with the goal of attaining the best quality forage, the first harvest would best be done before 56 d, when maralfalfa grass reaches its maximum growth rate. If a higher NPK concentration is desired in the harvested forage the harvest should be done at between 30- and 35-days’ regrowth in successive harvests. The observed forage NPK levels suggest that fertilizer dose should be adjusted downwards in the following production cycle. Understanding the productive behavior of maralfalfa grass in terms of nutrient extraction would facilitate more accurate fertilizer management, increase crop nutrient recovery efficiency and determine the most opportune moment for fertilization; all these measures could help to reduce potentially polluting nutrient surpluses, particularly of N.
Literatura citada:
1. Ramírez JL, Herrera RS, Leonard I, Cisneros M, Vardecia D, Álvarez Y. Relación entre factores climáticos, rendimiento y calidad de Pennisetum purpureum vc. Cuba CT 169 en el Valle del Cauto, Cuba. Rev Cubana Cien Agríc 2011;45(3):293-297. [ Links ]
2. Ortiz EE, Rodríguez JC, Russo RO. Efecto de fertilización y frecuencia de corte en rendimiento de biomasa de dos variedades del pasto king grass (Pennisetum purpureum). Tierra Tropical 2010;(6):43-53. [ Links ]
3. Steinfeld H, Gerber P, Wassenaar T, Castel V, Rosales M, De-Haan C (2009). La larga sombra del ganado: problemas ambientales y opciones. FAO. Roma. http://www.fao.org/3/a-a0701s.pdf . Consultado 7 Sep, 2017. [ Links ]
4. Márquez F, Sánchez J, Urbano D, Dávila C. Evaluación de la frecuencia de corte y tipos de fertilización sobre tres genotipos de pasto elefante (Pennisetum purpureum). 1. Rendimiento y contenido de proteína. Zootec Trop 2007;25(4): 253-259. [ Links ]
5. Rodríguez L, Larduet R, Martínez RO, Torres V, Herrera M, Medina Y, Noda AC. Modelación de la dinámica de acumulación de biomasa en Pennisetum purpureum vc. king grass en el occidente de Cuba. Rev Cubana Cien Agríc 2013;47(2):119-124. [ Links ]
6. Valenciaga D, Chongo B, Herrera RS, Torres V, Oramas A, Cairo JG, Herrera M. Efecto de la edad de rebrote en la composición química de Pennisetum purpureum vc. Cuba CT-115. Rev Cubana Cienc Agríc 2009;43(1)73-79. [ Links ]
7. Calzada-Marín JM, Enríquez-Quiroz JF, Hernández-Garay A, Ortega-Jiménez E, Mendoza-Pedroza SI. Análisis de crecimiento del pasto Maralfalfa (Pennisetum sp.) en clima cálido subhúmedo. Rev Mex Cienc Pecu 2014;5(2):247-260. [ Links ]
8. Wagner B, Colón R. Comportamiento forrajero de tres Pennisetum purpureum Schumach. Revista APF 2014;3(1): 61-66. [ Links ]
9. De Caram GA, Angeloni P, Prause J. Determinación de la curva de dilución de nitrógeno en diferentes fases fenológicas del girasol. Agric Téc (Chile) 2007;67(2):189-195. [ Links ]
10. Colabelli MR, Agnusdei MG, Durand JL. Grupos funcionales de plantas, producción de forraje y eficiencia de uso de radiación de pastizales naturales en condiciones potenciales y limitadas de agua y nitrógeno. RIA (Argentina) 2011;(37):62-74. [ Links ]
11. INEGI (Instituto Nacional de Estadística y Geografía) . Catálogo de claves de entidades federativas, municipios y localidades. 2009. http://mapserver.inegi.org. mx/mgn2k/?s=geo&c=1223. 23 Jun Consultado, 2016. [ Links ]
12. Vidal ZR. Las Regiones Climáticas de México. Colección: Temas Selectos de Geografía de México. UNAM. México. 2005. [ Links ]
13. CIR Golfo Centro / INIFAP/SAGARPA. Campo experimental “La Posta”. Caracterización y resultados de análisis de suelo en el Laboratorio de Suelos. Paso del Toro, Veracruz. 2011. [ Links ]
14. Ramos-Trejo OS, Victoria-Graniel CA, Sandoval-Gío JJ. Temporada, fertilización y rendimiento de variedades de Pennisetum purpureum. Agrociencia 2014;49(8):837-844. [ Links ]
15. AOAC. Official methods of analysis. Association of Official Analytical Chemists. 15th. ed, Washington DC, USA. 1980. [ Links ]
16. Raji AO, Alade NK, Duwa H. Estimation of model parameters of the japanese quail growth curve using Gompertz model. Arch Zootec 2014;63(243):429-435. [ Links ]
17. García- Cardozo CR, Martínez RO, Tuero R, Cruz AM, Estanquero L, Noda, AC, et al. Evaluación de Panicum maximum vc, Mombaza y modelación de indicadores agronómicos durante tres años en un suelo ferralítico rojo típico de la provincia la Habana. Rev Cubana Cien Agríc 2009;43(3):297-306. [ Links ]
18. Casas AG, Rodríguez D, Afanador TG. Propiedades matemáticas del modelo Gompertz y su aplicación al crecimiento de los cerdos. Rev Colomb Cienc Pecu 2010;(23):349-358. [ Links ]
19. Rodríguez-Fuentes H, Rodriguez-Absi J. Métodos de análisis de suelo y plantas. México: Editorial Trillas SA de CV; 2011. [ Links ]
20. Juárez-Hernández J, Bolaños-Aguilar ED. Las curvas de dilución de la proteína como alternativa para la evaluación de pastos tropicales. Uciencia 2007;23(1):81-90. [ Links ]
21. Castro-Luna I, Gavi-Reyes F, Peña-Cabriales JJ, Núñez-Escobar R, Etchevers-Barra JD. Eficiencia de recuperación de N y K de tres fertilizantes de lenta liberación. Terra Latinoamericana 2006;24(2): 77-282. [ Links ]
22. Mora-Ravelo SG, Gavi-Reyes F, Tijerina-Chávez L, Pérez-Moreno J, Peña-Cabriales JJ. Evaluación de la recuperación del nitrógeno y fósforo de diferentes fuentes de fertilizantes por el cultivo de trigo irrigado con aguas residuales y de pozo. Acta Agronómica 2014;63(1):25-30. [ Links ]
23. Martínez RO , Tuero R , Torres V, Herrera RS. Modelos de acumulación de biomasa y calidad en las variedades de hierba elefante, Cuba CT-169, OM-22 y King Grass durante la estación lluviosa en el occidente de Cuba. Rev Cubana Cien Agríc 2010;44(2):189-194. [ Links ]
24. Phaechamud T, Thongpin C, Choncheewa C. Shellac Wax-Lutrol F127 as Matrix Base for Hot Melt Extrusion. Res J Pharm Biol Chem Sci 2012;3(4):687-694. https://www.rjpbcs.com/pdf/2012_3(4)/[74].pdf [ Links ]
25. Steel RGD, Torrie JH. Bioestadística: principios y procedimientos. 2ª ed en español. Editorial McGraw-Hill México ;1996. [ Links ]
26. Rodríguez L, Torres V, Martínez RO, Jay O, Noda AC, Herrera M. Modelos para estimar la dinámica de crecimiento de Pennisetum purpureum vc. Cuba CT-169. Rev Cubana Cien Agríc 2011;45(4):349-354. [ Links ]
27. Escudero A, Mediavilla S. Dinámica interna de los nutrientes. Ecosistemas 2003;(1):1-8. [ Links ]
28. Crespo G, Álvarez J. Comparación de la producción de biomasa de clones de Pennisetum purpureum fertilizados con nitrógeno. Rev Cubana Cien Agríc 2014;(3):287-291. [ Links ]
29. Cerdas-Ramírez R. Comportamiento productivo del pasto Maralfalfa (Pennisetum sp.) con varias dosis de fertilización nitrogenada. InterSedes 2015;16(33):124-145. [ Links ]
30. Uvidia H, Ramírez J, Vargas J, Leonard I, Sucoshañay J. Rendimiento y calidad del Pennisetum purpureum vc Maralfalfa en la Amazonía ecuatoriana. Red Vet 2015;16(6)1-11. [ Links ]
31. Volke HV, Etchevers BJD, San Juan RA, Silva PT. Modelo de balance nutrimental para la generación de recomendaciones de fertilización para cultivos. Terra Latinoamericana 1998;16(1):79-91. [ Links ]
32. Cabalceta G, Saldias M, Alvarado A. Absorción de nutrimentos en el cultivar de papa MNF-80. Agronomía Costarricense 2005;29(3):107-123 [ Links ]
33. Puentes-Páramo Y, Menjivar-Flores J, Aranzazu-Hernández F. Eficiencias en el uso de nitrógeno, fósforo y potasio en clones de cacao (Theobroma cacao L.). Bioagro 2014;26(2):99-106. [ Links ]
Received: October 23, 2017; Accepted: December 14, 2018
 Este es un artículo publicado en acceso abierto bajo una licencia
Creative Commons
Este es un artículo publicado en acceso abierto bajo una licencia
Creative Commons
