


Servicios Personalizados
Revista
Articulo
 texto en
  Inglés (pdf)
 Artículo en XML
 Referencias del artículo
 Enviar artículo por email
Indicadores
-
 Citado por SciELO
 -
 Accesos
Links relacionados
-
 Similares en
SciELO
Similares en
SciELO
Compartir

 Permalink
Revista mexicana de ciencias pecuarias
versión On-line ISSN 2448-6698versión impresa ISSN 2007-1124
Rev. mex. de cienc. pecuarias vol.11 no.1 Mérida ene./mar. 2020 Epub 11-Jun-2020
https://doi.org/10.22319/rmcp.v11i1.4902
Articles
Technical and environmental characterization of very small, small, medium and large cow-calf operations in Colombia
a Centro Internacional de Agricultura Tropical (CIAT), Km 17 recta Cali - Palmira, Valle del Cauca, Colombia, (0574) 4450000.
b Universidad de Antioquia, Medellín, Colombia.
c Compañía Nacional de Chocolates, Rionegro, Antioquia, Colombia.
d Universidad Nacional de Colombia. Facultad de Ciencias Agrarias- Sede Medellín.
e Federación Colombiana de Ganaderos, Fedegán, Bogotá D.C, Colombia.
In Colombia, cow-calf operations account for 18.5% of the national livestock inventory and are a vital link in the national beef production chain. A lack of information has limited adequate technical and environmental planning of cow-calf systems. Based on technical and environmental parameters, a characterization of cow-calf operations was done for very small, small, medium and large producers in Colombia. Analyses were done using data from the Ganadería Colombiana Sostenible (GCS) and LivestockPlus (L+) projects, encompassing information for 2,618 farms classified by production emphasis. A total of 251 cow-calf operations were selected from this total and classified based on herd size into very small (1 to 30 head), small (31 to 50 head), medium (51 to 250 head), and large producers (≥251 head). Numerical and categorical variables were grouped within five components: (1) general information; (2) herd composition and management; (3) pasture management; (4) productive and reproductive information; and (5) environmental information. Each component was analyzed by Factorial Analysis for Mixed Data (FAMD), which showed that in the first four components variable distribution was spatially separated from the centroid in each producer category. Medium and large producers were associated with better infrastructure, machinery, equipment, reproductive and productive practices and parameters. No separation from the centroid was present for variables in the environmental information component highlighting a lack of difference in environmental practices among the producer categories. The present characterization can be used to design and implement public policy aimed at technological development and environmental management in Colombia’s livestock sector.
Key words FAMD; Colombian livestock; Environmental impacts; Public policy; Production systems
En Colombia, la cría bovina representa 18.5 % del inventario ganadero y es un eslabón importante en la cadena de producción de carne. La carencia de estudios de caracterización de sistemas de cría limita la planificación técnica y ambiental de esta actividad productiva. El objetivo de este estudio fue caracterizar los parámetros técnicos y ambientales de fincas de cría, pertenecientes a muy pequeños (MPG), pequeños (PG), medianos (MG) y grandes productores (GG). La información se obtuvo de los proyectos Ganadería Colombiana Sostenible y LivestockPlus, cuya muestra total fueron 2,618 fincas, clasificadas de acuerdo con su orientación productiva. De ésas, se estratificaron 251 fincas con orientación de cría en MPG (1 a 30 bovinos), PG (31 a 50), MG (51 a 250) y GG (más de 251). Se consideraron variables numéricas y categóricas distribuidas en cinco componentes: (1) información general, (2) composición y manejo del hato, (3) manejo de potreros, (4) información productiva y reproductiva e (5) información ambiental. Cada componente se analizó mediante un Análisis Factorial para Datos Mixtos (AFDM). De acuerdo con el AFDM de los primeros cuatro componentes, la distribución de las variables condujo a una separación espacial del centroide de cada categoría de ganaderos. Los MG y GG contaron con mejor infraestructura, maquinaria y equipos, y mejores prácticas y parámetros reproductivos y productivos. No existieron diferencias entre categorías en el desarrollo de prácticas ambientales. Las características identificadas pueden servir para el establecimiento de políticas públicas de desarrollo tecnológico y gestión ambiental.
Palabras clave AFDM; Ganadería colombiana; Impactos ambientales; Políticas públicas; Producción ganadera
Introduction
Colombia ranks fourth in Latin America in terms of cattle population1. In 2018 the country’s cattle population was 26,413,227 animals2, 45.7 % of which was involved in beef production, 39.3 % in dual-purpose systems and 15.0 % in dairy3. Nationwide, 514,794 farms were engaged in cattle production, of which 412,829 (80.2 %) had less than 50 heads and were mainly focused on dairy and meat production2. In the five years from 2014 to 2018 national milk production averaged 6.816 million liters yr-1, while average meat production in carcass for the same period was 926,858 t yr-1(4.
The beef production chain in Colombia consists of ranches focusing on cow-calf and growth, finishing and complete cycle. Cow-calf operations account for 18.5 % of the national livestock population and 40.5 % of the total beef production chain3. Six departments account for the largest number of animals in beef production: Casanare, Meta, Antioquia, Santander, Córdoba and Tolima3. Beef cattle production in Colombia is normally done using extensive systems, with low productivity levels and a largely static national population in recent years2.
Cow-calf operations are vital to meat production, highlighting the need to identify solutions to limitations in production. Industry characterizations help to identify production system strengths and weaknesses in technical, productive, reproductive and environmental aspects5. Ideally, they help to promote establishment of good livestock production practices and develop technological strategies for increasing productivity and reducing negative environmental impacts.
Greater understanding of production system characteristics can be applied to establish policies that promote and develop livestock production in Colombia. It can also guide implementation of the Nationally Appropriate Mitigation Action (NAMA) in Colombia. This in turn can support attainment of this sector’s mitigation goals as established in the “Intended Nationally Determined Contribution” (INDC) submitted to the United Nations Framework Commission on Climate Change in 20156.
The very few cattle production system characterizations done to date in Colombia have focused on dual-purpose and dairy systems in just a few departments7. In contrast, only one characterization of cow-calf production systems has been done, meaning there is still not enough data to plan this activity on a national level. The present study is a characterization of the technical and environmental parameters of cow-calf operations operated by very small, small, medium and large producers distributed in thirteen departments in Colombia.
Material and methods
Sample population
Data for this characterization was obtained from the Sustainable Colombian Cattle Ranching (Ganadería Colombiana Sostenible - GCS) and LivestockPlus (L+) projects. The GCS project consists of 2,011 surveys administered on livestock farms with different production focuses: cow-calf, finishing, dual-purpose, specialized dairy and complete cycle. Selection of the surveyed areas prioritized livestock regions deemed important in terms of environmental attributes, the existence of ecosystems of global importance and proximity of protected areas and significant livestock production areas. The surveyed cattle farms were in twelve departments (number of municipalities in parentheses): Atlántico (13), Bolívar (4), Boyacá (12), Caldas (2), Cesar (10), La Guajira (5), Meta (10), Quindío (9), Risaralda (2), Santander (4), Tolima (6) and Valle del Cauca (7). Three criteria were used to select the farms included in the sample: 1) location in regions prioritized by the GCS project; 2) farm area greater than 2 ha; and 3) owned by Colombian citizen(s). A ten-component questionnaire was applied at each farm: 1) general farm information; 2) livestock composition and management; 3) pasture management practices; 4) livestock productive and reproductive information; 5) animal health; 6) environmental information; 7) social information; 8) organizational information and relationship with external environment; 9) income from livestock; and 10) financial information.
The L+ project involved surveys applied at livestock farms in six municipalities: Cumaral and Restrepo (Piedemonte region), and Puerto Gaitán and Puerto López (Altillanura region) in the department of Meta; and Patía and Mercaderes in the Patía Valley in the department of Cauca. Surveys were conducted at 607 livestock farms in the three regions: Meta Piedmont (150); Meta high plains (147); and dry valley of Patía (310). The questionnaire consisted of eight components: 1) general farm information; 2) farm administrative information; 3) farm land use; 4) technical assistance; 5) productive and reproductive characteristics; 6) association membership; 7) commercial and financial information; and 8) climatic events and environmental practices.
From the total sample of 2,618 cattle farms surveyed between the two projects, 251 farms were identified. Of these, 165 (65.7 %) were cow-calf operations without dairy production and 86 (34.3 %) were cow-calf operations with dairy production. This sample (n= 251) was stratified based on herd size8: very small (VSP: 1 to 30 head); small (SP: 31 to 50 head); medium (MP: 51 to 250 head); and large (LP: ≥251 head). The numerical and categorical variables used in the questionnaires from each project were classified into five groups (Table 1).
Table 1 Components and numerical and categorical variables used in characterizing cow-calf operations
| Component | Numerical variables | Categorical variables |
|---|---|---|
| 1) General information | Animals per farm; stocking rate (large livestock unit - AU ha-1); areas (ha): total, livestock, agroforestry crops, perennial crops, transitory crops, monoculture forestry plantations, and improved pastures; topography (%): flat, undulating and hilly; non-bovid livestock inventory: horses, mules, pigs, goats, sheep and poultry. | Installations (stables, drive pen, chute, storage); machinery and equipment (tractor, chainsaw, mowing machine, motor pump, electric fence, electric pump, electronic scale); large species (horses, mules and buffalo); medium species (pigs, goats and sheep); small species (hens and chickens). |
| 2) Herd composition and management | Stratified inventory: producing cows, parous cows, dry cows, female calves (0-1 yr.), male calves (0-1 yr.), growing females, growing males, heifers, finishing males, young and mature bulls; supply rate (kg yr.-1 AU-1): mineral salts, supplements and concentrates. | Use of records (yes, no); use of (yes, no): mineral salts, white salt, supplements, concentrates. |
| 3) Pasture management | Area (ha): improved pastures, fertilized area; application rate (kg ha-1 yr.-1): fertilizers and amendments. | Improved pastures (yes, no); pasture rotation (yes, no); pasture divisions (yes, no) barbed wire, electric fence, mixed); change in pasture area (yes, no); weeding method (manual, mechanical, chemical, mixed); fertilization (yes, no); amendments (agricultural lime, dolomite lime, other); pasture renovation (yes, no). |
| 4) Production and reproduction information | Milk production (L animal-1 day-1); weight (kg): birth, weaning, final growth; age (months): weaning, final growth; daily weight gaina (kg day-1); preweaningb, finishingc; morality rate (%). | Type of milking (manual, mechanical; animal weighing (measuring tape, scale); weighed at birth (yes, no); weighed at weaning (yes, no); reproduction system (free natural mating, controlled natural mating, artificial insemination, embryo transfer); reproductive examination of cows and bulls (yes, no); weighing of heifers for first service (yes, no); inseminator (yes, no); artificial insemination equipment (yes, no); separation of dry lot (yes, no); birth pasture (yes, no); calculation of intercalving interval (yes, no). |
| 5) Environmental information | -- | Forest (yes, no); water source (surface, underground, aqueduct); springs (yes, no); water available in summer for livestock (yes, no). irrigation system (yes, no); wastewater treatment system (yes, no); solid waste management (incineration, burying, third party). |
aDaily weight gain (kg day-1): estimated based on initial and final weights during weaning and finishing phases and the length of each stage; bBirth to weaning; cWeaning to slaughter.
Statistical analyses
Analysis each of the five components was done with the Factorial Analysis for Mixed Data multivariate technique (FAMD), using the FAMD function of the FactoMineR package for the R statistical package9. The FAMD is a factorial method applied to analyze data sets in which a group of individuals is described with quantitative and qualitative variables. The term “mixed” refers to the simultaneous presence of qualitative and quantitative variables as active elements in the sampling units. This method allows simultaneous exploration of these variables by combining principal component analysis (PCA) and multiple correspondence analysis (MCA)10. The quantitative variables were centered and normalized to Z values, while the qualitative variables were disaggregated into a normalized disjunctive matrix. Starting from mixed samples, this method allows graphic evaluation of the similarities/dissimilarities between productive units (distances) and the correlations between continuous variables10. Prior to the application of the FAMD, missing data was imputed using the algorithm implemented in the impute FAMD function, which is part of the missMDA package11. The producer category and animal number variables were included in the FAMD as supplementary inputs to exclude their participation in model construction.
Results and discussion
Overall, most (74.5 %) of the producers included in the study were VSP and SP, while just 25.4 % were MP and LP (Table 2). This coincides with previous reports of livestock farm type distributions in Colombia2,8, in which 81 % of farms with cattle had fewer than 50 head and 18 % had from 51 to 500 head. Generally similar proportions have been reported for cattle farms in the Amazon region of Ecuador, with 64.5 % of farms having from 1 to 30 head of cattle12. This highlights the need to create agricultural public policy for cattle productive and reproductive improvement aimed at this type of producer.
Table 2 Farm and livestock characteristics and land use information for each cow-calf producer category (average ± standard deviation)
| Variable | VSP | SP | MP | LP |
|---|---|---|---|---|
| Total number of producers | 162 (64.5%) | 25 (10.0%) | 59 (23.5%) | 5 (2.0%) |
| Animals per farm, number | 13.4 ± 7.7 | 39.4 ± 6.9 | 108.8 ± 56.6 | 329.2 ± 57.1 |
| Total farm area, ha | 16.3 ± 26.3 | 40.6 ± 39.6 | 93.8 ± 76.9 | 135.3 ± 43.3 |
| Area for cattle, ha | 16.2 ± 26.4 | 40.4 ± 39.6 | 93.4 ± 77.0 | 134.9 ± 43.3 |
| Large Livestock Units (AU) per farm | 10.0 ± 5.9 | 30.8 ± 7.3 | 80.1 ± 43.2 | 253.5 ± 32.6 |
| Stocking rate, AU ha-1 | 1.2 ± 0.9 | 1.5 ± 1.1 | 1.3 ± 0.9 | 2.1 ± 0.7 |
| Farms with agroforest crops, % | 8.5 | 0 | 1.9 | 0 |
| Farm area in agroforest crops, % total area* | 13.3 ± 11.8 | --- | 15.0 | --- |
| Farms with perrennial crops, % | 10.2 | 20.0 | 9.3 | 20.0 |
| Farm area in perennial crops, % total area* | 11.1 ± 15.0 | 2.3 ± 0.9 | 2.9 ± 4.9 | 0.6 |
| Farms with transitory crops, % | 7.0 | 10.0 | 5.6 | 20.0 |
| Farm area in transitory crops, % total area* | 12.9 ± 14.2 | 16.8 ± 0.2 | 10.2 ± 9.7 | 3.00 |
| Farms with improved pastures, % | 47.5 | 30.0 | 33.3 | 40.0 |
| Farm area in improved pastures, % total area* | 25.7 ± 34.0 | 21.4 ± 35.5 | 20.0 ± 30.7 | 24.8 ± 42.9 |
| Flat area in farm, % total area | 48.2 ± 38.3 | 50.5 ± 37.6 | 54.5 ± 39.5 | 62.0 ± 52.2 |
VSP= very small producers; SP= small producers; MP= medium producers; LP= large producers.
*Average calculated based on farms with this type of crop.
Factorial Analysis for Mixed Data (FAMD) analyses were run for each of the five evaluated components and include: (a) the spatial relationship between qualitative variable centroids, with producer category as supplementary variable, and (b) the projection of the continuous variables on the plane of the first two factorial dimensions, with number of animals as a supplementary variable (Figures 1, 2, 3, 4 and 5). The first two dimensions captured 39.5% of the variability in the General Farm Information component (Figure 1), 24.8 % in the Herd Composition and Management component (Figure 2), 29.7 % in the Pasture Management component (Figure 3), 47.2 % in the Productive and Reproductive Information component (Figure 4) and 37.9 % in the Environmental Information component (Figure 5). The supplementary variables did not participate in model construction. The different producer categories (VSP, SP, MP and LP) were clearly separated from the centroid in the first four components. No separation from the centroid was present in the environmental component, suggesting that there were no marked differences in environmental practices associated with producer size.
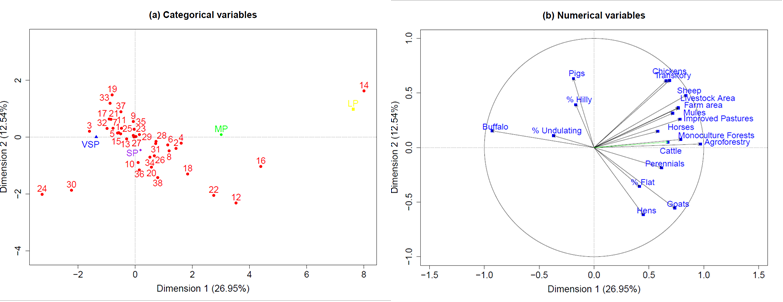
a) Spatial projection in first and second dimensions of General Farm Information categorical variable categories: LP = large farms; MP = medium farms; SP = small farms; VSP = very small farms; 1 = no stable; 2 = yes stable; 3 = no drive pen; 4 = yes drive pen; 5 = no chute; 6 = yes chute; 7 = no storage house; 8 = yes storage house; 9 = no electric fence; 10 = yes electric fence; 11 = no electric pump; 12 = yes electric pump; 13 = no electronic scale; 14 = yes electronic scale; 15 = no tractor; 16 = yes tractor; 17 = no chainsaw; 18 = yes chainsaw; 19 = no mower; 20 = yes mower; 21 = no motor pump; 22 = yes motor pump; 23 = no agroforestry crops; 24 = yes agroforestry crops; 25 = no perennial crops; 26 = yes perennial crops; 27 = no transitory crops; 28 = yes transitory crops; 29 = no monoculture forest plantations; 30 = yes monoculture forest plantations; 31 = no improved pastures; 32 = yes improved pastures; 33 = no large species; 34 = yes large species; 35 = no medium species; 36 = yes medium species; 37 = no small species; and 38 = yes small species. Spatial projection of numerical variable categories b): Farm Area = total area of farm; % Flat = flat area on farm; % Undulating = undulating area on farm; % Hilly: hilly area on farm; Agroforestry = area in agroforestry crops; Perennial = area in perennial crops; Transitory = area in transitory crops; Monoculture Forests = area in monoculture forest plantations; Improved pastures = area in improved pastures; Livestock Area = area for livestock; Buffalo = number of buffaloes; Horses = number of horses; Mules = number of mules; Pigs = number of pigs; Goats = number of goats; Sheep = number of sheep; Hens = number of hens; Chickens = number of chickens; Cattle = number of cattle.
Figure 1 Spatial projection of General Farm Information categorical (a) and numerical (b) variables
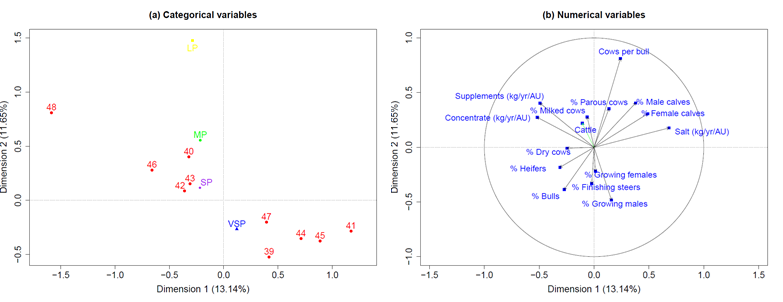
a) Spatial projection in first and second dimensions of Herd Composition and Management categorical variables: LP = large farms; MP = medium farms; SP = small farms; VSP = very small farms; 39 = no livestock records; 40 = yes livestock records; 41 = no mineralized salts; 42 = yes mineralized salts; 43 = no white salt; 44 = yes white salt; 45 = no supplements; 46 = yes supplements; 47 = no concentrate; and 48 = yes concentrate. Spatial projection of numerical variables b): Cows per bull = number of cows per bull; % Milked cows = % cows being milked; % Parous cows= % of cows that have given birth; % Dry cows = % dry cows; % Female calves = % female calves (0 to 1 yr.); % Male calves = % male calves (0 to 1 yr.); % Growing females = % growing females; % Growing males = % growing males; % Heifers = % heifers; % Finishing steers = % finishing steers; % Bulls = % bulls; Concentrate (kg/yr/AU) = feed concentrate supply rate; Supplements (kg/yr/AU) = supplement supply rate; Salt (kg/yr/AU) = salt supply rate; and Cattle = number of cattle.
Figure 2 Spatial projection of Herd Composition and Management categorical (a) and numerical (b) variables
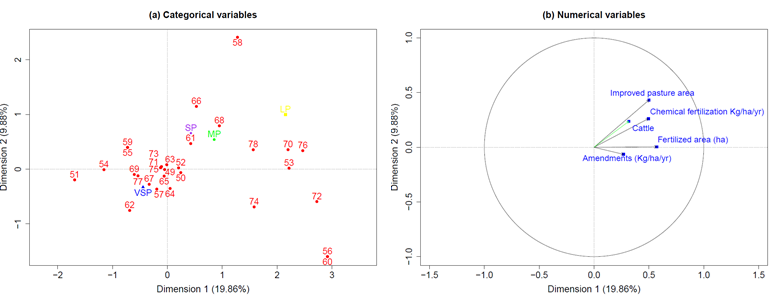
a) Spatial projection in first and second dimensions of Herd Composition and Management categorical variables: LP = large farms; MP = medium farms; SP = small farms; VSP = very small farms; 49 = no improved pastures; 50 = yes improved pastures; 51 = no pasture rotation; 52 = yes pasture rotation; 53 = no barbed wire pasture divisions; 54 = yes barbed wire pasture divisions; 55 = no electric fence pasture divisions; 56 = yes electric fence pasture divisions; 57 = no mixed-method (barbed wire, electric fence, etc.) pasture divisions; 58 = yes mixed-method (barbed wire, electric fence, etc.) pasture divisions; 59 = no change in pasture area; 60 = yes change in pasture area; 61 = no manual weed control; 62 = yes manual weed control; 63 = no mechanical weed control; 64 = yes mechanical weed control; 65 = no chemical weed control; 66 = yes chemical weed control; 67 = no mixed weed control; 68 = yes mixed weed control; 69 = no chemical fertilization; 70 = yes chemical fertilization; 71 = no agricultural lime; 72 = yes agricultural lime; 73 = no dolomite lime; 74 = yes dolomite lime; 75 = no other additive use; 76 = yes other additive use; 77 = no pasture renovation; and 78 = yes pasture renovation. b) Numerical variables: Improved pasture area = improved pasture area; Chemical fertilization (kg/ha/yr) = chemical fertilization rate; Fertilized area (ha) = farm area fertilized; Amendments (kg/ha/yr) = amendment application rate; Cattle = number of cattle on farm.
Figure 3 Spatial projection of Pasture Management categorical (a) and numerical (b) variables
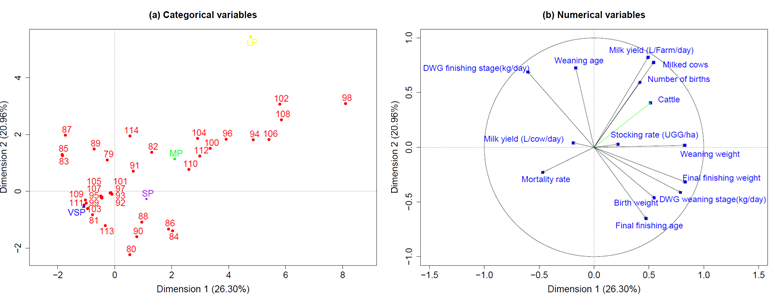
a) Spatial projection in first and second dimensions of Herd Composition and Management categorical variables: LP = large farms; MP = medium farms; SP = small farms; VSP = very small farms; 79 = no weighing with measuring tape; 80 = yes weighing with measuring tape; 81 = no weighing with scale; 82 = yes weighing with scale; 83 = no weighing at birth; 84 = yes weighing at birth; 85 = no weighing at weaning; 86 = yes weighing at weaning; 87 = no breeding male calves; 88 = yes breeding male calves; 89 = no finishing animals; 90 = yes finishing animals; 91 = no natural mating; 92 = yes natural mating; 93 = no controlled mating; 94 = yes controlled mating; 95 = no artificial insemination; 96 = yes artificial insemination; 97 = no embryo transfer; 98 = yes embryo transfer; 99 = no cow reproductive examination; 100 = yes cow reproductive examination; 101 = no bull reproductive examination; 102 = yes bull reproductive examination; 103= no weighing heifers for first service; 104 = yes weighing heifers for first service; 105 = no inseminator; 106 = yes inseminator; 107 = no insemination equipment; 108 = yes insemination equipment; 109 = no dry cow lot separation; 110 = yes dry cow lot separation; 111 = no birth pasture; 112 = yes birth pasture; 113 = no calculation intercalving interval; and 114 = yes calculation intercalving interval. b) Spatial projection of numerical variables: Stocking rate (AU/ha) = stocking rate; Milked cows = number of cows milked; Milk yield (L/Farm/day) = daily milk production per farm; Milk yield (L/cow/day) = daily milk production per cow; Birth weight = animal weight at birth; Weaning weight = animal weight at weaning; Weaning age: age at weaning; Final finishing age = animal final finishing age; Final finishing weight= animal final finishing weight; DWG weaning stage (kg/day) = animal daily weight gain during weaning stage; DWG finishing stage (kg/day) = animal daily weight gain during finishing stage; Number of births = number of births at farm; Mortality rate = mortality rate at farm; Cattle = number of cattle at farm.
Figure 4 Spatial projection of Productive and Reproductive Information categorical (a) and numerical (b) variables
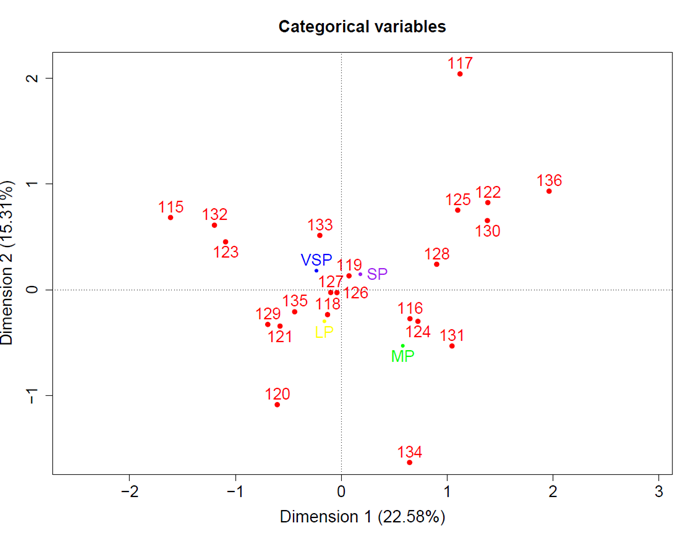
Spatial projection in first and second dimensions of Environmental Information categorical variables: LP = large farms; MP = medium farms; SP = small farms; VSP = very small farms; 115 = no forest; 116 = yes forest; 117 = no surface water use; 118 = yes surface water use; 119 = no underground water use; 120 = yes underground water use; 121 = no aqueduct water use; 122 = yes aqueduct water use; 123 = no springs; 124 = yes springs; 125 = no summer water available for livestock; 126 = yes summer water available for livestock; 127 = no irrigation system; 128 = yes irrigation system; 129 = no wastewater treatment system; 130 = yes wastewater treatment system; 131 = no solid waste incinerated; 132 = yes solid waste incinerated; 133 = no solid waste buried; 134 = yes solid waste buried; 135 = no third party waste management; and 136 = yes third party waste management.
Figure 5 Spatial projection of Environmental Information categorical (a) and numerical (b) variables.
General farm information
The configuration of the categorical variables used to characterize the general farm information resulted in an orderly alignment of the producer categories in the first dimension of the FAMD graph (Figure 1(a)). Close associations existed between the LP and MP categories and the machinery and equipment variables (electronic scale, tractor, chainsaw, motor pump, electric pump, drive pen, stable, chute and storehouse). In contrast variables related to non-use of these technologies were to the left of dimension 1, alongside the variables of agroforestry crops and monoculture forest plantations, both associated with the VSP and SP categories. In dimension 2, the presence of small, medium and large species on the farm, and use of a mower and electric fence grouped in the lower portion while the absence and/or non-use of these variables were located in the upper portion; no apparent relationship existed between these variables and producer category.
Six numerical variables were positively related to the first dimension, representing farm size: total farm area; livestock area; improved pasture area; agroforestry crop area; monoculture forest plantation area; and transitory crop area (Figure 1b). These variables were also closely linked to the number of cattle; for instance, the number of buffaloes and undulating area on a farm were negatively associated to dimension 1, meaning that these conditions were more common at small farms. In dimension 2, positively linked variables included number of pigs and hilly area on farm, while the negatively linked variables were number of hens, goats and flat area on farm.
The association of MP and LP with infrastructure (i.e. machinery, equipment and facilities) reflects their greater economic capacity. In addition, cattle producers with larger herds generate more income and profits than smaller producers, allowing them to build facilities and purchase more and better equipment and machinery, all of which are costly inputs in livestock production7. Similar circumstances have been reported for Mexico in which larger farms have greater machinery and equipment availability and these were more apt for livestock production13.
Larger farms were negatively associated with the undulating area on farm variable but positively associated with the presence of mules and horses (large species). It is noteworthy that the presence and use of other animal species could favor food availability, stability, access and consumption; these are the four dimensions of food security and may benefit producer sustainability14.
Hilly slopes (>30 %) are not suitable for grazing12. The percentage of hilly area (slope >60%) on farm was highest in the VSP (25.5 %), followed by the SP (22.0 %), MP (14.2 %) and LP (10.5 %). Grazing livestock on hilly slopes can cause land degradation due to increased erosion associated with livestock trampling15. This leads to decreased soil filtration capacity and consequent greater surface runoff during rains16, which translate to lower biomass production and livestock productivity. Also, as pastures degrade net annual GHG emissions tend to rise17. It is therefore important to estimate GHG emissions on livestock farms to identify their contribution to global GHG emissions and propose appropriate mitigation actions.
The number of the evaluated cow-calf operations that also engaged in agricultural activities or grew some crop was low in all four producer categories (Table 2). This contrasts with small producers in the state of Veracruz, Mexico, where 85% combined livestock activity with agriculture18. It is to be expected that the overall crop area on the farms was low. Most cow-calf operations in Colombia are extensive systems19, and the current results are therefore more comparable to those for extensive and semi-extensive livestock systems in Mexico20, in which the area used to grow crops was reported as less than 20 %. Joint agricultural and livestock production helps to guarantee food security. It can also contribute to climate change adaptation and mitigation by, for example, incorporating short-cycle or transitory crops into grazing systems21.
Technical component
Herd composition and management
The categorical variables related to supply of supplements, concentrates and mineralized salts concentrated to the left of dimension 1, whereas those related to their absence and the use of white salt were to the right (Figure 2(a)). In dimension 2, the livestock records variable was located at the top of the graph while the lack of records was at the bottom. Overall, this suggests that the SP, MP and LP kept livestock records and provided larger quantities of feed complements, while the VSP were mainly characterized by supplying white salt, not keeping livestock records and not supplying feed concentrates or supplements. The numerical variables showed mineralized salt supply rate (kg yr.-1 AU-1) was positively related to dimension 1, while the concentrates and supplements supply rates (kg yr.-1 AU-1) were negatively related to it (Figure 2(b)). This coincides with the higher concentrates and supplements supply rates in the MP and LP (Table 3). The variables cows per bull, percentage female calves, percentage male calves, percentage parous cows born and percentage milked cows were positively associated with dimension 2; these variables were also linked to the number of animals’ variable. The percentages of growing males, bulls and finishing steers were negatively associated with this dimension.
Table 3 Herd composition, productive and reproductive parameters, and complementary feed supply rates by cow-calf producer size category (average ± standard deviation)
| Variables | VSP | SP | MP | LP |
|---|---|---|---|---|
| Herd composition | ||||
| Cows in production, AU | 1.1 ± 2.3 | 2.0 ± 4.0 | 3.7 ± 9.8 | 19.0 ± 42.5 |
| Parous cows, AU | 2.5 ± 3.3 | 8.9 ± 6.4 | 25.5 ± 26.6 | 58.4 ± 42.2 |
| Dry cows, AU | 2.1 ± 2.7 | 9.4 ± 10.1 | 18.1 ± 19.8 | 83.4 ± 33.6 |
| Female calves (0-1 yr.), AU | 0.5 ± 0.6 | 1.3 ± 1.1 | 4.5 ± 3.9 | 11.6 ± 3.2 |
| Male calves (0-1 yr.), AU | 0.4 ± 0.4 | 1.1 ± 0.9 | 3.9 ± 3.3 | 8.9 ± 4.7 |
| Growing females (1-2 yrs.), AU | 1.0 ± 1.9 | 2.3 ± 3.0 | 6.2 ± 7.1 | 20.5 ± 22.4 |
| Growing males (1-2 yrs.), AU | 0.9 ± 1.9 | 1.0 ± 1.8 | 3.5 ± 6.9 | 9.4 ± 18.3 |
| Heifers (2-3 yrs.), AU | 1.2 ± 2.5 | 4.4 ± 5.8 | 7.7 ± 11.6 | 13.0 ± 15.8 |
| Finishing steers (2-3 yrs.), AU | 0.3 ± 1.3 | 0.4 ± 1.2 | 4.9 ± 12.7 | 23.8 ± 53.3 |
| Bulls, AU | 0.5 ± 0.7 | 1.0 ± 1.1 | 3.7 ± 5.7 | 5.5 ± 3.5 |
| Complementary feed | ||||
| Concentrates, kg yr.-1 AU-1* | 53.6 ± 25.3 | 55.8 ± 30.1 | 60.6 ± 45.5 | 85.4 ± 75.9 |
| Supplements, kg yr.-1 AU -1* | 16.5 ± 22.5 | 15.9 ± 15.5 | 33.8 ± 22.2 | 34.3 ± 30.6 |
| Mineral salts, kg yr.-1 AU -1* | 32.3 ± 5.7 | 30.7 ± 3.4 | 32.4 ± 3.2 | 31.6 ± 1.4 |
| Productive and reproductive parameters | ||||
| Birth weight, kg | 31.5 ± 4.4 | 32.3 ± 4.4 | 34.1 ± 4.0 | 34.3 ± 4.0 |
| Weaning weight, kg | 149.4 ± 34.8 | 175.0 ± 46.2 | 179.2 ± 42.3 | 176.7 ± 5.8 |
| Weaning age, months | 7.3 ± 1.1 | 7.8 ± 1.4 | 8.0 ± 0.9 | 8.0 ± 1.7 |
| Preweaning DWG, kg day-1 | 0.60 ± 0.22 | 0.59 ± 0.17 | 0.61 ± 0.18 | 0.63 ± 0.15 |
| Mortality, % | 14.6 ± 10.9 | 6.1 ± 3.4 | 3.8 ± 3.0 | 3.0 ± 2.9 |
| Milk production, L animal-1 day-1 | 3.4 ± 1.4 | 3.5 ± 1.3 | 2.8 ± 1.7 | 2.9 ± 1.5 |
VSP= very small farms; SP= small farms; MP= medium farms; LP= large farms; DWG= Daily weight gain.
*Average calculated based on farms using this technique.
Most grasses cultivated in the tropics are mineral deficient. Cow-calf operations are largely extensive grazing systems using high percentages of natural pastures. Mineral supplementation is therefore necessary to minimize the negative effects of macro- and micronutrient deficiencies22. Use of mineralized salts was associated with the MP and LP while use of white salt was associated with the VSP. The MP and LP apparently provide more complete mineral supplements, which may result in better reproductive and productive behavior than in the VSP, which do not provide mineralized salts supplementation, possibly due to the high cost or cultural aspects.
Use of feed concentrates was associated most clearly with the LP, possibly because larger farms tend to have higher percentages of milked cows and higher supplementation rates (Table 3). In various characterization studies of extensive systems LPs are identified as generating the highest income. This allows them to purchase feed supplements, among the costliest inputs in cattle herds12, and which can translate into higher productivity. Smaller producers often provided little or no supplements. For example, in combination cow-calf/dairy systems in the department of Cundinamarca, Colombia, small and medium producers did not provide supplements or concentrates and feeding consisted mainly of grazing natural grasslands23. By basing feeding on natural and/or degraded pastures with some cases of improved concentrates and pastures, VSP, SP and MP may have lower yields.
The minimal use of livestock records and productive and reproductive control associated with the VSP in the present characterization coincides with similar results for small-scale producers in Cundinamarca, Colombia23. Promotion of livestock records and technical control could improve monitoring of productive and reproductive parameters at these farms, which is vital if producers are to make informed decisions aimed at increasing productivity.
Pasture management
The categorical variables in the pasture management component tended to group to the right side of dimension 1 (Figure 3(a)), particularly the variables related to chemical fertilization, pasture renovation, pasture rotation and change, application of amendments and use of electric fencing. In contrast the variables related to non-implementation of these practices and/or activities grouped generally to the left side of dimension 1. In dimension 2, the variables of mixed pasture division (barbed wire and electric fence) and chemical and mixed-method weed control grouped at the top; the opposites of these variables grouped towards the bottom. These patterns suggest the MP, LP and SP tend to use better pasture improvement and conservation practices than the VSP.
Pasture rotation and mixed-method division of pastures were associated with the MP and LP (Figure 3(a)), which tend to use alternate and rotational grazing. An adequate pasture rotation system helps to increase biomass quantity and quality, and consequently livestock system productivity24,25. Use of electric fences allows the changing of pasture area, facilitating proper pasture management and greater productivity. Farms with larger herds can therefore more easily rotate pastures and use electric fences to benefit productive performance.
Sole use of manual weed control was associated with the VSP; it has the advantage of low environmental impact but is labor intensive. Use of mixed weeding methods was associated mainly with the MP and LP, suggesting these producers are concerned about weeds in pastures. These results agree with a report for cow-calf operations in Cundinamarca, Colombia, where many producers combined different weeding methods, including mechanical, manual and chemical23.
The numerical variables of improved pasture area, fertilized area, fertilization rate and number of animals were positively related to dimension 1 (Figure 3(b)). Chemical fertilization was associated with farms with more animals, although less than 28 % of producers in all four categories used this technique. Rates as low as 14 % have been reported for cow-calf operations in Colombia23.
At most cattle farms chemical fertilization is done when a pasture is established, but no maintenance fertilization is done. In the present results fertilizer application rates ranged from 40 to 104 kg N ha-1 yr-1, the lowest rates being in the VSP and SP. Recommended rates for permanent pastures range from 100 to 200 kg N ha-1 year-1(26, suggesting that the levels applied in the studied farms were insufficient for pastures to attain optimum yields. However, in any given pasture the optimum fertilizer dose will depend on soil fertility and physical characteristics, environmental variables, and the crop to be established, among other factors.
Productive and reproductive information
Among the categorical variables for productive and reproductive information (Figure 4(a)), the productive and reproductive practices variables tended to group on the right side of dimension 1: weighing at birth and weaning, controlled mating, artificial insemination, embryo transfer, palpation of cows, reproductive examination of bulls, weighing of heifers for first service and separation of the dry cow lot, in addition to existence of a birth pasture, artificial insemination equipment and inseminator. Those variables quantifying the absence of these practices, activities, facilities and/or equipment grouped to the left side of dimension 1.
In dimension 2, production practice variables such as weighing by measuring tape, breeding male calves and finishing animals grouped at the bottom. Variables representing the absence of these practices grouped in the upper portion, as well as calculation of intercalving interval and weighing with scales. These groupings suggest that the MP and LP implemented better productive and reproductive practices than did the VSP and SP. Use of better reproductive and productive practices by the MP and LP may translate into higher productivity. These results are similar to the reported absence at small producers of practices such as weighing heifers for first service, reproductive examinations, use of artificial insemination, availability of birth pastures, separation of the dry cow lot and calculation of the intercalving interval23. These reproductive practices are more common in larger more specialized livestock systems with greater financial resources, and manifest in higher rates of productivity7.
Weighing cattle is important for assessing growth, planning feeding to maximize yields and take full advantage of available feed resources, properly managing technical and financial records, and implementing monitoring, medication, genetic improvement and reproductive management27. More of the MP and LP producers weighed their animals than did the SP and VSP, a fact which may be linked to the greater availability of scales at larger farms. Barimetry facilitates estimation of approximate animal live weight through body metrics and formulas27. These should therefore be promoted and applied at VSP and SP farms, where scales are rare, and thus provide them with greater control of yield rates and potentially increase their productivity.
The variables of weaning age, number of milked cows, number of births and total milk production (L farm-1 day-1) were positively related to each other and to dimension 2 (Figure 4(b)). One measure that could improve herd reproductive performance is early weaning, which reduces cow energy requirements, resulting in weight gain, improved body condition, increased pregnancy rates and better overall reproductive performance28. However, this requires adequate nutritional management of weaned calves to ensure sufficient quantities of good quality energy and protein, which can incur additional costs for producers29.
In the present analysis the number of animals was negatively linked to mortality rates (Figure 4(b)). The opposite was reported for livestock systems in Costa Rica where mortality rates tended to be lower at smaller farms (<30 head)30. In small farms the death of one animal has a proportionally greater effect than it would at larger farms. No matter farm size, a lower mortality rate can result in greater profitability and competitiveness, and consequent higher income.
Preweaning daily weight gain (DWG), and weights at birth and weaning were higher in the MP and LP. Higher birth weight offspring are reported to grow more rapidly and experience lower mortality, which would support the reported positive correlation between birth weight and weaning weight in beef cattle31. However, some studies indicate that offspring with the highest birth weight do not necessarily reach the highest weaning weight32,33. Nonetheless, a greater preweaning DWG does result in higher weight at weaning, which, through sale of heavier animals for finishing, can result in greater profitability32.
Environmental information
In this component no separation from the centroid was observed (Figure 5), suggesting that the different producer categories did not differ in terms of environmental practices. Promoting broader implementation of good environmental practices on farms requires strategies that generate productive and economic benefits for producers in addition to environmental benefits such as climate change mitigation and adaptation. For example, the conservation of trees and shrubs in pastures and silvopastoral systems is a production strategy adopted in livestock systems in the Latin American tropics. It contributes to reducing extreme temperatures, conserving wildlife, controlling water quality in watersheds, capturing atmospheric carbon, mitigating climate change, as well as improving milk and meat production and livestock profitability34.
The wastewater generated in livestock systems usually originates from any on-site dwellings and the stables. Few (<40%) of the farms included in the study employed wastewater treatment systems meaning any liquid waste was discharged directly into water sources and soils. Those farms with treatment systems largely used septic tanks and biodigesters, which are primary and secondary low nutrient removal processes. Therefore, direct discharges and effluents from treatment systems could generate eutrophication in water bodies in response to nitrogen (N) and phosphorus (P) from cattle excreta. Tertiary treatment systems that increase nutrient removal from discharge are vital to reduce eutrophication phenomena.
Non-biodegradable solid waste is one of the main environmental impacts of the cattle production chain in Colombia, but a lack of quantitative studies prevents accurate estimation of its magnitude35. Incineration and burial were the main forms of solid waste management and were used at more than 70% of the farms. Incineration generates GHG emissions that increases potential global warming, while burial without proper sanitary controls can contaminate aquifers. Characterization of cattle producer solid waste processing capacity is an important variable for quantitatively assessing the degree of potential negative impacts generated at farms and for establishing management strategies to minimize them.
Conclusions and implications
In the four components of general farm information, herd composition and management, pasture management, and productive and reproductive information, the variables exhibited spatial separation from the centroid in each producer category. Generally, the medium and large producers were associated with variables indicating the presence of more sophisticated infrastructure, machinery and equipment, more advanced pasture management practices and better reproductive and productive parameters. All these variables in turn can be linked to greater production capacity and income. Only the environmental information variables lacked clear separation from the centroid in all four producer categories, suggesting that producer size had no effect on implementation of environmental practices. The most relevant environmental aspects of livestock systems need to be identified to include them in future characterization studies and increase understanding of the environmental impacts associated with livestock production. The principal characteristics identified for each producer category can serve as a basis for designing and implementing technological development policies and programs. Based on the number of small and very small producers and their characteristics these two categories would benefit from the mitigation actions established in the NDC for Colombia, including rational grazing, grassland rehabilitation and use of intensive silvopastoral systems.
Acknowledgements
This study is part of the LivestockPlus project funded by the Consultative Group on International Agricultural Research (CGIAR) Program (CRP) on Climate Change, Agriculture and Food Security. In addition, this work was also done as part of the Livestock CRP. We thank all donors that globally support the work of the CRP programs through their contributions to the CGIAR system. We are thankful to the Colombian Sustainable Cattle Ranching project implemented by the Federación Colombiana de Ganaderos, the Fundation Centro para la Investigación en Sistemas Sostenibles de Producción Agropecuaria, Fondo Acción, and The Nature Conservancy.
REFERENCES
1. FAO. FAOSTAT. Agricultural Production. Rome; 2013. http://www.fao.org/faostat/en/#home [ Links ]
2. ICA. Censo Pecuario Nacional 2018. Bogotá DC. 2018. https://www.ica.gov.co/areas/pecuaria/servicios/epidemiologia-veterinaria/censos-2016/censo-2018 [ Links ]
3. DANE. Encuesta Nacional Agropecuaria 2016. Bogotá DC. 2017. https://www.dane.gov.co/index.php/estadisticas-por-tema/agropecuario/encuesta-nacional-agropecuaria-ena [ Links ]
4. Fedegán. Estadísticas. 2019. http://www.fedegan.org.co/estadisticas/produccion-0 [ Links ]
5. Páez L, Tiburcio L, Sayago W, Pacheco R. Caracterización estructural y funcional de fincas ganaderas de doble propósito en el municipio Páez del estado Apure, Venezuela. Zootec Trop 2003;21(3):301-320. [ Links ]
6. MADS. Ministerio de Ambiente y Desarrollo Sostenible. Documento técnico soporte de la INDC de Colombia. Bogotá, DC. 2015. [ Links ]
7. Holmann F, Rivas L, Carulla J, Giraldo L, Guzmán S, Martínez M, et al. Evolución de los Sistemas de Producción de Leche en el Trópico Latinoamericano y su interrelación con los Mercados: Un Análisis del Caso Colombiano. Cali. IICA; 2003. [ Links ]
8. Fedegán. Plan estratégico de la ganadería colombiana 2019 - Por una ganadería moderna y solidaria. Vol. 1, PEGA 2019. Bogotá, DC. 2006. [ Links ]
9. R Core Team: A Language and Environment for Statistical Computing. Vienna, Austria: R Foundation for Statistical Computing; 2016. [ Links ]
10. Pagès J. Analyse factorielle de donnees mixtes: principe et exemple d’application. Montpellier SupAgro. 2004. [ Links ]
11. Josse J, Husson F. missMDA: A package for handling missing values in multivariate data analysis. J Stat Softw 2016;70(1):1-31. [ Links ]
12. Ríos-Núñez S, Benítez-Jiménez D. Análisis del funcionamiento económico productivo de los sistemas de producción cárnica bovina en la Amazonía Ecuatoriana. Arch Zootec 2015;(64):409-416. [ Links ]
13. Chalate-Molina H, Gallardo-López F, Pérez-Hernández P, Lang-Ovalle FP, Ortega-Jiménez E, Vilaboa-Arroniz J. Características del sistema de producción bovinos de doble propósito en el estado de Morelos, México. Zootec Trop 2010;28(3):329-339. [ Links ]
14. Urquía-Fernández N. La seguridad alimentaria en México. Salud Publica Mex 2014;(56):92-98. [ Links ]
15. Sadeghian S, Rivera JM, Gómez M. Impacto de sistemas de ganadería sobre las características físicas, químicas y biológicas de suelos en los andes de Colombia. FAO-CIPAV. Conferencia electrónica de la FAO sobre “Agroforestería para la producción animal en Latinoamérica”. Cali; 2000:77-95. [ Links ]
16. Vargas J, Benítez D, Torres V, Velázquez F, Erazo O. Tipificación de las fincas ganaderas en el piedemonte de las provincias Los Ríos y Cotopaxi de la República del Ecuador. Rev Cuba Cienc Agrícola 2011;45(4):381. [ Links ]
17. Naranjo JF, Cuartas CA, Murgueitio E, Chará J, Barahona R. Balance de gases de efecto invernadero en sistemas silvopastoriles intensivos con Leucaena leucocephala en Colombia. LRRD 2012;24(8). [ Links ]
18. Villa-Herrera A, Nava-Tablada ME, López-Ortiz S, Vargas-Lopez S, Ortega-Jiménez E, López FG. Utilización del Guácimo (Guazuma ulmifolia Lam.) como fuente de forraje en la ganadería bovina extensiva en el trópico mexicano. Trop Subtrop Agroecosystems 2009;10(2):253-261. [ Links ]
19. Mahecha-Ledesma L, Gallego L, Peláez F. Situación actual de la ganadería de carne en Colombia y alternativas para impulsar su competitividad y sostenibilidad. RCCP 2002;15(2):213-225. [ Links ]
20. Gómez-Castro H, Tewolde A, Nahed-Toral J. Análisis de los sistemas ganaderos de doble propósito en el centro de Chiapas, México. Arch Latinoam Prod Anim 2002;10(3):175-183. [ Links ]
21. Sierra-Roncancio SS, Cano-Muñoz JG, Rojas-Sánchez F. Estrategias de adaptación al cambio climático en dos localidades del municipio de Junín, Cundinamarca, Colombia. Rev Investig Agrar Ambient 2015;6(1):227-237. [ Links ]
22. Rosero-Noguera R, Posada-Ochoa SL. Cálculo de sales minerales para vacunos en pastoreo. 1st ed. Fondo Editorial Biogénesis; 2016:1-29. [ Links ]
23. Villate-Calderón JA, Martínez-Roldán CM. Tipificación y diagnóstico de sistemas de producción bovina de ceba, cria y doble propósito, para pequeños y medianos productores de la provincia de Medina, Cundinamarca [tesina pregrado]. Bogotá, DC: Universidad de la Salle; 2011. [ Links ]
24. Ruiz TE, Castillo E, Alonso J, Febles G. Factores de manejo para estabilizar la producción de biomasa con leguminosas en el trópico. Avances en Investigación Agropecuaria 2006; 10(1):3-20. [ Links ]
25. Arango J, Gutiérrez J, Mazabel J, Pardo P, Enciso K, Burkart S, et al. Estrategias tecnológicas para mejorar la productividad y competitividad de la actividad ganadera: Herramientas para enfrentar el cambio climático. Cali, Colombia: CIAT; 2016: (414):1-58. [ Links ]
26. Bernier R, Undurraga P. Fertilización de praderas permanentes para la producción de leche. Manual de producción de leche para pequeños y medianos productores. INIA; 2009:(148). [ Links ]
27. Mahecha-Ledesma L, Angulo J, Manrique LP. Predicción del peso vivo a través del perímetro torácico en la raza bovina Lucerna. RCCP 2002;15(1):88-91. [ Links ]
28. Hudson MD, Banta JP, Buchanan DS, Lalman DL. Effect of weaning date (normal vs late) on performance of young and mature beef cows and their progeny in a fall calving system in the Southern Great Plains. J Anim Sci 2010;88(4):1577-1587. [ Links ]
29 . Schor A, Guibelalde G, Grigera-Naón JJ. Efecto de la fecha de destete sobre la performance de vientres y terneros. Rev Argentina Prod Anim 2015;(25):179-188. [ Links ]
30. Holmann F, Rivas L, Pérez E, Castro C, Schuetz P, Rodríguez J. La cadena de carne bovina en Costa Rica: identificación de temas críticos para impulsar su modernización, eficiencia y competitividad. Cali-Colombia: CIAT;2007:(206):1-70. [ Links ]
31. Madrid-Bury N, González-Stagnaro C, Goicochea-Llaque J, González-Villalobos D, Rodríguez-Urbina MA. Peso al nacimiento en hembras bovinas doble propósito. Rev Fac Agron 2007;24(4):690-708. [ Links ]
32. Arboleda-Zapata EM, Vergara-Garay OD, Restrepo LF. Características de crecimiento en bovinos mestizos en la costa norte colombiana. LRRD 2007;19(5). [ Links ]
33. Montes D, Vergara O, Prieto E, Rodríguez A. Estimación de los parámetros genéticos para el peso al nacer y al destete en ganado bovino de la raza Brahman. Rev MVZ Córdoba 2008;13(1):1184-1191. [ Links ]
34. Murgueitio E, Xóchitl Flores M, Calle Z, Chará J, Barahona R, Molina CH, et al. Sistemas agroforestales. Funciones productivas, socioeconómicas y ambientales. Productividad en sistemas silvopastoriles intensivos en América Latina. Cali - Colombia; 2015:(402):57-101. [ Links ]
35. Murgueitio E. Impacto ambiental de la ganadería de leche en Colombia y alternativas de solución. LRRD 2003;15(10). [ Links ]
Received: May 17, 2018; Accepted: October 01, 2018
 Este es un artículo publicado en acceso abierto bajo una licencia
Creative Commons
Este es un artículo publicado en acceso abierto bajo una licencia
Creative Commons
