


 texto en
  Inglés (pdf)
 Artículo en XML
 Referencias del artículo
 Enviar artículo por email
 Citado por SciELO
  Similares en
SciELO
Similares en
SciELO 
 Permalink
Introduction
The evolution of the knowledge of the nutritional requirements of sheep, to obtain high productive performance, has led to the use of feedlot diets, that are formulated with high levels of concentrate, and small levels of roughage ingredients1. The provision of concentrates affects ruminal fermentation2 and, high levels of inclusion have been associated with the occurrence of nutritional disturbances, mainly acidosis3. Growth promoters additives, have shown the potential to modulate ruminal fermentation, reflecting in high productive performance, in addition to reducing risks of nutritional disturbances.
The class of ionophores is most commonly used as growth promoters, for animals of zootechnical interest. Although more than 120 antibiotics belong to this class, monensin is probably the most researched and used additive in ruminant diets4. Similarly, salinomycin also belongs to the ionophore class, and is widely researched and used. According to Edwards et al5 other non-ionophore antibiotics, such as flavomycin, have proved to be beneficial in altering ruminal fermentation and have been used as an additive. The beneficial alteration caused by ionophores in the rumen occurs because they act on Gram-positive bacteria, fungi and protozoa, and thus enable better conditions for Gram-negative bacteria to develop6. These alterations in the rumen’s microbiology reflect in lower production of methane, ammonia, and acetic and butyric acids. Propionic acid production is increased, so there is an increase in energy efficiency and this reflects increasing the weight gain or feed efficiency of ruminants7.
Flavomycin has a mechanism of action different from ionophores, and its microorganism selectivity is different. It does not act on all species of Gram-positive bacteria, and has no effect on fungi and protozoa5. This additive has been shown as efficient for increasing the weight gain or feed efficiency in ruminants8,9, however, its effect on ruminal fermentation is not fully understood.
Thus, this study evaluated the effects of the inclusion of concentrate, and compared the effects of the addition of monensin, salinomycin and flavomycin in sheep diets on intake, digestibility, in situ degradability, ruminal variables (pH, N-NH3 and VFA), and nitrogen balance.
Material and methods
Experimental site and animal care
The experiment was conducted at Animal Metabolism Laboratory of Faculdade de Medicina Veterinária e Zootecnia, Universidade Federal de Mato Grosso do Sul (Campo Grande, Mato Grosso do Sul, Brazil). The experiment was conducted according to the institutional Ethics Committee on Animal Use under case no.: 577/2013.
Animals, management and treatments
Five male sheep (½ Suffolk + ½ Santa Ines) with a permanent cannula inserted in the rumen and, initial mean body weight (BW) of 46.50 ± 5.45 kg were used in the study. The sheep were housed in special cages for metabolism studies that are suitable for in vivo digestibility assays. These cages had a slatted wood floor and contained a feeder, drinking fountain, and a galvanized steel supplement for urine collection. The cages were housed in a covered shed with good ventilation.
The animals were fed with chopped Coast-cross hay (Cynodon dactylon (L.) Pers.) and concentrate (Table 1). The concentrate formulation contained fine ground corn (700 g kg-1), soybean meal (260 g kg-1) and mineral premix (40 g kg-1). The experimental treatments included growth promoters additives in the concentrate as follows: HAY (hay only); CONT (hay + concentrate); MON (hay + concentrate + monensin), SALI (hay + concentrate + salinomycin), and FLAV (hay + concentrate + flavomycin). Hay was offered ad libitum, concentrate in the amount of 20 g kg-1 of BW, and additives 0.75 mg kg-1 of BW.
Table 1 Chemical composition of the concentrate and Coast-Cross hay (Cynodon dactylon (L.) Pers.)
| Item | DM (g kg-1) | Chemical composition (g kg-1 of DM)1 | |||||
|---|---|---|---|---|---|---|---|
| OM | CP | aNDFom | EE | NSC | Ashes | ||
| Concentrate2 | 870 | 904 | 188 | 214 | 24 | 479 | 96 |
| Hay | 875 | 936 | 69 | 732 | 15 | 119 | 64 |
1DM= dry matter; OM= organic matter; CP= crude protein; aNDFom= neutral detergent fiber with amylase and corrected for ashes; EE= ethereal extract; NSC= nonstructural carbohydrates (100- (Ashes + CP + aNDFom + EE; Sniffen et al10).
2 Formulation contained fine ground corn (700 g kg-1), soybean meal (260 g kg-1) and mineral premix (40 g kg-1).
The additives were weighed on an analytical balance and stored in microtubes until use. Hay and concentrate were provided in separate troughs. The hay and concentrate were provided in two meals a day, at 0007 and 0017 h. Hay intake was adjusted to provide orts of 150 g kg-1. Additives were provided only with the morning meal and mixed with the concentrate. The amount of hay and concentrate met the nutritional requirements of growing sheep with an average daily gain of 250 g d-1(1.
The experimental design was a 5 x 5 latin square. Five experimental periods of 21 d each were performed as 10 d of adaptation to treatments and 11 d of data collection. At each new experimental period, the animals were weighed after 16-h solids fasting to adjust the amounts of concentrate and additive.
Intake control and collection of feces and urine
The control of daily intake of feed and water was performed between d 11 and 15 of each experimental period by weighing the amounts of feed offered and orts. Feces and urine were collected in the same period. Water intake was controlled by measuring the quantity supplied in the morning and afternoon. Orts water was measured in the drinking fountains only in the mornings. A control drinking fountain (without animal access) was also used to measure evaporation during the day in order to assess actual water intake in the experiments. A feces collecting bag was adapted to animals to allow total collection of feces. These bags were emptied daily in the morning and afternoon at the same times. Feces were weighed, homogenized, and samples equivalent to 100 g kg-1 were stored (-20 ºC) for further analysis. Based on this information, the following parameters were evaluated: intake (offered - orts), apparent digestibility coefficients (nutrient intake - excreted nutrient/nutrient intake) of DM, OM, CP, neutral detergent fiber corrected for ashes with the use of amylase (aNDFom), ethereal extract (EE), and NSC. The TDN were estimated by the formula proposed by Sniffen et al10: TDN= digestible CP + digestible aNDFom + 2.25 * digestible EE + digestible NSC.
In addition to the feces, urine was collected for the evaluation of nitrogen balance. Urine was collected in buckets containing 100 mL of sulfuric acid (100 mL L-1) placed in the lower part of urine collectors in the metabolic cages. These buckets were emptied daily in the morning and afternoon at the same time. Samples of 100 ml L-1were collected and stored (-20 °C). For nitrogen (N) balance analysis, absorbed N was calculated by the difference between N intake and excreted in the feces, while the N retained was obtained by the difference between N intake and excreted in feces and urine.
Measurement of in situ degradability
The ruminal degradability of DM and NDF was determined from d 16 to 19 of each period using 5 x 5 cm nylon bags with a porosity of 50 μm, sealed at the edges and properly identified. These bags were weighed empty, filled with 2.5 g of hay (ground and passed through a 2 mm pore sieve), and tied with a rubber band to a metal ring to keep them closed. These bags were first soaked in water for one hour and subsequently attached to a metal chain and anchor weighing approximately 100 g. These bags were subsequently infused into the rumen via cannula at 0007 h (before feeding) and removed after the incubation times (3, 8, 16, 24, 48, 72 and 96 h). These bags were immersed in ice water immediately after removal from the rumen and washed in a washing machine for five minutes for three cycles, changing the water in each cycle. They were subsequently placed in a forced air ventilation oven at 55 ºC for 72 h and weighed after this period.
The DM soluble fraction from hay was determined with nylon bags with samples without incubation in the rumen. These bags were kept in water (38 °C) for one hour, washed in a washing machine, oven dried, and weighed. The difference between the initial and final weight was considered as the soluble fraction for each experimental period, which corresponds to the value at 0 h in the DM degradation curve. The soluble fraction “a”, insoluble fraction “b”, rate of degradation “c”, and effective degradability (ED) were calculated according to Ørskov and McDonald11 with the equation ED = a + (bxc) / (c + k), where “k” is the estimated rumen solids passage rate calculated as 0.02, 0.05, and 0.08 h-1 in the present study.
Collection of ruminal liquid samples and pH
Ruminal liquid samples were collected for the determination of VFA, pH, and N-NH3 from d 20 to 21 in each experimental period. The samples were collected at the end of the experimental period after removal of the nylon bags. At the collection time, samples were taken at zero hours (before supplementation) and at 2, 4, 8, 10, 12, 14, 16, 18, 20, 22 and 24 h after feeding in the morning and always following the same sequence among animals. The ruminal fluid collection was performed with the help of a metal shell inserted in a cloth diaper. An aliquot of approximately 100 mL of ruminal fluid was collected.
The pH was measured immediately after the collection of ruminal liquid using a digital potentiometer (B474; Micronal, São Paulo, SP, Brazil). The VFA analysis used four mL of ruminal fluid acidified with 1 mL of metaphosphoric acid (25 %) and stored at -20 °C. The N-NH3 analysis used 50 mL of ruminal liquid acidified with 1 mL of H2SO4 (50 %) and stored at -20 °C.
Chemical analysis
The analysis of the chemical composition of feeds, orts, and feces was conducted according to AOAC12 as follows: DM - method 967,03; CP- method 981,10; Ashes - method 942,05; and EE - method 920,29. The NDF content was analyzed in a Tecnal TE-149® fiber analyzer (Tecnal, Piracicaba, SP, Brazil) using 5 X 5 cm non-woven fabric (NWF) bags with 100 μm porosity. To these were added 0.5 g of sample (feed or faeces) and followed for neutral detergent analysis according to the methodology of Van Soest et al13 without sodium sulfite and using thermostable amylase (Termamyl 120 L Novozymes A/S, Bagsvaerd, Denmark). Subsequently, the NDF was corrected for ashes and the aNDFom content was calculated. The same procedure used for the NDF was used to analyze the material resulting from the in situ ruminal degradation but without the use of amylase and correction for ashes. The NSC content was calculated as proposed by Sniffen et al10 with the equation: NSC= 100 - (CP + ashes + aNDFom + EE).
The N-NH3 content analysis used the supernatant of ruminal liquid samples thawed at 4 ºC and distillation with 2N KOH according to Ribeiro et al14. The concentration of VFAs was determined by gas chromatography (Shimadzu GC-2010, Kyoto, Japan) according to the methodology described by Erwin et al15.
Statistical analyses
Statistical analyses were performed using the SAS statistical software (SAS Inst., Inc., Cary, NC). The data of intake, apparent digestibility and nitrogen balance were analyzed using ANOVA with a 5 x 5 latin square design. The statistical model used was:
Where:
Yijk = observation of the effect of treatment i in period j, of animal k, where μ is the overall mean, Ti = effect of treatment i, where i = 1 (HAY), 2 (CONT), 3 (MON), 4 (SALI), and 5 (FLAV);
Pj = effect of period j (j = 5 periods);
Ak = effect of animal k (k = 5 animals), and eijk = random error associated with each observation.
The model for the in situ degradation rate included the experimental treatment, incubation time, animal, period, and treatment × time. The experimental design was the latin square with subdivided plots for the ruminal variables data (VFA, pH, and N-NH3), where the plots were the treatments and subplots were ruminal liquid samples. The statistical model included treatment effects, sampling times, animal, period, and treatment × time. The statistical model used was:
Where:
Yijkl = observation of the effect of treatment i per hours of incubation (rate of degradation) or collection time (ruminal parameters) j in animal k; μ = overall mean; Ti = effect of treatment (i = 1 (Hay), 2 (CONT), 3 (MON), 4 (SALI), and 5 (FLAV);
Hj = effect of incubation hours for degradability (j = 1,....., 7) or collection times for ruminal parameters (j = 1, ....., 13);
Ak = animal effect (k= 1, ..., 5), Pj = the period effect (j= 1, ....., 5);
THij = interaction between treatment i and time j; and eijkl= random error associated with each observation.
When significant (P≤0.05) F-statistics were noted, means were separated using a multiple comparison test (Tukey’s method) and treatment differences were considered significant at P≤0.05.
Results
The supply of concentrate with or without additives (CONT, MON, SALI, and FLAV) affected the intake (P≤0.05) of DM, OM, and nutrients in kg day-1 or g kg-1of BW when compared to the treatment HAY (Table 2). The animals of the HAY treatment showed higher (P≤0.05) DM and nutrients intake from hay, however, their total DM and total nutrient intake was lower (P≤0.05) than those receiving the treatments with the concentrate. The inclusion of concentrate did not show a significant difference (P>0.05) on total aNDFom and EE (g kg-1 of BW). No effects of the inclusion of MON, SALI, and FLAV in the diet was observed (P>0.05) on the intake of hay DM, total DM, and nutrients in kg d-1 or g kg-1of BW. The water intake increased (P≤0.05) with the addition of concentrate in the diets, however, no effect was observed from the use of additives.
Table 2 Effect of the inclusion of concentrate and antimicrobial growth promoters’ additives in sheep diet on intake of DM, OM, CP, aNDFom, EE, NSC, and ashes of hay and total diet (hay + concentrate)
| Intake of1 | Treatments2 | SEM | P-value | ||||
|---|---|---|---|---|---|---|---|
| HAY | CONT | MON | SALI | FLAV | |||
| kg day-1 | |||||||
| DM Hay | 1.01a | 0.68b | 0.65b | 0.73b | 0.65b | 0.050 | 0.0018 |
| DM Total | 1.01a | 1.56b | 1.57b | 1.62b | 1.54b | 0.070 | 0.0004 |
| OM Hay | 0.95a | 0.64b | 0.61b | 0.68b | 0.62b | 0.047 | 0.0021 |
| OM Total | 0.95a | 1.43b | 1.44b | 1.49b | 1.42b | 0.065 | 0.0005 |
| CP Hay | 0.08a | 0.05b | 0.05b | 0.05b | 0.05b | 0.004 | 0.0006 |
| CP Total | 0.08a | 0.22b | 0.22b | 0.22b | 0.22b | 0.008 | ≤0.0001 |
| aNDFom Hay | 0.74a | 0.49b | 0.47b | 0.53b | 0.48b | 0.037 | 0.0023 |
| aNDFom Total | 0.74 | 0.68 | 0.67 | 0.72 | 0.67 | 0.042 | 0.7163 |
| EE Hay | 0.01 | 0.01 | 0.01 | 0.01 | 0.01 | 0.002 | 0.5565 |
| EE Total | 0.01b | 0.03a | 0.03a | 0.03a | 0.03a | 0.002 | ≤0.0001 |
| NSC Hay | 0.12a | 0.08b | 0.08b | 0.09b | 0.08b | 0.006 | 0.0053 |
| NSC Total | 0.12a | 0.50b | 0.52b | 0.51b | 0.51b | 0.019 | ≤0.0001 |
| Ashes Hay | 0.06a | 0.04b | 0.04b | 0.05b | 0.04b | 0.003 | 0.0002 |
| Ashes Total | 0.06a | 0.13b | 0.13b | 0.13b | 0.13b | 0.005 | ≤0.0001 |
| Water (L day-1) | 2.44a | 3.74b | 4.03b | 4.06b | 3.86b | 0.192 | 0.0003 |
| g kg -1 of BW | |||||||
| DM Hay | 19.23a | 13.44b | 12.45b | 14.69b | 12.93b | 1.209 | 0.0150 |
| DM Total | 19.23a | 30.80b | 29.83b | 32.10b | 30.33b | 1.223 | ≤0.0001 |
| OM Hay | 18.02a | 12.62b | 11.68b | 13.76b | 12.13b | 1.150 | 0.0168 |
| OM Total | 18.02a | 28.30b | 27.38b | 29.49b | 27.85b | 1.155 | 0.0001 |
| CP Hay | 1.42a | 1.07b | 0.93b | 1.10b | 0.99b | 0.073 | 0.0056 |
| CP Total | 1.42a | 4.33b | 4.2b | 4.37b | 4.27b | 0.073 | ≤0.0001 |
| aNDFom Hay | 14.07a | 9.75b | 9.08b | 10.65b | 9.37b | 0.905 | 0.0161 |
| aNDFom Total | 14.07 | 13.46 | 12.79 | 14.37 | 13.05 | 0.915 | 0.7349 |
| EE Hay | 0.30 | 0.21 | 0.21 | 0.25 | 0.18 | 0.024 | 0.0533 |
| EE total | 0.30a | 0.61b | 0.62b | 0.66b | 0.59b | 0.028 | ≤0.0001 |
| NSC Hay | 2.23a | 1.59b | 1.45b | 1.76b | 1.58b | 0.164 | 0.0450 |
| NSC Total | 2.23a | 9.89b | 9.77b | 10.08b | 9.94b | 0.165 | ≤0.0001 |
| Ashes Hay | 1.22a | 0.83b | 0.78b | 0.94b | 0.80b | 0.063 | 0.0028 |
| Ashes Total | 1.22a | 2.49b | 2.45b | 2.61b | 2.48b | 0.070 | ≤0.0001 |
| Water (ml kg-1 of BW) | 45.35a | 74.77b | 76.11b | 80.06b | 76.37b | 3.166 | ≤0.001 |
1DM= dry matter; OM= organic matter; CP= crude protein; aNDFom= neutral detergent fiber with amylase and corrected for ashes; EE= ethereal extract; NSC= nonstructural carbohydrates (100- (Ashes + CP + aNDFom + EE; Sniffen et al10).
2Treatments: HAY (hay only), CONT (hay + concentrate), MON (hay + concentrate + monensin), SALI (hay + concentrate + salinomycin), FLAV (hay + concentrate + flavomycin).
ab Means followed by different letters in the same row are significantly different (Tukey, P≤0.05).
The treatments with concentrate showed higher (P≤0.05) DM, OM, CP, EE, and NSC digestibility when compared to the treatment HAY (Table 3). No difference (P>0.05) in aNDFom digestibility was observed resulting in an increase in total digestible nutrients (TDN). The inclusion of additives (MON, SALI, and FLAV) did not affect the digestibility of DM, OM, EE, aNDFom, NSC, EE, and TDN when compared to the CONT group (P>0.05).
Table 3 Effect of the inclusion of concentrate and antimicrobial growth promoters’ additives in sheep diet on the apparent digestibility coefficients of DM, OM, CP, EE, aFDNom, and NSC
| Digestibility of1 | Treatments2 | SEM | P-value | ||||
|---|---|---|---|---|---|---|---|
| HAY | CONT | MON | SALI | FLAV | |||
| DM (fraction 0-1) | 0.54a | 0.67b | 0.67b | 0.64b | 0.66b | 0.028 | 0.0305 |
| Digestible amount (g kg DM-1) | |||||||
| OM | 563.69a | 685.58b | 700.04b | 664.79b | 700.15b | 24.418 | 0.0142 |
| CP | 636.25a | 819.29b | 803.30b | 756.69b | 852.49b | 29.610 | 0.0036 |
| EE | 498.05a | 723.88b | 782.96b | 786.39b | 674.80b | 41.600 | 0.0027 |
| aNDFom | 530.03 | 420.43 | 416.17 | 438.04 | 427.30 | 49.845 | 0.2004 |
| NSC | 507.27a | 883.04b | 877.02b | 871.69b | 888.30b | 23.749 | ≤0.0001 |
| TDN | 519.70a | 618.92b | 616.82b | 610.36b | 628.44b | 24.335 | 0.0197 |
1DM= dry matter; OM= organic matter; C= crude protein; aNDFom= neutral detergent fiber with amylase and corrected for ashes; EE= ethereal extract; NSC= nonstructutal carbohydrates (100- (Ashes + CP + aNDFom + EE; Sniffen et al10).
2Treatments: HAY (hay only), CONT (hay + concentrate), MON (hay + concentrate + monensin), SALI (hay + concentrate + salinomycin), FLAV (hay + concentrate + flavomycin).
ab Means followed by different letters in the same row are significantly different (Tukey, P≤0.05).
The in situ disappearance rates of DM (Figure 1A) and NDF (Figure 1B) of hay were influenced by the experimental treatments and incubation times (P≤0.05). The in situ disappearance rates of DM and NDF at 3, 8, and 96 h of incubation did not show a significant difference between treatments. However, the treatment HAY only at 16, 24, 48, and 72 h of incubation showed disappearance rates higher than those in treatments with the concentrate. Comparing the influence of additives in relation to the CONT group, no difference was observed in the disappearance rate of DM and NDF (P>0.05). The HAY treatment presented potential DM and NDF degradation at 48 h of incubation. Conversely, this was observed in treatments with the concentrate at 72 h.
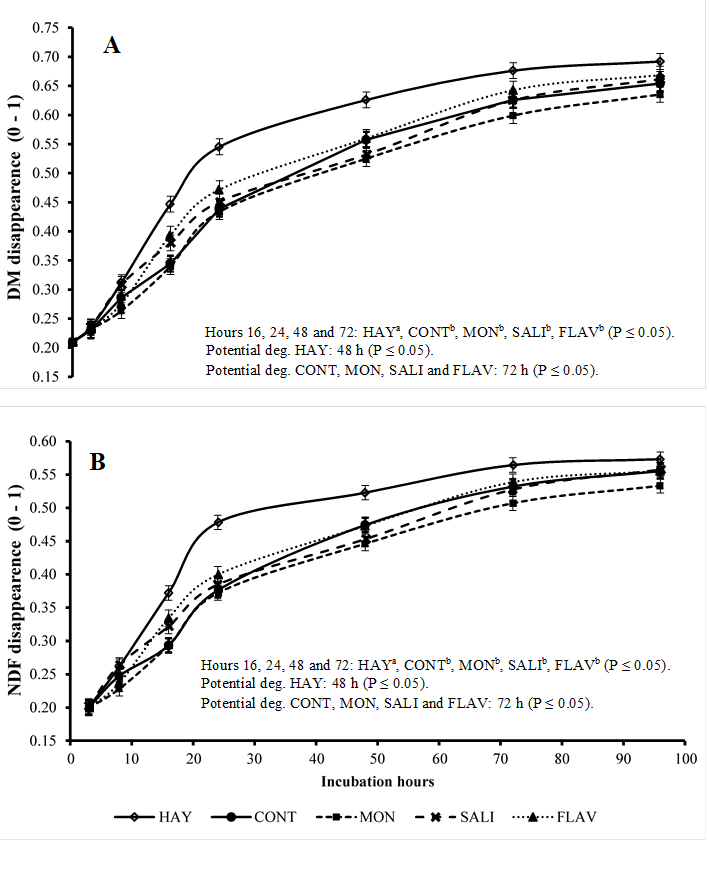
HAY (hay only), CONT (hay + concentrate), MON (hay + concentrate + monensin), SALI (hay + concentrate + salinomycin), FLAV (hay + concentrate + flavomycin). Vertical bars represent the standard deviation; Potential deg: represents the incubation time of hay needed to achieve potential degradation.
Figure 1 Disappearance of dry matter (DM) (figure A) and neutral detergent fiber (NDF) (figure B) of hay (expressed as a fraction of 0-1) in the rumen of sheep
For the ruminal variables of hay DM degradation, the inclusion of concentrate in the diet reduced (P≤0.05) the fraction "b" and the ED calculated at 0.02 and 0.05 h-1 and did not change (P>0.05) the "c" fraction and the ED calculated at 0.08 h-1 (Table 4). The inclusion of concentrate reduced (P≤0.05) fraction “c” and the calculated ED (at 0.02, 0.05, and 0.08 h-1; P≤0.05) and did not change fraction “b” in the ruminal variables of Hay NDF degradation. The additives did not change these variables.
Table 4 Effect of the inclusion of concentrate and antimicrobial growth promoters’ additives in sheep diet on the estimation of the ruminal parameters of DM and NDF degradation of hay (values are expressed as the fraction of 0-1)
| Parameters1 | Treatments2 | SEM | P-value | ||||
|---|---|---|---|---|---|---|---|
| HAY | CONT | MON | SALI | FLAV | |||
| DM (a=0.210) | |||||||
| b | 0.482a | 0.445ab | 0.426b | 0.452ab | 0.454ab | 0.009 | 0.0112 |
| c | 0.055 | 0.050 | 0.035 | 0.034 | 0.039 | 0.008 | 0.2723 |
| ED (0.02 h-1) | 0.709a | 0.659ab | 0.613b | 0.625b | 0.653ab | 0.019 | 0.0146 |
| ED (0.05 h-1) | 0.565a | 0.521ab | 0.471b | 0.477b | 0.505ab | 0.020 | 0.0456 |
| ED (0.08 h-1) | 0.486 | 0.450 | 0.402 | 0.406 | 0.430 | 0.020 | 0.0679 |
| NDF | |||||||
| b | 0.573 | 0.555 | 0.533 | 0.557 | 0.584 | 0.013 | 0.1810 |
| c | 0.048a | 0.033ab | 0.032ab | 0.028b | 0.032ab | 0.004 | 0.0289 |
| ED (0.02 h-1) | 0.401a | 0.347ab | 0.324b | 0.320b | 0.363ab | 0.017 | 0.0359 |
| ED (0.05 h-1) | 0.277a | 0.223ab | 0.205b | 0.198b | 0.231ab | 0.015 | 0.0277 |
| ED (0.08 h-1) | 0.212a | 0.164ab | 0.150b | 0.143b | 0.169ab | 0.013 | 0.0252 |
1DM= dry matter; a= soluble fraction; b= insoluble fraction potentially degradable; c= degradation rate (/h); ED= effective degradation (considering a degradation rate of 0.02, 0.05, and 0.08 h-1), NDF= neutral detergent fiber.
2Treatments: HAY (hay only), CONT (hay + concentrate), MON (hay + concentrate + monensin), SALI (hay + concentrate + salinomycin), FLAV (hay + concentrate + flavomycin).
ab Means followed by different letters in the same row are significantly different (Tukey, P≤0.05).
Table 5 shows that the HAY treatment showed lower production (P≤0.05) in mmol L-1 of total acetate, propionate, butyrate, and total VFA and higher acetate:propionate ratio when compared to treatments with the concentrate (CONT, MON, SALI, and FLAV). When evaluated in mmol 100 mmol-1, the HAY treatment showed a higher (P≤0.05) proportion of acetate and lower (P≤0.05) of propionate and butyrate when compared to treatments with the concentrate.
Table 5 Effect of the inclusion of concentrate and antimicrobial growth promoters’ additives in sheep diet on the production of short-chain fatty acids in the rumen
| Item | Treatments1 | SEM | P-value2 | ||||||
|---|---|---|---|---|---|---|---|---|---|
| HAY | CONT | MON | SALI | FLAV | Treat | h | Treat×h | ||
| Fatty acids (mmol L -1 ) | |||||||||
| Acetate | 78.30b | 90.15a | 84.80a | 90.90a | 89.93a | 2.083 | ≤0.001 | ≤0.001 | 0.4278 |
| Propionate | 12.25d | 21.37c | 24.98a | 24.14ab | 21.43bc | 0.759 | ≤0.001 | 0.0002 | 0.9995 |
| Butyrate | 4.09d | 10.64b | 9.15c | 9.49bc | 12.08a | 0.333 | ≤0.001 | 0.0262 | 0.9840 |
| Total VFA | 94.64b | 122.16a | 118.93a | 124.53a | 123.44a | 2.776 | ≤0.001 | ≤0.001 | 0.6340 |
| Acetate:propionate ratio | 6.39a | 4.21b | 3.39c | 3.77b | 4.19b | 0.120 | ≤0.001 | 0.6263 | 0.9993 |
| Fatty acids (mmol 100 mmol -1 ) | |||||||||
| Acetate | 82.61a | 73.94b | 71.26vc | 73.15b | 73.02bc | 0.478 | ≤0.001 | 0.9540 | 0.9992 |
| Propionate | 13.06d | 17.35c | 21.01a | 19.14b | 17.36c | 0.422 | ≤0.001 | 0.6102 | 1.0000 |
| Butyrate | 4.32d | 8.7b | 7.73c | 7.71c | 9.62a | 0.264 | ≤0.001 | 0.6895 | 0.9996 |
1Treatments: HAY (hay only), CONT (hay + concentrate), MON (hay + concentrate + monensin), SALI (hay + concentrate + salinomycin), FLAV (hay + concentrate + flavomycin).
2Treat= treatment.
ab Means followed by different letters in the same row are significantly different (Tukey, P≤0.05).
Analyzing the effects of the additives (MON, SALI and FLAV) in relation to the CONT in mmol L-1, the acetate production was not altered (P>0.05). MON and SALI increased (P≤0.05) the propionate production in relation to that in the CONT and FLAV did not differ from these. FLAV induced the highest (P≤0.05) production of butyrate, MON the lowest (P≤0.05), and SALI did not differ from the CONT and MON. The total VFA production of the additives did not differ from the CONT. The acetate:propionate ratio was the smallest (P≤0.05) in the MON treatment compared to the other treatments. When evaluated in mmol 100 mmol-1, the MON presented lower (P≤0.05) acetate production than CONT and SALI, but did not differ from FLAV. The CONT, SALI and FLAV groups did not differ. The highest (P≤0.05) proportion of propionate was produced in the MON treatment, followed by the SALI, FLAV, and CONT. The latter two did not differ. The highest (P≤0.05) proportion of butyrate was observed in the FLAV treatment followed by the CONT, MON and SALI. The latter two did not differ.
The inclusion of concentrate in the diets reduced (P≤0.05) the ruminal pH in relation to the HAY treatment (Figure 2A) at all evaluated time points. No difference in pH was observed as the result of additives. The use of the concentrate caused a high pH variation throughout the day, with maximum values of 6.46 and minimum of 5.68. The lowest values were observed between 2 and 4 h after feeding.
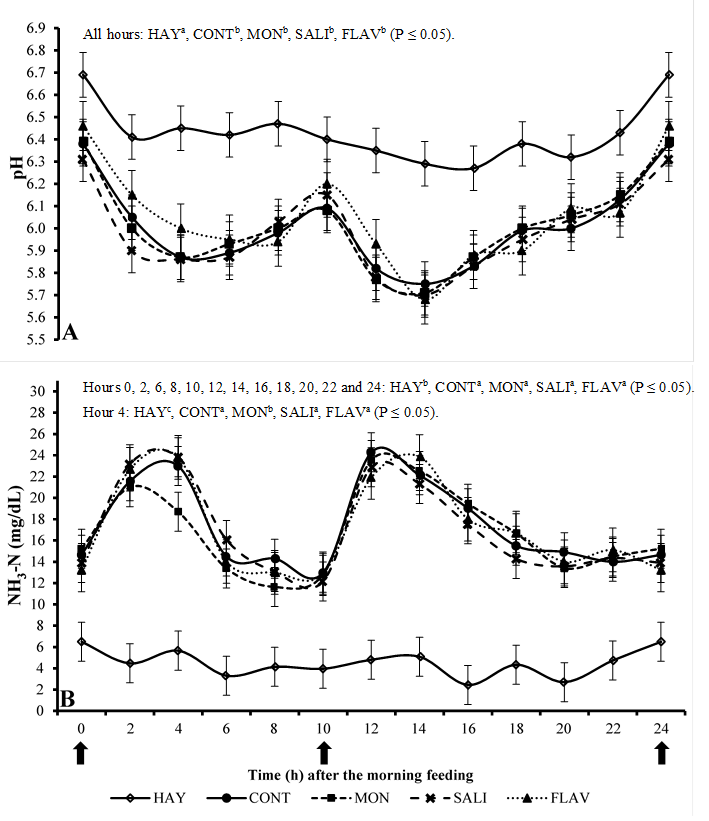
HAY (hay only), CONT (hay + concentrate), MON (hay + concentrate + monensin), SALI (hay + concentrate + salinomycin), FLAV (hay + concentrate + flavomycin). Vertical bars represent the standard deviation
Figure 2 Mean values of pH (Figure A) and ammoniacal nitrogen (NH3-N; Figure B) in the rumen of sheep at different collection times
The inclusion of concentrate in the diet increased (P≤0.05) the production of N-NH3 in relation to the HAY treatment at all evaluated time points (Figure 2B). MON was the only additive showing some effect (P≤0.05) compared to the CONT treatment by reducing the N-NH3 concentration only at four hours after the morning feeding. No effect of the other additives was observed for this variable.
The use of the concentrate increased (P≤0.05) nitrogen intake (Table 6) despite the fecal and urine losses, the amount absorbed and retained was higher (P≤0.05) than that observed in the HAY treatment. No significant difference was observed in nitrogen intake with the use of additives.
Table 6 Effect of the inclusion of concentrate and antimicrobial growth promoters’ additives in sheep diet on nitrogen balance
| Intake of | Treatments1 | SEM | P-value | ||||
|---|---|---|---|---|---|---|---|
| HAY | CONT | MON | SALI | FLAV | |||
| g day -1 | |||||||
| N intake - hay | 12.18a | 8.67b | 7.72b | 8.79b | 7.98b | 0.458 | 0.0001 |
| N intake - concentrate | 0.00a | 26.57b | 27.76b | 26.73b | 27.32b | 1.153 | ≤0.0001 |
| N intake - total | 12.18a | 35.24b | 35.48b | 35.51b | 35.30b | 1.193 | ≤0.0001 |
| N fecal | 3.50a | 6.34b | 5.92b | 7.01b | 6.41b | 0.550 | 0.0072 |
| N absorbed | 8.68a | 28.91b | 29.56b | 28.50b | 29.22b | 0.838 | ≤0.0001 |
| N urinary | 3.04a | 11.11b | 14.42b | 12.13b | 12.51b | 1.181 | ≤0.0001 |
| N fecal + urinary | 6.54a | 17.45b | 20.34b | 19.15b | 18.59b | 1.459 | 0.0001 |
| N retained | 5.65a | 17.80b | 15.14b | 16.37b | 16.70b | 1.444 | ≤0.0001 |
| g kg -1 of N intake | |||||||
| N absorbed | 706.22a | 818.70b | 833.60b | 803.72b | 825.92b | 20.967 | 0.0060 |
| N retained | 454.82 | 501.56 | 428.58 | 468.36 | 471.22 | 52.691 | 0.7101 |
| g kg -1 of BW | |||||||
| N intake - hay | 0.23a | 0.17b | 0.15b | 0.18b | 0.16b | 0.011 | 0.0200 |
| N intake - concentrate | 0.00a | 0.52b | 0.52b | 0.52b | 0.52b | 0.002 | ≤0.0001 |
| N intake - total | 0.23a | 0.69b | 0.67b | 0.70b | 0.68b | 0.011 | ≤0.0001 |
| N fecal | 0.07a | 0.13b | 0.11b | 0.14b | 0.12b | 0.009 | 0.0012 |
| N absorbed | 0.16a | 0.57b | 0.56b | 0.56b | 0.56b | 0.010 | ≤0.0001 |
| N urinary | 0.06a | 0.22b | 0.27b | 0.23b | 0.24b | 0.016 | ≤0.0001 |
| N fecal + urinary | 0.13a | 0.35b | 0.38b | 0.37b | 0.36b | 0.019 | ≤0.0001 |
| N retained | 0.10a | 0.35b | 0.29b | 0.33b | 0.32b | 0.020 | ≤0.0001 |
1Treatments: HAY (hay only), CONT (hay + concentrate), MON (hay + concentrate + monensin), SALI (hay + concentrate + salinomycin), FLAV (hay + concentrate + flavomycin).
ab Means followed by different letters in the same row are significantly different (Tukey, P≤0.05).
Discussion
Effect of concetrate
The inclusion of concentrate in the diet, increased the intake of MS and nutrients (Table 2). The lowest intake observed in the HAY treatment, could be the result of a ruminal physical limitation in sheep. The hay intake may have caused greater filling and ruminal distension that, according to Grovum16, provoke inhibitory neural stimulus from the hunger center reducing feed intake. The addition of concentrate, is known to increase the passage rate, providing limiting nutrients, such as nitrogen and sulfur, to ruminal microorganisms and leading to a high rate of multiplication of microorganism17 and consequently reflecting increased intake.
The inclusion of concentrate in the diet, increased the digestibility of DM and other nutrients (with the exception of aNDFom). According to Hagos and Melaku18, the lowest concentration of CP and highest of aNDFom in the HAY treatment may have reflected low microbial efficiency, leading to a low level of nutrients’ fermentation and consequently lower digestibility.
The absence of improvement in the aNDFom digestibility as well as the reduction in the degradability of DM and NDF by the inclusion of concentrate may have occurred because the inclusion of rapidly fermentable carbohydrates, leads to a reduction in ruminal pH, and increased development of amylolytic, and decreased development of cellulolytic bacteria19,20. These microbial alterations reduce the production of fibrolytic enzymes and consequently negatively affect fiber degradability and digestibility.
The inclusion of concentrate in the diet increased the total production of VFA and proportions of propionate and butyrate, and a reduction in the acetate proportion and acetate:propionate ratio. The alteration in the VFA production with the inclusion of concentrate in the diet was probably the result of changes in the microbial population of the rumen, which is altered according to the type of substrate available. According to Wanapat and Khampa20, the inclusion of concentrate in the diet, increases the number of protozoa and amylolytic and proteolytic bacteria, and reduces the number of fungi and cellulolytic bacteria. These alterations cause changes in the type and quantity of VFA produced.
The lowest ruminal pH was observed in treatments containing concentrate. Rumen microorganisms ferment carbohydrates producing VFA and lactate, which have an acidogenic effect. Therefore, the inclusion of rapidly fermentable carbohydrates in the diet increases the fermentation rate and production of these compounds, reducing the pH3,17. In addition, the inclusion of the concentrate is usually associated with less rumination and chewing with the consequent low production of saliva and diet buffer capacity19,21. The treatment HAY, showed a low daily pH variation because the animals showed gradual intake throughout the day. Conversely, the treatments with the concentrate, presented a high pH variation during the day because the supplied concentrate was quickly consumed, reflecting subsequent drops in pH values, with the smallest values observed between 2 and 4 h after the feeding. The lowest pH values of 5.68 and 6.27 were observed in the treatments with the concentrate and hay, respectively. According to Hoover and Stokes22, these values are within the range suitable for maximum microbial growth and maximal ruminal digestion of fibers (5.5 to 7.0) and the great pH range for fiber digestion is from 6.7 to 7.1.
The highest concentration of ruminal N-NH3 was observed with the inclusion of concentrate. According to Van Soest19, protein degradation in the rumen occurs through the action of enzymes secreted by ruminal microorganisms. These bacteria digest part of the protein, and others microorganisms on site use amino acids, peptides, and ammonia for cell multiplication. When the rate of ammonia production is greater than the rate of use, it is absorbed by the animal through the rumen wall passing into the blood stream and converting into urea in the liver. Urea can be recycled or lost through the urine. Excessive values are reached by a high inclusion of concentrate in the diets and are not desired.
The treatment HAY presented a low daily variation of N-NH3 (Figure 2B) because the animals gradually consumed the feed throughout the day. On the other hand, as observed in the pH analysis, the treatments with concentrate showed a high variation due to the fast intake of concentrate causing peaks of ammonia production between 2 and 4 h after feeding. These increased levels occurred as the result of high amounts of CP from the concentrate (188 g kg-1), increasing its rumen degradation rate and producing N-NH3 peaks.
There was an increase in the amount of absorbed and retained N (g d1 or g kg-1 of CP) with the inclusion of the concentrate in the diet. This happened probably due to the high N intake and high N digestibility contained in the concentrate compared to those in HAY. However, when the amount of N retained in g kg-1 of the N ingested was analyzed, the absence of increased efficiency in the use of ingested N with the inclusion of concentrate was probably resulting from the low flow rate displayed in the HAY treatment, which improved the efficiency of N use, producing results similar to those in the concentrate treatments. The inclusion of concentrate resulted in high losses of N, mainly through urine. This may have been due to a low efficiency of the urea cycle, which is a reflection of peaks of N-NH3 production and less saliva production with the inclusion of concentrate19. Because the inclusion of concentrate reflects less chewing and rumination time21, less saliva is produced, and less nitrogen is recycled in this way, which ends up being eliminated in the urine.
Effect of additives
The inclusion of additives did not alter the DM and nutrients intake. However, ionophores are known to have an effect on DM ingestion leading to reduced intake when used in diets with a high proportion of concentrate23,24. This effect may occur as a consequence of an increase in the concentration of ruminal propionic acid, which reflects an increase in energy efficiency, allowing nutritional requirements to be reached with a smaller amount of feed intake7. This intake is also affected by pathophysiological aspects such as ruminal pH. Thus, a diet that induces rumen acidosis, with the addition of ionophores, may lead to a smaller pH drop, increasing intake25. However, in this experiment, besides the high hay intake (approximately 430 g kg-1 of the diet), the diets were all cationic, which produces an alkalizing effect that may have caused the lack of effects of additives on the intake.
The inclusion of additives did not alter the digestibility of the diet. However, ionophores can increase dietary digestibility by increasing the DM retention time in the rumen as the result of lower voluntary intake, stimulating rumination, improving the ruminal environment, and allowing increased digestibility26. However, this effect was not observed in this study because the additives did not alter the intake.
The additives did not influence the degradability of hay. Ionophores are known to alter the microbial population of the rumen and act on cellulolytic bacteria, which can lead to a reduction in fiber degradability27. Nevertheless, it is probably easier to observe these effects in diets with higher proportions of roughage. Edward et al5 report in an in vitro experiment that cellulolytic Gram-negative bacteria of the genus Fibrobacter are among the most sensitive to the action of flavomycin. According to these same authors, flavomycin normally does not decrease fiber degradation in in vitro and in vivo studies. Therefore, it is probable that the cellulolytic activities of bacteria of the genus Ruminococcus, fungi, and protozoa, which are not affected by this antibiotic and are in the microorganism's rumen population, compensate decreased numbers of Fibrobacter bacteria that could affect fiber degradation.
The additives altered the production of VFA. Ionophores cause such alterations in the production of VFAs by modifying bacterial populations of the rumen. Gram-positive bacteria that produce acetate, butyrate, and H2 are inhibited by ionophores, and Gram-negative bacteria that produce propionate find better conditions to reproduce28. The production of butyrate was increased in FLAV. (Thus, the response from the effect of flavomycin on the proportion of VFA differs from that from ionophores, which promotes an increase in the proportion of propionate. The action of flavomycin, not exactly on the same microorganisms, possibly reflects these alterations.
The additives did not alter the ruminal pH. This happened probably due to the high proportion of hay in the diet (approximately 430 g kg-1 diet) inducing longer intake time, regurgitation, and saliva production resulting in a small drop in ruminal pH and not allowing the demonstration of these antibiotics’ effects.
The reduction in the concentration of N-NH3 during the first peak of production (only 4 h after the morning feeding) was only detected in the diet with MON. This response is associated with the reduction in the number of bacteria that use amino acids and peptides as an energy source for their growth, and consequently, release ammonia in the ruminal environment. This reduction in the use of amino acids and peptides favors their passage into the small intestine and absorption, increasing the efficiency in the use of nitrogen29.
No effect was observed from additives on nitrogen balance. Nevertheless, the ionophores may promote an improved utilization of dietary nitrogen, as a result of reduced DM intake, consequent reduction of nitrogen intake, and reduced rumen deamination30. In this study, the use of additives did not alter DM intake, and salinomycin and flavomycin did not alter the concentration of N-NH3. Therefore, the absence of an effect on the total nitrogen balance was expected. Although MON reduced the ammonia peak production after the morning feeding, this was not enough to alter the nitrogen balance.
Conclusions and implications
The addition of concentrate to the sheep diet caused alterations in the intake, digestibility, ruminal variables (VFA, pH, and N-NH3), and nitrogen balance. MON, SALI, and FLAV altered the production of VFA, however, only MON reduced the production of N-NH3. Among the tested additives, monensina caused the most beneficial changes in the ruminal metabolism of sheep.

