


Serviços Personalizados
Journal
Artigo
 texto em
  Inglês (pdf)
 Artigo em XML
 Referências do artigo
 Enviar este artigo por email
Indicadores
-
 Citado por SciELO
 -
 Acessos
Links relacionados
-
 Similares em
SciELO
Similares em
SciELO
Compartilhar

 Permalink
Revista mexicana de ciencias pecuarias
versão On-line ISSN 2448-6698versão impressa ISSN 2007-1124
Rev. mex. de cienc. pecuarias vol.10 no.1 Mérida Jan./Mar. 2019
https://doi.org/10.22319/rmcp.v10i1.4540
Technical Notes
Design of an electrochemical prototype to determine relative NaCl content and its application in fresh cheeses
aUniversidad Autónoma de Nuevo León. Facultad de Agronomía. Francisco Villa s/n, Ex Hacienda El Canada, 66050. Escobedo, Nuevo León, México.
bFood and Feed Safety Research Unit, Southern Plains Agricultural Research Center, USDA, TX, USA.
cInstituto Tecnológico de Parral, Chihuahua, México.
dUniversidad Autónoma de Chihuahua. Facultad de Ciencias Químicas. Chih, México.
An electrochemical prototype (ECP) was developmed and evaluated to determine NaCl electrical variables [volt (V), ampere (A), resistance (R) and power (P)] and its use in fresh cheeses. The ECP circuit consisted of two electrodes, an aluminum (anode) and a copper (cathode). The experimental parameters established in the ECP were distance between electrodes and the presence of a resistor. Seven treatment solutions were examined at 0, 2, 4, 6, 8, 10 and 12 g of NaCl/100 mL of water. Cheeses evaluated were a commercial cheese (Control) and a commercial light cheese. Treatment influenced (P<0.05) the electrical variables in NaCl solutions and cheeses. Regression analysis showed that the best fit was a quadratic model for the ECP. Prototype results showed that at higher NaCl concentrations, voltage and resistance decreased, while amperage and power increased.
Key words: Adulteration; Cheese; Electrical potential; NaCl content; Quality assurance
Se desarrolló y evaluó un prototipo electroquímico (PEQ) para la medición de variables eléctricas [voltios (V), amperaje (A), resistencia (R) y potencia (P)] en soluciones que contienen NaCl y se probó en quesos frescos. El circuito del PEQ consistió en dos electrodos (un ánodo de aluminio y un cátodo de cobre), un multímetro y una resistencia. Los parámetros experimentales establecidos en el PEQ fueron la distancia entre electrodos (0.5 o 4.0 cm) y la presencia de la resistencia. Se evaluaron siete tratamientos (soluciones) con diferentes concentraciones de NaCl: 0, 2, 4, 6, 8, 10 y 12 g de NaCl/100 ml de agua. Los quesos evaluados fueron un queso comercial (control) y otro “light” (bajo en calcio, sodio y grasa). Las variables eléctricas difirieron (P<0.05) entre los tratamientos y entre los quesos. Un análisis de regresión mostró que un modelo cuadrático dio el mejor ajuste para el PEQ. Los resultados indicaron que a mayores concentraciones de NaCl el voltaje y la resistencia disminuyeron mientras que el amperaje y la potencia aumentaron. El prototipo electroquímico detectó estos cambios de manera rápida y eficaz tanto en soluciones salinas como en quesos frescos, demostrando que es una técnica válida para el análisis de la composición de productos lácteos.
Palabras clave: Adulteración; Queso; Potencial eléctrico; NaCl; Control de calidad
Today, inappropriate eating habits have serious impacts on human health. Food intake with high levels of simple sugars, fats and mineral components such as NaCl present problems associated with obesity, hypertension, and chronic degenerative diseases. In the dairy industry, milk adulteration presents significant problems such as economic loss, deterioration of product quality, and threats to consumer health1. Therefore, the dairy industry employs several often expensive and time consuming chemical and physical tests to determine fat and total solids content1. Thus, technological alternatives based on electrical circuits have been used to assess the quality of milk2,3, conductance effects of milk components4, the presence of adulterants1, and to evaluate fat content5. Electrical circuit technology also has been applied to cheese to study dielectric properties for thermodynamic analysis of salt6, and fractal and dynamic analysis of water7.
Electrical conduction properties of a material represent its ability to interact in an electric current4,8. Electrical properties of meat, milk, fruits and derivatives are dependent on the chemical composition, measurement parameters of the current, and the experimental conditions1. Foods containing positively or negatively charged electrolytes, charged molecules, or charged macromolecules are capable of transmitting an electric current9. In the case of foods, it is necessary to have mobile “carriers” for the cations and anions, being influenced by salinity, formulation, aggregation state, molar mass, link type, charge and the number of charged carriers9,10.
According to Figura and Teixeira9, an electric current (I) will flow through a food sample containing ions as part of an electrical circuit. The strength of the electric current will be determined by the electrical resistance [R; 1 volt (V) * ampere (A-1) = 1 Ohm (Ω)] of the food sample, where R limits the flow of electric current through the sample. Therefore, a linear relationship exists between voltage [V represented as U], current, A, and electrical resistance, R, within an electrical circuit, which is known as Ohm's Law [I = (1/R)*U; o I = G * U]. In order to be independent of sample and circuit geometry in performing certain types of calculations, it is necessary to introduce material properties, specific electrical resistivity (ρ; in Ω*m), and specific conductivity (κ; in S*m-1); where κ depends only phase state, moisture content, and chemical composition, and not sample size, expressed as R = ρ * (Ɩ/A) or κ = 1/ρ, where Ɩ is length in m, and A is current area in m2(9,11.
Milk is an electrolyte characterized by ionic conductivity due to its high water content and minerals content5, as determined by: 1) Current measurements including voltage, frequency, pulse shape and type of electric current (direct, variable, alternating); 2) Chemical composition of fresh material [water content and ion (Ca, Na, K, Mg, Cl) concentrations and components of dry matter such as fats, proteins and sugars]; 3) The experimental conditions, especially temperature. Meanwhile, cheese is a colloidal system consisting of protein, fat and an aqueous phase in electrical balance where salt is a common component used in the dairy industry to preserve cheese quality6.
In this study, an electrochemical prototype (ECP) was developed and evaluated to measure NaCl concentration as alternative to evaluate the NaCl fastly. The ECP consists of an experimental galvanic cell to generate electricity through a spontaneous redox reaction12, and includes two electrodes and an ionic conductor, which may be a liquid or a solid13. The objective of this study was to develop and evaluate the ECP consisting of a copper cathode and an aluminum anode, and an ionic conductor (NaCl solutions and fresh commercial cheeses) to measure voltage, electric current, resistance and power as reflections of NaCl content.
The research was conducted at the Laboratory of Environmental Remediation and Soils Analysis, Water and Plant of the Facultad de Agronomía, Universidad Autónoma de Nuevo León, General Escobedo City, Nuevo León, México. General Escobedo is located at 26°49' N, -100°19' W and altitude of 500 m14. The ECP system consisted of two electrodes, an aluminum anode and a copper cathode, with electrode dimensions of 4.5 cm long x 4.5 cm high x 0.15 cm wide. A multimeter (Model 2700/Switch System Keithley, Ohio, USA) was used to measure variables V and A throughout the experiment. A resistor (Ф; 100 Ω tolerance ± 5%) was used to complete the electrical circuit (Figure 1a’).
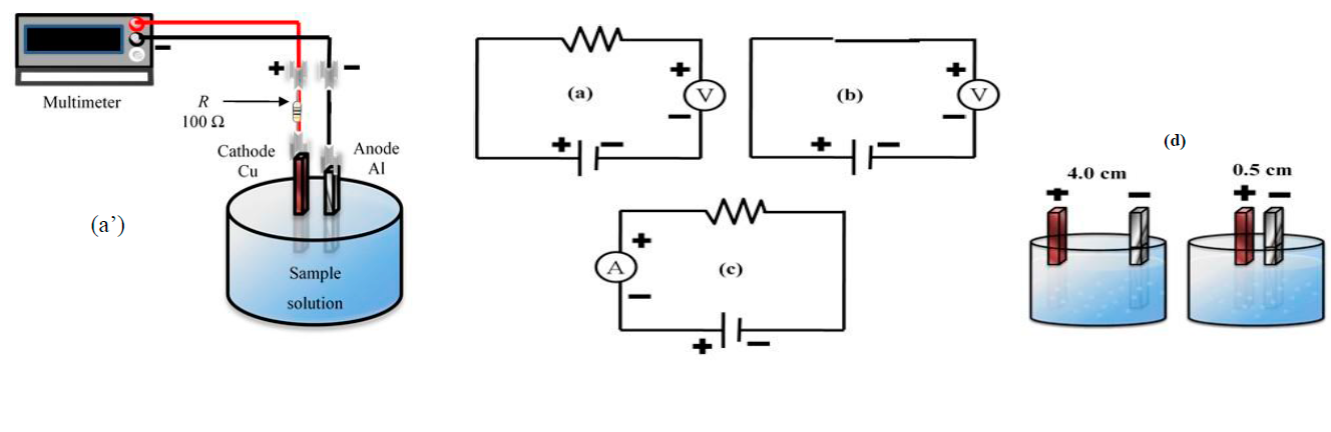
Figure 1: Circuit design of the electrochemical prototype (a’), and circuits to determinate Volt (a, b), Ampere (c) and distance (d) between electrodes (4.0 and 0.5 cm)
Experimental conditions for evaluation of the ECP were separation distance (δ) between the electrodes (0.5 and 4.0 cm) and resistor presence (with or without the resistor), during measurement of electrical variables. Variation of distance and presence of the resistor in the circuit were used to define how ECP measurements varied under these conditions in order to obtain the optimum configuration of ECP design. The experiment consisted of seven treatment solutions (Ƭ i ), based on NaCl concentrations of 0, 2, 4, 6, 8, 10, 12 g of NaCl/100 mL of water. Deionized water (CTR Scientific, Monterrey, N.L., México) at room temperature (24 °C) was used to prepare the solutions. The electrodes were inserted 2.0 cm into each solution, separating them by distances of 0.5 and 4.0 cm (Figure 1d), and with the presence or absence of the resistor (Figure 1a-b ) in the circuit (δ with Ф and δ without Ф; Figure 1a-d ). These conditions were established to measure variable V. To determine amperage (Figure 1c), it was necessary to place a resistor in the electrical circuit. Variables V and A were used to estimate the R, based on Ohm's Law15. Power (P) in watts was determined with the following equation: P = V I15. The experiment was replicated twice, and measurements were performed in duplicate.
The ECP was evaluated in 400 g each of two fresh commercial cheeses: a standard (Control) cheese and a light cheese (Light) low in calcium, sodium and fat (Table 1). The cheeses dimensions were 12 cm in diameter and 4 cm high. The electrical variables V, A, R and P in cheese were determined according to conditions determined in the ECP evaluation (Figure 1). Electrodes were introduced 1.5 cm into cheeses, and electrodes were placed at distances of 0.5 and 4.0 cm. Varying the distance between electrodes was done in order to validate the optimum distance between electrodes and whether a resistor in the circuit was required when amperage was measured, and to determine the optimum conditions for measuring the electrical variables and their variation in cheese. The measurements were conducted in two replicates per type of cheese and each variable was measured in triplicate. A 10-g sample of each cheese in triplicate was homogenized in 90 mL of distilled water, and pH was determined with a potentiometer (Mettler Toledo, Probiotek; Columbus, OH, USA).
Table 1: Nutritional composition of the cheeses
| Trait | Composition (g/20 g of cheese) * | |
|---|---|---|
| Control | Light | |
| Carbohydrate | 0.60 | 0.50 |
| Protein | 3.40 | 4.00 |
| Fat | 5.20 | 2.80 |
| Calcium | 0.11 | -§ |
| Sodium | 0.11 | 0.08 |
| Moisture and other components | 10.57 | 12.62 |
*Data taken from the commercial product package.
§ - = not present
The statistical evaluation of the ECP was carried through of an analysis of variance (ANOVA) with the GLM procedure of SAS16, using the statistical model:
Where:
y ijk = evaluated variables V, A, R and P;
μ = general mean;
Ƭ i = fixed effect of the ith treatment (NaCl solutions and cheeses);
δ j = fixed effect of the jth distance between the electrodes;
Ф k = fixed effect of the kth condition of the resistor;
(Ƭδ) ij = fixed effect of the interaction between treatment and distance;
(ƬФ) ik = fixed effect of the interaction between treatment and the resistor;
(δФ) jk = fixed effect of the interaction between distance and the resistor;
(ƬδФ) ijk = fixed effect of the triple interaction between treatment, distance and the resistor;
Ԑ ijk = random error normally distributed with zero mean and variance σ2 [Ԑ ijk ~ N (0, σ2)]. The pH analysis of cheese involved a simple ANOVA. The effect of the independent variable NaCl on dependent variables V, A, R and P was analyzed with ANOVA, linear regression analysis and the REG procedure of SAS16, and the following second order quadratic statistical model17:
Where:
y i = dependent variable y influenced by X (NaCl);
β 0 = intercept to the origin when X = 0;
β 1 = linear regression coefficient, which represents the change of y when X (NaCl) increases one unit;
X 1 = values of the ith solution of independent variable X 1 (NaCl);
β 11 = regression coefficients of second order and represent the change in y when X 1 increases by an increment of one unit quadratically;
Ɛ i = random error of the ith observation by effect of independent variable (X 1 ) on y.
A Tukey means comparison was performed by setting a 0.05 confidence level.
Table 2 presents the statistical effect (P-value) of factors evaluated in the ECP on the variables measured in saline solutions. Distance (δ j ) and its interaction with NaCl treatment [(Ƭδ) ij ] were not statistically significant (P>0.05) for the electrical variables evaluated (y ijk ). However, the NaCl concentration (Ƭ i ) did influence (P<0.05) the variables measured in the solutions. These results indicate that a distance of 0.5 or 4.0 cm can be used in the ECP design to measure the electrical variables in these solutions without changing the variable values. Amperage was measured only with presence of the resistor in the circuit, therefore, statistical P-value was not calculated for resistor (Ф k ) interaction with NaCl [(ƬФ) ik ], distance [(δФ) jk ] and triple interaction [(ƬδФ) ijk ] between treatment, distance, and resistor.
Table 2: Effects of model parameters on variables evaluated in NaCl solutions by the electrochemical prototype
| Model parameters * | P-value | |||
|---|---|---|---|---|
| Volt | Ampere | Resistance | Power | |
| Model | 0.3902 | 0.0007 | 0.0007 | 0.0003 |
| Ƭ i | 0.0076 | < 0.0001 | < 0.0001 | < 0.0001 |
| δ j | 0.3768 | 0.8698 | 0.3705 | 0.7297 |
| Ф k | 0.1794 | -§ | - | - |
| (Ƭδ) ij | 0.9202 | 0.7314 | 0.6128 | 0.4448 |
| (ƬФ) ik | 0.8566 | - | - | - |
| (δФ) jk | 0.9527 | - | - | - |
| (ƬδФ) ijk | 0.9971 | - | - | - |
| µ ± Ԑ ijk | 0.564 ± 0.007 | 2.615 ± 0.097 | 220.333 ± 7.562 | 1464.686 ± 37.189 |
* Ƭ i = i-th treatment (NaCl); δ j = j-th distance; Ф k = j-th resistor condition; (Ƭδ) ij = interaction between treatment and distance; (ƬФ) ik = interaction between treatment and resistor; (δФ) jk = interaction between distance and resistor; (ƬδФ) ijk = triple interaction between treatment, distance and resistor; μ ± Ԑ ijk = mean ± standard error. n = 42.
§ - = not detected.
The electrical conductivity measured in NaCl concentrations (Ƭ i ) by the ECP is presented in the Table 3. Concentrations 2, 4 and 6 g of NaCl/100 mL of water gave the highest voltage values, while the control at 0 g of NaCl/100 mL of water gave the lowest value (P<0.05). The higher NaCl concentrations, including 6 g of NaCl/100 mL of water, showed high ampere and power, but lower values for resistance. Muske et al18 evaluated electrical variables in lemon juice while varying NaCl concentrations. The conclusions from that study were that the presence of weak acids directly influenced electron transfer and mainly affected the magnesium anode, while the addition of NaCl blocked interaction of the acid on the electrode surface, and resulted in the decrease in electric potential.
Table 3: Electrical conductivity measured in solutions of various NaCl concentrations by the electrochemical prototype
| NaCl * (Ƭ i ) | Variables ¶ | |||
|---|---|---|---|---|
| Volt | Ampere | Resistance | Power | |
| 0 | 0.539b | -§ | - | - |
| 2 | 0.576a | 2.055b | 277.810a | 1,168.018b |
| 4 | 0.576a | 2.240b | 253.215ab | 1,267.343b |
| 6 | 0.580a | 2.715a | 212.785bc | 1,553.998a |
| 8 | 0.566ab | 2.663a | 211.610c | 1,499.765a |
| 10 | 0.553ab | 2.960a | 186.723c | 1,626.340a |
| 12 | 0.556ab | 3.058a | 179.858c | 1,672.655a |
| SE | 0.007 | 0.088 | 9.110 | 45.778 |
* NaCl in g/100 mL of water.
¶ Means (n = 42) with the same superscript are not significantly different. SE = standard error.
§ - = not detected.
Regression analysis of the ECP validation (Table 4) showed significant effect (P<0.05) for a linear behavior, and indicated that the best fit for the electrical variables was a quadratic model. In the case of V, the ECP detected a decrease of -0003 V and R a reduction of-19 Ω for each increase in the NaCl concentration. In contrast, in A and P were detected more than 0.17 and 107 for each unit increase in sodium concentrations, respectively. The quadratic parameter (β11) was found appropriate for detection of decreases in the V, A and P parameters and an increase in R with the NaCl variation.
Table 4: Regression (β) and determination (R2) coefficients in validation of the electrochemical prototype
| Dependent variable | Regression coefficients * | R 2 | P-value | |||
|---|---|---|---|---|---|---|
| β 0 | β 1 | β 11 | Linear | Quadratic | ||
| Volt | 0.563 | -0.003 | - 0.0004 | 0.2127 | 0.2664 | 0.0387 |
| Ampere | 1.712 | 0.173 | - 0.0051 | 0.7854 | 0.8024 | < 0.0001 |
| Resistance | 314.511 | -19.289 | 0.6733 | 0.7756 | 0.8064 | < 0.0001 |
| Power | 959.196 | 107.242 | - 4.0418 | 0.7384 | 0.7785 | < 0.0001 |
* β0 = intercept when X = 0; β1 = change in y when X (NaCl) increases one unit; β11 = represent the change in y when X 1 increases one unit quadratically; R2 = determination coefficient.
The significance level (P-values) of statistical parameters and means of cheese variables are present in Table 5. The type of cheese (Ƭ i ) statistically affected V, A, P and pH (P<0.05), while distance (δ j ) affected V (P<0.05). The interaction between cheese and distance [(Ƭδ) ij ] did not influence the variables. In other parameters involving resistance, P-values were not presented for interactions, because the resistor was included in the circuit to measure amperage only. In mean comparisons, control cheese showed the highest values for V, A and P but lower values for R and pH with respect to light cheese. Voltage at the 4-cm distance was the highest compared to V at 0.5 cm. These results may be related to the composition of control cheese, because it had a higher lipid content, and, consequently, a greater presence of fatty acids available in the system, influencing oxidation at the anode. For example, some acids such as CH3COOH are weak electrolytes, and are not completely ionized, being a reversible reaction that gives H+ ions in the medium, and with the presence of metals such as Zn, Mg and Fe conduct electricity12. Moreover, dissolved hydrogen (H+) in solution is reduced in the absence of copper by the effect of electrode oxidation to H219, affecting the electrical variables measured in cheeses. Sadat et al1 indicated that dielectric properties of foods depend of their chemical compositions. The reactions determined in the current study could explain the high values found in the control cheese, with higher fat content, Ca and Na with respect to the light cheese. Hence, this prototype can be used to evaluate the fat and Na content in cheeses to evaluate its quality and levels of this variables respect to Mexican official standars.
Table 5: Effects of model parameters on variables evaluated in cheeses with the electrochemical prototype
| Model parameters * |
Volt | Ampere | Resistence | Power | pH |
|---|---|---|---|---|---|
| P-value | |||||
| Model | 0.0008 | 0.2118 | 0.2821 | 0.1505 | -§ |
| Ƭ i | 0.0004 | 0.0421 | 0.0867 | 0.0312 | < 0.0001 |
| δ j | 0.0118 | 0.5687 | 0.4656 | 0.4322 | - |
| Ф k | 0.0639 | - | - | - | - |
| (Ƭδ) ij | 0.3775 | 0.9026 | 0.5623 | 0.8712 | - |
| (ƬФ) ik | 0.2091 | - | - | - | - |
| (δФ) jk | 0.9773 | - | - | - | - |
| (ƬδФ) ijk | 0.3930 | - | - | - | - |
| Commercial cheeses (Ƭi; µ)¶ | |||||
| Control | 0.528a | 1.082a | 507.307b | 568.701a | 6.530b |
| Light | 0.512b | 0.982b | 536.689a | 505.675b | 6.755ª |
| Distance (δj; cm) | |||||
| 0.5 | 0.515b | 1.021 | 525.609 | 527.127 | - |
| 3.0 | 0.526a | 1.044 | 513.388 | 547.250 | - |
| Resistor (Фk) | 0.520 | 1.032 | 519.498 | 537.188 | - |
| (Ƭδ)ij | 0.520 | 1.032 | 522.590 | 542.330 | - |
| (ƬФ)ik | - | - | - | - | - |
| (δФ)jk | - | - | - | - | - |
| (ƬδФ)ijk | - | - | - | - | - |
| SE | 0.003 | 0.024 | 9.378 | 15.394 | 0.013 |
* Ƭ i = i-th treatment (cheeses); δ j = j-th distance; Ф k = j-th resistor condition; (Ƭδ) ij = interaction between treatment and distance; (ƬФ) ik = interaction between treatment and resistor; (δФ) jk = interaction between distance and resistor; (ƬδФ) ijk = triple interaction between treatment, distance and resistor; 2 μ ± Ԑ ijk = mean ± standard error (SE); n = 12.
§ - = not detected.
¶ Means (n = 12) with the same superscript are not significantly different.
The voltage and resistance are variables that can measure with the electrochemical prototype due that these variables decrease at higher concentrations of NaCl, while amperage and power increased. The distances between the electrodes and presence of the resistor in the circuit had no influence on levels of the electrical variables accessed, but the resistor is necessary to determine of resistance data. The electrochemical prototype perceived differences in the electrical variables (volt, ampere, resistance, and power) of cheeses according to their chemical composition. Therefore, this prototype could be used to evaluate the minerals and quality of the cheeses with the volt, ampere, resistance and power.
Literature cited:
1. Sadat A, Mustajab P, Khan IA. Determining the adulteration of natural milk with synthetic milk using ac conductance measurement. J Food Eng 2006;77(3):472-477. [ Links ]
2. Mabrook MF, Petty MC. Application of electrical admittance measurements to the quality control of milk. Sensor Actuat B-Chem 2002;B84(2-3):136-141. [ Links ]
3. Mabrook MF, Petty MC. A novel technique for the detection of added water to full fat milk using single frequency admittance measurements. Sensor Actuat B-Chem 2003a;B96(1-2):215-218. [ Links ]
4. Mabrook MF, Petty MC. Effect of composition on the electrical conductance of milk. J Food Eng 2003b;60(3):321-325. [ Links ]
5. Żywica R, Banach JK, Kiełczewska K. An attempt of applying the electrical properties for the evaluation of milk fat content of raw milk. J Food Eng 2012;111(2):420-424. [ Links ]
6. Velázquez-Varela J, Fito PJ, Castro-Giráldez M. Thermodynamic analysis of salting cheese process. J Food Eng 2014;130:36-44. [ Links ]
7. Maruyama Y, Numamoto Y, Saito H, Kita R, Shinyashiki N, Yagihara S, Fukuzaki M. Complementary analyses of fractal and dynamic water structures in protein-water mixtures and cheeses. Colloid Surface A 2014;440:42-48. [ Links ]
8. Lin Teng Shee F, Angers P, Bazinet L. Relationship between electrical conductivity and demineralization rate during electroacidification of cheddar cheese whey. J Membrane Sci 2005;262(1-2):100-106. [ Links ]
9. Figura LO, Teixeira AA. Food physics. Physical properties-measurement and applications. Berlin Heidelberg, Germany: Springer-Verlag; 2007. [ Links ]
10. Lewis MJ. Physical properties of foods and food processing systems. Berlin Heidelberg, Germany: Springer-Verlag ; 1990. [ Links ]
11. Gustafson RJ, Morgan MT. Fundamentals of electricity for agriculture. American Society of Agricultural and Biological Engineers. St. Joseph, MI. 2004. [ Links ]
12. Chang R. Chemistry. New York, USA: Mc Graw Hill; 2010. [ Links ]
13. Atkins P, de Paula J. Physical Chemistry. Oxford, New York: W.H. Freeman and Company; 2006. [ Links ]
14. INEGI. Instituto Nacional de Estadística y Geografía. México en Cifras: Información Nacional por Entidad Federativa y Municipios. http://www.beta.inegi.org.mx/app/areasgeograficas/ . Consultado: Feb 12, 2017. [ Links ]
15. Harris DC. Quantitative chemical analysis. Oxford, New York: W.H. Freeman and Company; 2007. [ Links ]
16. SAS. Statistical Analysis System. Version 9.1.3. SAS Institute Inc. Cary, North Carolina, 2006. [ Links ]
17. Montgomery DC. Design and analysis of experiments. Danvers MA: John Wiley & Sons, Inc; 2013. [ Links ]
18. Muske KR, Nigh CW, Weinstein RD. A lemon cell battery for high-power applications. J Chem Educ 2007;84(4):635-638. [ Links ]
19. Kelter PB, Carr JD, Johnson T. The chemical and educational appeal of the orange juice clock. J Chem Educ 1996;73(12):1123-1127. [ Links ]
Received: June 26, 2017; Accepted: February 08, 2018
 Este es un artículo publicado en acceso abierto bajo una licencia Creative Commons
