


Serviços Personalizados
Journal
Artigo
 texto em
  Inglês (pdf)
 Artigo em XML
 Referências do artigo
 Enviar este artigo por email
Indicadores
-
 Citado por SciELO
 -
 Acessos
Links relacionados
-
 Similares em
SciELO
Similares em
SciELO
Compartilhar

 Permalink
Revista mexicana de ciencias pecuarias
versão On-line ISSN 2448-6698versão impressa ISSN 2007-1124
Rev. mex. de cienc. pecuarias vol.7 no.4 Mérida Out./Dez. 2016
Articles
Botanical composition of honeys from the Yucatan Peninsula, by qPCR and dissociation curve analysis
a Instituto Nacional de Investigaciones Forestales, Agrícolas y Pecuarias (INIFAP). Campo experimental Bajío, Km 6.5 Carr. Celaya-San Miguel de Allende, 38110, S/N Celaya, Gto. México. Tel: 01800 088 2222 Ext. 85246.
b Campo Experimental Mocochá, INIFAP. México.
c Centro Nacional de Recursos Genéticos, INIFAP. México.
d Centro Nacional de Investigación Disciplinaria en Fisiología y Mejoramiento Animal. INIFAP. México.
A polymerase chain reaction quantitative method (qPCR) followed by melting curve analysis was used for fast and simultaneous detection of botanical composition of honey samples from Yucatán Peninsula, Mexico. Ten honey samples from 2013 and 2014 production were collected directly from beekeepers and analyzed for Viguiera dentata, Gymnopodium floribundum, Piscidia piscipula, Acacia angustissima and Mimosa bahamensis content. Seven primers from generic genes (Adh1, Hmg2, Brass lip, Plant 1, Plant nest, Act1, and Helli-all) were used to amplify plant species and honey samples DNA. Comparisons of melting curves among plant and honey samples for each primer amplification, revealed a variable taxonomic content M-1 (V. dentata), M-3 (M. bahamensis y G. floribundum), M-4 (G. floribundum), M-8 (M. bahamensis) y M-13 (V. dentata y G. floribundum). M-7, M-11 and M-12 did not have evidence of presence for any of the plant species under study, whilst M-14 and M-15 showed a different plant species amplification pattern. These results correlate to melissopalynological analysis for most cases. P. piscipula was not detected in any honey sample; however, according to melissopalynological analysis A. angustissima was present in M-3 and M-4 even though it was unable to detect it, possibly due to a low or no similarity with generic genes sequence.
Key words: Quantitative PCR; Honey; Melting curves; Gene molecular markers; Melissopalynology
El método cuantitativo de reacción en cadena de la polimerasa (qPCR), seguido por análisis de curvas de disociación, fue desarrollado para la detección rápida y simultánea de la composición botánica en mieles de la Península de Yucatán, México. Cinco muestras de miel ciclo apícola 2013 y cinco del 2014, se caracterizaron para definir el contenido de cinco especies de plantas de importancia apícola; Viguiera dentata, Gymonopodium floribundum, Piscidia piscipula, Acacia angustissima y Mimosa bahamensis. Siete iniciadores de genes genéricos (Adh1, Hmg2, Brass lip, Plant 1, Plant nest, Act1, y Helli-all) se emplearon para caracterizar las especies vegetales y las muestras de miel. Al finalizar la amplificación se obtuvo una curva de disociación por reacción representando productos específicos de amplificación. Los resultados obtenidos indicaron que el contenido taxonómico en las muestras de miel fue diferencial M-1 (V. dentata), M-3 (M. bahamensis y G. floribundum), M-4 (G. floribundum), M-8 (M. bahamensis) y M-13 (V. dentata y G. floribundum). M-7, M-11 y M-12 no revelaron tener ninguna de las especies analizadas, mientras que M-14 y M-15 presentaron un patrón de amplificación diferente a las especies incluidas en este estudio; concordando con los análisis palinológicos. P. piscipula no mostró ningún patrón de amplificación con ninguno de los iniciadores de este estudio y A. angustissima no fue identificada en ninguna muestra de miel, aun cuando el análisis palinológico reveló presencia de esta especie en M-3 y M-4, posiblemente derivado de la ausencia de similitud con los genes de estudio.
Palabras clave: PCR cuantitativo; Miel; Curvas de disociación; Marcadores moleculares genéricos; Melisopalinología
Introduction
Mexico is among the top five honey producing and exporting countries worldwide. Honey quality is determined based on flavor, color and aroma1,2, which are the result of the plant species in the zone of production. Plant species of a honey production region provides a specific botanical composition to honey, which is unique to that place of origin. Efforts on marketing classified honey based on botanical origin are increasing, particularly in Yucatan Peninsula region3. Yucatan Peninsula accounts for 30 % of total production from which, 90 % is for international markets4,5. Honey has specific physicochemical and sensorial traits that respond to a broad diversity of plant species in each region. Approximately 2,400 plant species have been recorded nationally, 600 of which are visited by honey bees and 30 of them are important in honey production6,7,8.
Ninety percent of annual honey production in the region depends on two main nectar sources: Viguiera dentata (sunflower goldeneye; local term is tajonal) from December to February; and Gymnopodium floribundum (dzildzilche; local term is t´sit´silche´) from March to May. Both species bloom during the driest time of year. During the rainy season, from June to November, a large variety of legumes and vines flower, but they account for only 8 % of the total annual honey harvest in the region9.
A widely used method to identify among the plant species from which, a honey has been produced is pollen analysis, based on the specific morphology of the pollen10-14. However, currently there are a number of different methodologies that can complement melissopalynological analysis.
Pollen content in honey is extremely low (trace levels), however, it varies depending on the floral abundance in each zone, and their nectar and pollen contribution, which results in the under- or over-representation of some species. This highlights the need for additional methods that depend less on pollen traces to estimate honey physicochemical parameters and botanical content, such as proteomics15, optical spectrophotometry and electronic sensors16, and fluorescence spectrophotometry17, among others.
An effective method for identifying the botanical source are those based on DNA, suitable for the honey quality regulations used for standardization within the European Union and other countries18. Defining honey botanical sources with the aim of adding value to the final product requires detection of homologous nucleotide sequences using generic oligonucleotides derived from metabolic genes. These genes are common to all plant species but have amplification patterns highly specific to each plant family.
The objective of the present study was to develop and validate generic oligonucleotide amplification system using quantitative PCR and SYBR® Green, as well as dissociation curve analysis, in order to characterize the plant species and to identify pollen sources in honey production from the Yucatan Peninsula.
Material and methods
Honey samples. Ten honeycombs with at least 80 % operculation were collected from the apiary at the Mocochá Experimental Station (21°07’N, 89°26’W; 10 m asl) of the National Institute of Forestry, Agricultural and Livestock Research (Instituto Nacional de Investigaciónes Forestales, Agrícolas y Pecuarias - INIFAP) during different flowering cycles. Honey was extracted from the honeycombs using a stainless steel extractor. The extractor was washed with water and dried with 70 % alcohol to prevent contamination between honey samples. After extraction, each honey sample was filtered and stored at room temperature in polyethylene terephthalate (PET) containers. All samples were sent to the Vegetal Tissue Culture and Genetic Engineering Laboratory at the Bajío Experimental Station (INIFAP). Five samples were collected during the 2013 season (M-1, M-3, M-4, M-7 and M-8) and five samples during the 2014 season (M -11, M-12, M-13, M-14 and M-15). Palynology analyses were done of each sample to generate floral origin reference data.
Melissopalynological analysis. The honey samples were acetolyzed following Louveaux19. Acetolyzed pollen grains identified in the honeys were fixed on slides with glycerinated gelatin. Grain structural characteristics (e.g. shape, size, openings and structural elements) were analyzed under microscope (Motic BA 410) with an image analyzer. Based on their characteristics, pollen grains were classified and identified using the published literature20.
Plant Material. Leaves of five plant species known as the most important in honey production in the region were collected: Viguiera dentata (flowers December to February); Gymnopodium floribundum (flowers February to April); Piscidia piscipula (fishpoison tree; locally known as ja´bin) (flowers from March to April); Acacia angustissima (prairie acacia; locally known as xáax) (flowers from June to August); and Mimosa bahamensis (Bahama mimosa; locally known as sak káatsim) (flowers from July to November).
DNA extraction. Plant DNA extraction was done using a commercial kit (DNeasy Plant Mini; Qiagen ®) following manufacturer instructions. Honey samples DNA was extracted from 50 g of honey per sample. This amount was distributed evenly among four 50 mL tubes (NALGEN®), approximately 30 mL double-distilled sterile water added to each, and incubated in water bath at 40 °C for 15 min. Each tube was then agitated by inversion, and centrifuged at 10,000 xg for 15 min until a sediment (i.e. pollen traces) settled. Once pollen traces were obtained, the pollen DNA extraction was performed using protocol published by the European Union Federal Office of Consumer Protection and Food Safety (2011), and modified by the Vegetal Tissue Culture and Genetic Engineering Laboratory. DNA concentration ranged from 40 to 200 ng/L, depending on pollen content.
Primers. Seven previously published consensus sequence primers were used to establish plant species amplification patterns18, and then to identify these amplification patterns and their dissociation curves in the honey samples: 1) non-coding tRNA-Leu chloroplastic DNA sequence of trnL (UAA) intron, consensus of 19 species including algae, bryophytes, pteridophytes, gymnosperms and angiosperms18,21 (Plant 1); 2) nested Plant 1 sequence (Plant nest)18; 3) canola and sunflower actin (Act)18; 4) sunflower profilin (Helli-all)18; 5) canola lipase (Brass-lip)18; 6) sorghum, rice and rye alcohol dehydrogenase (Adh1)18; and 7) cotton, pepper, tomato, potato and tobacco 3-hydroxymethyl glutaryl CoA (Hmg2)18.
qPCR Amplification. SYBR® Green system amplification was done with the following reaction buffer: 1X Fast Master mix SYBR® Green buffer (Applied Biosystems No. Cat. 4385612); 150 nM generic marker derived primers; and 100 ng DNA. Amplification conditions (equipment: ABI PRISM 7000, Applied Biosystems) were: 1 cycle at 95 °C for 20 sec (pre-denaturation); 40 cycles at 95 °C for 3 sec (denaturation); and 1 cycle at 60 °C for 30 sec (alignment and extension). After amplification, a dissociation curve (fusion temperature curve [Tm]) analysis was run to verify the presence of specific and non-specific products according to the fusion temperature of each reaction22,23. Each plant and honey DNA sample was amplified in triplicate to establish amplification pattern consistency.
In order to verify homogeneous DNA concen-trations TaqMan® 18S (human18s rRNA No. Cat. 4319413E, Applied Biosystems) commercial probe was used as internal control, together with the TaqMan® Universal PCR Master Mix II with UNG (No. Cat. 4440038, Applied Biosystems) mixture. Reaction elements without DNA template were used as a negative control.
Results
The internal control (18S) amplification curves validated the standard DNA concentration and quality for executing the following reactions with the generic metabolic gene primers. The established concentration was 50 ng/reaction, which resulted in amplification between cycles 17 and 20, the least amount of separation between replicates, increasing reliability among reactions (Figure 1).
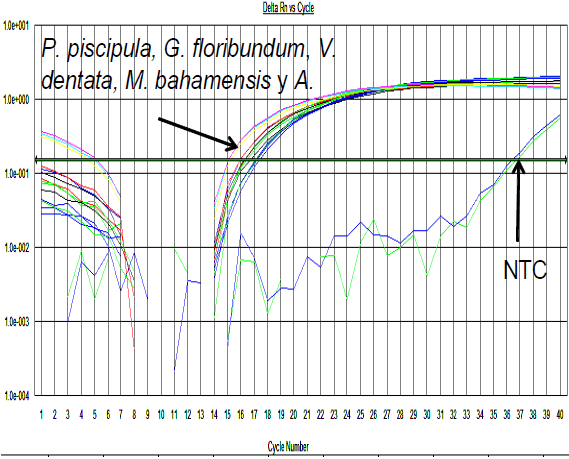
Figure 1 qPCR amplification curves for the 18S constitutive gene (internal control) of plant DNA (Piscidia piscipula, Gymnopodium floribundum, Viguiera dentata, Mimosa bahamensis and Acacia angustissima) (7000 SDS v 1.2.3 software, Applied Biosystems)
Amplification of generic genes in studied plant species
Primer Plant 1 exhibited amplification in all the plant DNA samples, but not in the negative control (Figure 2A). Amplification of the Plant nest primer was also observed in all five species. However, differences in amplification cycles were present between different species; that is, Plant nest primer exhibited greater similarity with M. bahamensis, G. floribundum and A. angustissima than with P. piscipula and V. dentata (Figure 2B). Primers Act, Brass-Lip and Helli-all amplified in all plant DNA samples in a range of different cycles (Figure 2C, 2D AND 2F). Primer Hmg2 amplified in M. bahamensis, V. dentata, G. floribundum and A. angustissima, but did not amplified in P. piscipula (Figura 2E). No amplification was observed with the Adh1 primers in any of the five studied plant species.
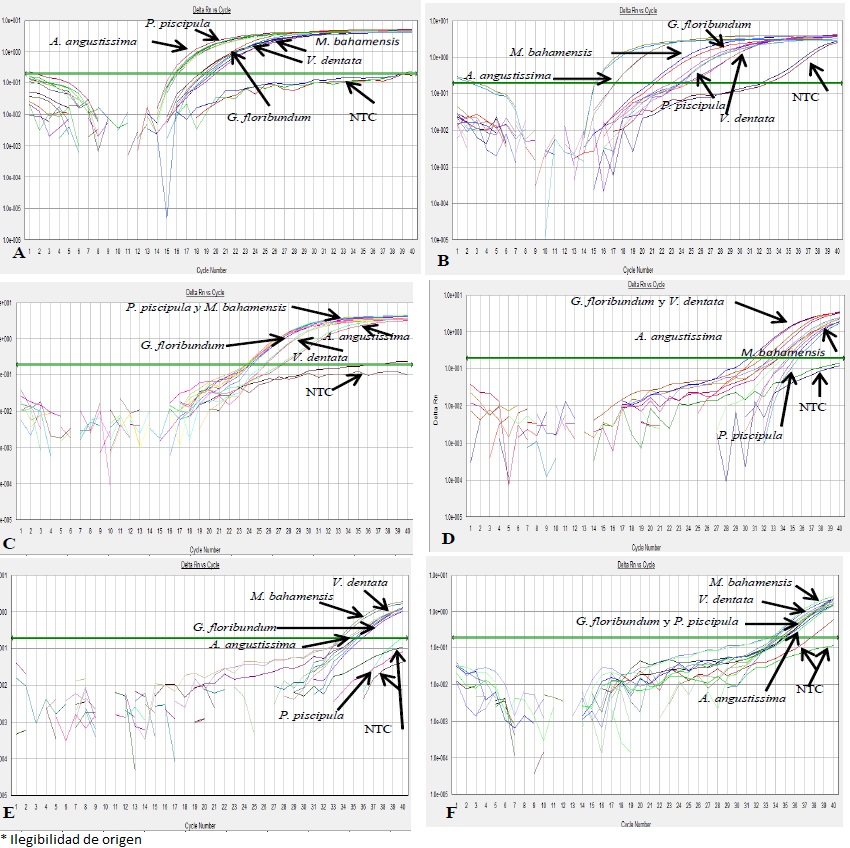
Figure 2 qPCR amplification curves for the five studied plant species (Piscidia piscipula, Gymnopodium floribundum, Viguiera dentata, Mimosa bahamensis and Acacia angustissima) using the SYBR® Green system. Primers: A) Plant 1; B) Plant nest; C) Actin; D) Brass-lip; E) Hmg2; and F) Helli-all. NTC = negative control without DNA (7000 SDS v 1.2.3 software, Applied Biosystems)
PCR amplification product and dissociation curve analysis in plant species
A single curve for each species was observed in the analysis of dissociation curves derived from the Plant 1 amplification, when compared to the fluorescence derivative (maximum curve peak corresponded to product fusion temperature - Tm). Variation below the curve was associated with the number of gene copies in each species (Figure 3A). Temperature and fluorescence values also varied between species with the Plant nest primer and single dissociation curves for each of the five plant species were observed (Figure 3C). This confirms that use of Plant nest reduced the spectrum of similarity between species, making detection more accurate. However, even though all five species showed amplification, the negative control amplified as well. This non-specific amplification may have been caused by primer dimer formation, which made Plant nest primer unsuitable for this purpose.
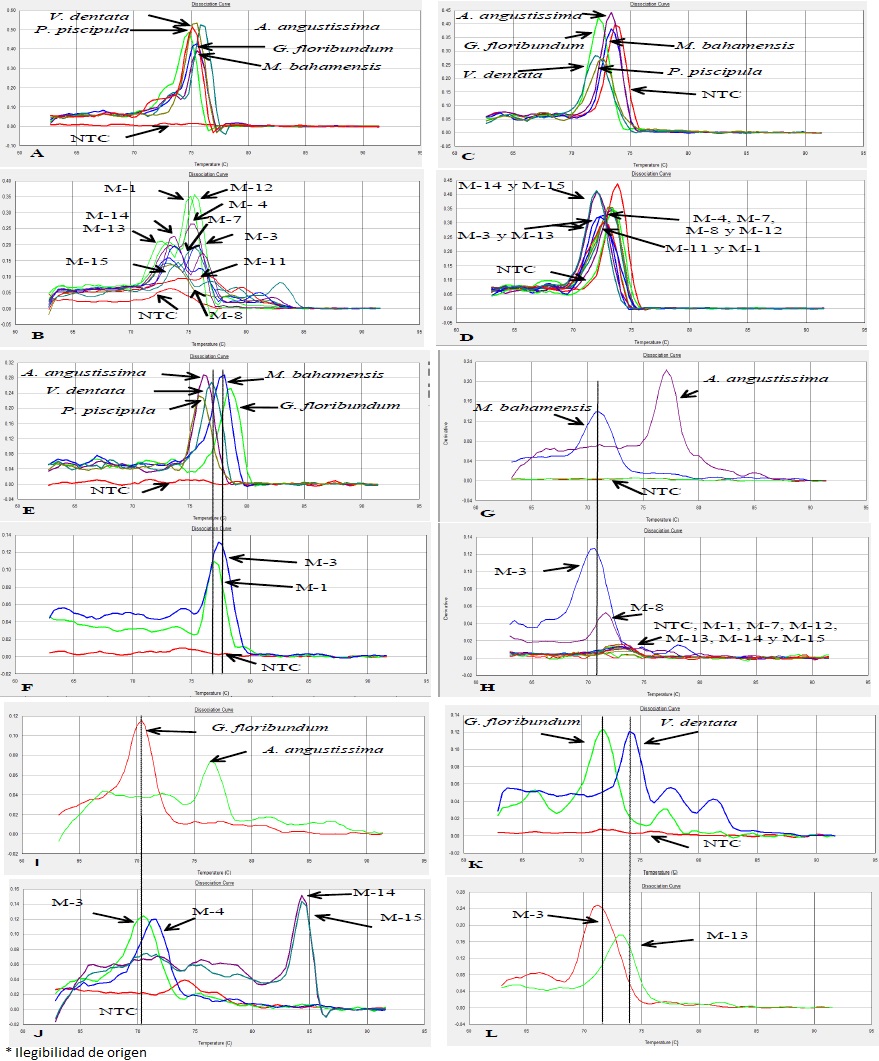
Figure 3 Comparison of dissociation curve patterns of amplification products generated with five generic gene plant primers in plant species and honey samples. Plant species: A) Chloroplast trnL (UAA) intron (Plant 1); C) Chloroplast trnL (UAA) intron (Plant nest); E) Actin (Act); G) Lipase (Brass lip); I) 3-hidroxymethyl glutaryl CoA (Hmg2); and K) Profilin (Helli all). Honey samples: B) Chloroplast trnL (UAA) intron (Plant 1); D) Chloroplast trnL (UAA) intron (Plant nest); F) Actin (Act); H) Lipase (Brass lip); J) 3-hidroxymethyl glutaryl CoA (Hmg2); and L) Profilin (Helli all) (7000 SDS v 1.2.3 software, Applied Biosystems)
Dissociation curves obtained with Act primer exhibited a single product in all five plant species, with variations in temperature and fluorescence. This eliminates the possibility of crossed amplification (Figure 3E). Brass-lip primer on the other hand, gave single products for M. bahamensis and A. angustissima (Figure 3G). Curves for G. floribundum, V. dentata and P. piscipula exhibited two or more non-specific curves due to the non-specific binding of the primer to the genome sequences in these three species.
When using Hmg2 primers single curves were observed for A. angustissima and G. floribundum (Figure 3I). The fluorescence values produced for Hmg2 gene were relatively lower than the other genes, reducing the size of the area below the curve. This may have been a result of a considerably lower number of Hmg2 gene copies in the plant species under study, even though there was specificity in the sequences.
Finally, Helli-all primers produced single curves for G. floribundum and V. dentata (Figure 3K). Fusion temperature values differed for M. bahamensis, P. piscipula and A. angustissima, and non-specific or single curves were recorded for these species.
PCR amplification product and dissociation curve analysis in honey samples
After analyzing the dissociation curves for the studied plant species, the dissociation curves derived from honey samples DNA amplification were analyzed and compared to the plant curves. Similarly to plant species, no amplification was observed with the Adh1 primer in all honey samples. This confirms that graminea species (i.e. grasses and cereals) were not part of the botanical composition of the studied honey samples. All the honey DNA samples exhibited amplification with the Plant 1 primer, although, based on the dissociation curves, no single product was generated in any of the honey samples (Figure 3B).
The same held true for the Plant nest primers where amplification was observed in all honey samples, but no single dissociation curves obtained., Negative control also exhibited amplification, indicating formation of dimers between primers and thus eliminating the possibility of using these primers for accurate detection (Figure 3D).
Act primer produced amplification in all honey samples. In the dissociation curve analysis, sample M-1 exhibited a specific product at 76.9 °C with 0.11 fluorescence, probably due to the presence of V. dentata. Sample M-3 had a specific product at 73.3 °C with 0.13 fluorescence, in this case probably due to the presence of M. bahamensis (Figure 3E). This was confirmed by the palynological analysis, which identified the presence of V. dentata in M-1 and M. bahamensis in M-3.
Honey samples M-3, M-4, M-8 and M-11 amplified with Brass-lip primers, however, only M-3 and M-8 had a single curve, both at 70.2 °C and 0.5 fluorescence; indicating the presence of M. bahamensis. This agrees with the palynological analysis, which resulted in 45.3 % M. bahamensis pollen grains presence (Figure 3H). The curve that defines amplification of A. angustissima DNA was not identified in any of the honey samples, but palynological analysis did identify this species in M-3 (22.2 %) and M-4 (58 %).
Amplification using the Hmg2 primer was observed in all the honey samples except M-1 and M-8. The curves indicated that honey samples M-3 and M-4 had a single product with curve characteristics (temperature/fluorescence) similar to the curve from G. floribundum DNA amplification, suggesting that these two samples contained pollen from this species. This agrees with the honey collect date, the flowering period of the species and the palynological analysis (Figure 3J). On the other hand, honey samples M-14 and M-15 showed single curves at a higher temperature and fluorescence value than those observed in M-3 and M-4 with the same Hmg2 primer; the resulting curves for these honey samples did not coincide with any of the curves obtained with the Hmg2 primer for plants under analysis.
The Helli-all primer resulted in amplification of honey samples M-3, M-4, M-7, M-11, M-12, M-13 and M-15. M-3 sample showed a single curve that suggested a pattern similar to that of G. floribundum (Figure 3L). This coincides with the result for this sample using the Hmg2 primer, suggesting the presence of this species in this sample (Figure 3J). Sample M-13 exhibited a curve similar to that for V. dentata (Figure 3L).
Discussion
Characterization of floral origin in honeys produced in Mexico using primers from generic metabolic gene consensus sequences and dissociation curve analysis provides new analytical support for melissopalynology as part of an initial detection stage.
SYBR® Green fluorophore tends to adhere to any amplified product, either the target sequence or a non specific DNA sequence, adding up all these signals and producing a single amplification curve. The amplification pattern cannot be used directly to determine specificity, but dissociation curve analysis provides information of a specific amplification. In a dissociation curve, fluorescence decreases gradually as temperature increases23. By analyzing these dissociation temperature (or fusion) curves, specific products can be identified since curve shape is related to GC (guanine and cytosine) content, and amplicon size and sequence22.
The seven sets of primers from generic gene sequences used here, generated specific amplification patterns even though these sequences are highly conserved in multiple biological families and different kingdoms. The chloroplast trnL (UAA) intron gene, the base for the Plant 1 and Plant nest primers, amplified the DNA samples from all five studied plants. However, this result did not agree with the dissociation curve analysis, which showed non-specificity with the target sequence in the honey samples DNA. One possible explanation is that since pollen is a masculine germinal cell it has low probabilities of containing plastids (cells from the maternal line), thus limiting identification of DNA chloroplastic sequences from honey samples24. These results contrast with Laube et al18, who established that this multicopy sequence found in the chloroplast gene was adequate for detecting low DNA levels in plants and is therefore apt for detecting plant DNA in honey.
Amplification and dissociation curve analysis with Act primer identified V. dentata in honey sample M-1 and M. bahamensis in sample M-3. Viguiera dentata blooms between December and January, which coincides with the collect date of sample M-1 (24 January 2013), and the palynological analysis (7.5 % V. dentata). This proportion of pollen in honey sample M-1 indicates “minor important pollen” according to the International Apiculture Botanical Commission (Comisión Internacional Botánica Apícola)19. However, the fact that the Act primer detected such low levels of pollen content indicates that this primer is highly efficient; being difficult to detect these amounts using traditional methods. Two species were detected in the M-3 sample, M. bahamensis (Act and Brass-lip) and G. floribundum (Hmg2 and Helli-all). Nonetheless, it was classified as a M. bahamensis monofloral because this species accounted for 65 % of the pollen grains, making it the predominant pollen in the melissopalynological analysis. Its dominance in this sample coincides with this species’ flowering period and the collect date of honey sample. Brass-lip primer confirmed the presence of M. bahamensis in M-8 with fusion temperatures similar to those for this species, but the area below the curve was less than that detected for M-3, indicating a lower pollen content.
Both Hmg2 and Helli-all primers confirmed the presence of G. floribundum in honey sample M-3. This validates the presence of this species in this honey sample, as well as identifying two generic metabolic genes that produce consistent results, providing additional primers for verification of honey botanical source. Although these genes come from distant plant families (Asteraceae for Helli-all, and Solanaceae for Hmg2), there may be high sequence similarity between the profilin (Helli-all) and 3-hydroxylmethyl glutaryl CoA (Hmg2) genes and their homologues in G. floribundum. For instance, profilin (PRF4) from the Arabidopsis profilins family exhibit greater similarity to the profilins from other species than to the other three Arabidopsis profilins (PRF1, PRF2, PRF3)25. At the amino acid level, PRF4 was 78.6 to 82.4 % identical to the pollen-specific profilins of monocotyledons such as Zea mays (corn), Phleum pratense (Timothy grass), Betula verrucosa (silver birch), Nicotiana tabacum (tobacco) and Triticum aestivum (wheat).
Hmg2 showed a single dissociation curve in honey samples M-14 and M-15, however, this specific product was not observed in any of the studied plant species; its temperature in the dissociation curves was far higher than those for the five plant species. These two honey samples were collected at the end of the flowering period of the principal plant species used in honey production. The sequence similarity of these primers are probably associated with secondary species in this cycle such as Mimosa pudica, Acacia gaumeri, Bursera simaruba, Pithecellobium albicans, Senna pallida, Guazuma ulmifolia, Lysiloma latisiliquum and Leucaena leucocephala, among others.
Overall, the most frequent species in the studied honey samples were V. dentata, G. floribundum and M. bahamensis, which bloom for the longest periods among the five analyzed plant species. Acacia angustissima and P. piscipula were not detected in any of the honey samples, most likely because they bloom for only a very short period during the flowering season.
The results indicate that amplification patterns were successfully established for the five studied plant species based on their florescence derivatives. These patterns could then be compared to the patterns detected in honey samples for pollen source identification. Three of the main species present during the season of honey production were identified. Four of the genes (profilin, lipase, 3-hydroxylmethylglutaryl CoA, and actin) contained useful sequences for plant species identification based on amplification patterns which were then validated on honey samples to estimate the presence of one or more plant species.
None of the five plant species were identified in samples M-7, M-11 and M-12, even though the samples were collected during these species’ flowering period. This was confirmed by the palynological analysis results in which Asteraceae, Malvaceae and Fabaceae species were identified. Similarly, honey samples M-14 and M-15, which exhibited a distinct amplification pattern possibly related to species not included in the present analysis, showed the presence of Lysiloma bahamensis, Mimosa pudica and Acacia gaumeri after the palynological.
In the present results, V. dentata was identified by the genes actin and profilin, M. bahamensis by the genes actin and lipase, and G. floribundum by the genes Hmg2 and profilin. Acacia angustissima was detected via palynological analysis at very low percentages in honey samples M-4 (6.2 %), M-8 (2.0 %) and M-12 (0.5 %). These levels were probably below the detection limit of the markers used in the genetic analysis.
Use of primers other than those used in the present analysis, with a broad similarity in metabolic function, could help to establish amplification patterns for P. piscipula and A. angustissima. In addition, design of new gene amplification primers that do not amplify any of the studied plant species or honey samples (e.g. Adh1) could be part of a strategy to identify other plant species on the Yucatan Peninsula.
Conclusions and implications
The amplification results as well as the analysis of the dissociation curves for the studied plant species and honey samples, demonstrated that a single gene could be used to detect more than one species (e.g. actin and profilin) in the same sample. Two different genes can also detect the same species in the same sample (e.g. actin and lipase for M. bahamensis, Hmg2 and profilin for G. floribundum), thus confirming and reinforcing detection results. Finally, actin and profilin gene sequences linked to metabolic activity of cell wall function can independently identify the same species (e.g. V. dentata) in honey samples harvested at different times. The detection system presented here, using DNA amplification with generic gene consensus sequences, is an effective protocol that can support melissopalynology analysis in identifying pollen content of specific plant species in honey.
Literatura citada
1. Bradbear, N. Bees and their role in forest livelihoods. A Guide to the services provided by bees and the sustainable harvesting, processing and marketing of their products. Non-Wood Forest Products 19, Food and Agriculture Organization of the United Nations (FAO), Rome. 2009. [ Links ]
2. Alfaro BRG, Ortiz J, Viera F, Burgos A, Martínez E, Ramirez E. Caracterización palinológica de las mieles de la Península de Yucatán, Mérida. Universidad Autónoma de Yucatán, Comisión Nacional para el Conociemiento y Uso de la Biodiversidad. 2010. [ Links ]
3. Alfaro BRG, Burgos PAI, Moguel OYB, Godínez GLM, Villanueva GR, Romero RO, et al. Plan rector para promover una denominación de origen de las mieles de la Península de Yucatán. Comisión Nacional para el Conocimiento y Uso de la Biodiversidad y Agencia Española de Cooperación Internacional para el Desarrollo 2011. [ Links ]
4. Güemes RF, Villanueva GR. Características de la apicultura en Quintana Roo y del mercado de sus productos. XVI Seminario Americano de Apicultura. Gobierno del Estado de Quintana Roo, Universidad de Quintana Roo. SISIERRA y Ecosur. 2004. [ Links ]
5. SIAP, 2013. Servicios de Información Agroalimentaria y Pesquera. http://www.siap.gob.mx/siaprendes/contenidos/1/04-miel/contexto-5.html Consultado Abril 24, 2015. [ Links ]
6. Flores JS. The flowering periods of leguminosae in the Yucatan Peninsula in relation to honey flows. J Apicult Res 1990;29(2):82-88. [ Links ]
7. Villanueva GR. Nectar sources of European and Africanized honeybee (Apis mellifera) in the Yucatan Peninsula. J Apicult Res 1994;33(1):44-58. [ Links ]
8. Villanueva GR. Polliniferous plants and foraging strategies of Apis mellifera (Hymenoptera: Apidae) in the Yucatan Peninsula. Rev Biol Trop 2002;50(3-4):10. [ Links ]
9. Echazarreta GC, Quezada EJ, Medina ML, Pasteur K. Beekeeping in the Yucatan Peninsula; development and current status. Bee World 1997;73(3):115-127. [ Links ]
10. White JW, Willson RB, Maurizio A, Smith FG. Honey: comprehensive survey. Crane E. editor, William Heineman Ltd. London; 1975. [ Links ]
11. Sawyer R. Honey Identification. Grait Britain: Cardiff Academic Press; 1988. [ Links ]
12. Córdova CCI, Ramírez AE, Martínez HE, Zaldívar CJM. Botanical characterization of honey (Apis mellifera L.) from four regions of the state of Tabasco, Mexico, by means of melisopalynological techniques. Univer Cienc Tróp Húmedo. 2013;29(1):163-178. [ Links ]
13. Sarmento STM, Pereira SF, Evangelista RA, Sarmento SEM, Sarmento SG, Santos NJ, et al. Phenolic compounds, melissopalynological, physicochemical analysis and antioxidant activity of jandaíra (Melipona subnitida) honey. J Food Comp Anal 2013;29:10-18. [ Links ]
14. Bobi O, Mãrghita LA, Dezmirean DS, Bãrnu³iu LI, Mãrgãoan R, Bogdan Gherman B, Bonta V. The Importance of melissopalynology in addition to physical-chemical analysis on botanical authenticity testing of monofloral honey. Bull UASVM Anim Sci Biotechnol 2013;70(1)24-30. [ Links ]
15. Di Girolamo F, D’Amato A, Righetti PG. Assessment of the floral origin of honey via proteomic tools. J Proteom 2012;75(12):3688-3693. [ Links ]
16. Ulloa PA, Guerra R, Cavaco AM, Rosa CAM, Figueira AC, Brigas AF. Determination of the botanical origin of honey by sensor fusion of impedance e-tongue and optical spectroscopy. Comp Electr Agric 2013;94:1-11. [ Links ]
17. Kivima E, Seiman A, Pall R, Sarapuu E, Martverk K, Laos K. Characterization of Estonian honeys by botanical origin. Proceed Estonian Acad Sci 2014;63(2)183-192. [ Links ]
18. Laube I, Hird H, Brodmann P, Ullman S, Schöne-Michling M, Chisholm J, Broll H. Development of primer and probe sets for the detection of plant species in honey. Food Chem 2010;(118):979-986. [ Links ]
19. Louveaux J, Maurizio A, Vorwohl G. Methods of melissopalynology. Bee World 1978;(59):1111-1127. [ Links ]
20. Palacio ChR, Ludlow WB, Villanueva GR. Flora palinológica de la reserva de la biósfera de Sian Ka´an, Quintana Roo, México. 1era ed. Centro de Investigaciones de Quintana Roo. 1991. [ Links ]
21. Taberlet P, Gielly L, Pautou G, Bouvet J. Universal primers for amplification of three non-coding regions of chloroplast DNA. Plant Mol Biol 1991;17:1105-1109. [ Links ]
22. Ririe KM, Rasmussen RP, Witter CT. Product differentiation by analysis of DNA melting curves during polymerase chain reaction. Anal Biochem 1997;(245):154-160. [ Links ]
23. Nygren J, Svanvik N, Kubista M. The interactions between the fluorescent dye thiazole orange and DNA. Biopolymers 1998;46(1):39-51. [ Links ]
24. McCauley DE, Sundby AK, Bailey MF, Welch ME. Inheritance of chloroplast DNA is not strictly maternal in Silene vulgaris (Caryophyllaceae): evidence from experimental crosses and natural populations. Am J Bot 2007(94):1333-1337. [ Links ]
25. Huang S, McDowell JM, Weise MJ, Meagher RB. The Arabidopsis Profilin Gene Family. Evidence for an ancient split between constitutive and pollen-specific Profilin genes. Plant Physiol 1999;(111):115-126. [ Links ]
Received: September 14, 2015; Accepted: November 27, 2015
 Este es un artículo publicado en acceso abierto bajo una licencia Creative Commons
