


Servicios Personalizados
Revista
Articulo
 texto en
  Inglés (pdf)
 Artículo en XML
 Referencias del artículo
 Enviar artículo por email
Indicadores
-
 Citado por SciELO
 -
 Accesos
Links relacionados
-
 Similares en
SciELO
Similares en
SciELO
Compartir

 Permalink
Revista mexicana de ciencias pecuarias
versión On-line ISSN 2448-6698versión impresa ISSN 2007-1124
Rev. mex. de cienc. pecuarias vol.7 no.3 Mérida jul./sep. 2016
Research Notes
Regional specialization and growth of the livestock sector in Mexico, 1994-2013
a Centro Universitario UAEM Temascaltepec. Universidad Autónoma del Estado de México. Barrio de Santiago s/n, Temascaltepec, Estado de México. 51300. México. Correo electrónico: gomte61@yahoo.com. Correspondencia al tercer autor.
b Centro Universitario UAEM Texcoco. Universidad Autónoma del Estado de México.
Macroeconomic policies adopted by Mexico caused modifications in the productive structure of national and local livestock sector. The aim of the research was to determine the growth of livestock activities and regional specialization in eight regions of Mexico (Northwest NW, North NR, Northeast NE, Central West CW, Central East CE, South SU, East E and Yucatán Península PE) and assess its economic dynamics from 1994 to 2013. Regional analysis techniques such as location quotient and modified differential -structural method were used. The results indicated that in 1994, 2003 and 2013, the regions NW, NE, CE, SU and E specialized in beef, and the last region in conjunction with CE in chicken also. NR region specialized in milk; and NW, CW and PE regions was pork. NE, CW and CE regions also specialized in chicken egg. From 1994 to 2003, the NR, SO, CE and NW regions were dynamics, because the growth of the regional livestock sector (19.94, 11.59, 7.04 and 6.59 %) was higher than the national growth (4.08 %); the rest of the lagged behind regions. From 2003 to 2013, the regional livestock sector dynamics changed. The CW, EA and PE lagging regions in the previous period, became dynamic in this period and which were dynamic (NW, NR, CE and SO), they behaved behind. The NE region remained behind during the two periods. It concludes that the livestock sector showed a different dynamics and specialization between regions in Mexico.
Key words: Regional dynamics; Differential-structural method; Livestock sector
Las políticas macroeconómicas adoptadas por México, ocasionaron una modificación en la estructura productiva del sector pecuario nacional y local. El objetivo del estudio fue determinar el crecimiento de las actividades pecuarias y la especialización regional en ocho regiones de México (Noroeste NO, Norte NR, Noreste NE, Centro- Occidente CO, Centro-Este CE, Sur SU, Oriente OR y Península de Yucatán PE) y evaluar su dinámica económica de 1994 a 2013. Se utilizaron técnicas de análisis regional, como el cociente de localización y el método diferencial-estructural modificado. Los resultados indicaron que en 1994 y 2013, las regiones NO, NE, SU y OR se especializaron en carne de bovino, y esta última, conjuntamente con CE también en pollo. La región NR se especializó en leche; en tanto que en NO, CO y PE fue en carne de cerdo. Las regiones NE, CO y CE también se especializaron en huevo de ave. De 1994 a 2003, las regiones NR, SU, CE y NO fueron dinámicas, ya que el crecimiento del sector pecuario regional (19.94, 11.59, 7.04 y 6.59 %), fue superior al nacional (4.08 %); el resto de las regiones se rezagaron. De 2003 a 2013, la dinámica regional del sector pecuario cambió. Las regiones CO, OR y PE rezagadas en el periodo anterior, fueron dinámicas en este periodo y, las que fueron dinámicas (NO, NR, CE y SU), se rezagaron. La región NE permaneció rezagada durante los dos periodos. Se concluye que el sector pecuario mostró una dinámica y especialización distinta entre las regiones de México.
Palabras clave: Dinámica regional; Método diferencial-estructural; Sector pecuario
In the last 15 yr, the Mexican agricultural sector showed an evolution that was characterized by a lower growth rate and a volatility that threatened production1. Among the activities of the sector, livestock had a greater dynamism than agricultural, because in different periods (1995-2000, 2001- 2006 and 2007-2010) it maintained rates of annual average growth of 4.60, 3.58 and 3.42 %, while agriculture grew at 0.55, 2.82 and 0.78 %2.
During 2001 -2010, real income of livestock production in Mexico, grew 23.66 %, of which, egg and poultry recorded the largest increase (38.29, 35.72 %), followed by beef, milk and swine (19.52, 15.82, 10.79 %), growths that were explained by increases in production and prices thereof3. During this period, the poultry industry had the highest dynamism, due to growth in Jalisco, Veracruz, Durango, Queretaro and Puebla; where poultry companies whose strategy was based on the absorption of small businesses are positioned. The cattle and pigs were less dynamic, since the growth of these species in the northwest regions, west and south, was slow4. The change in the regional production structure of the livestock sector in Mexico, has shown marked differences over time, due to the uneven growth of its activities.
Some studies5,6,7 have addressed issues related to specialization and regional growth of livestock activities in Mexico; however, these have been rare, and have only been aimed at analyzing the pork sector.
Therefore, an analysis of dynamics of livestock production to product and regional level is necessary, which would allow illustrate changes and trends at the regional level. All this, as indicators to guide planners and designers of regional development programs, and can be used by them as tools that will allow to formulate economic policies that incentivize the livestock sector with more of a territorial focus. Therefore, the aim of the study was to determine the growth of livestock activities and the regional specialization in eight regions of Mexico and assess their economic dynamics from 1994 to 2013. The hypothesis was that regional specialization helps explain the growth of the livestock sector in the territory.
To carry out the regional economic analysis, Mexico was divided into eight regions; Northwest, NW (Baja California, Baja California Sur, Sonora, Sinaloa and Nayarit); North, NR (Chihuahua, Coahuila, Durango, San Luis Potosi and Zacatecas); Northeast, NE (Nuevo Leon and Tamaulipas); Central-West, CW (Aguascalientes, Colima, Guanajuato, Jalisco and Michoacan); Central-East, CE (Federal District, Hidalgo, State of Mexico, Morelos, Puebla, Queretaro and Tlaxcala); South, SU (Chiapas, Guerrero and Oaxaca); East EA (Tabasco and Veracruz); and Yucatan Peninsula, PE (Campeche, Yucatan and Quintana Roo)8.
The behavior of the value of the actual production in the activities of the livestock sector at the regional and national level during the periods 1994-2003 and 2003-2013 was analyzed for pork, chicken, milk, beef and chicken eggs.
The first period included the start of Free Trade Agreement with North America (NAFTA) and ended with removal of tariffs for livestock products (except milk powder); while the second period, involved full tariff elimination for agricultural products9 and ended with the evolution of the sector to more recent times.
Two regional analysis techniques (ART) were used: location quotient10) and the “shift and share” method with modification of structures (known as a modified differential - structural method)11. Both tools are part of research and diagnostic manuals used in ECLAC (Economic Commission for Latin America) in order to measure and characterize a region by describing basic production units10.
The indicators were calculated by developing three types of sector-region matrices (SECRE)10 that consisted of a double entry table, where rows represent the activities of the livestock sector and the columns the regions studied. The information processing was performed with the TASK v3.0 software12) and Microsoft Excel 2011. The variable analysis used was the value of regional output at constant prices (Base 2012= 100) for each of the livestock products. The current values by State were obtained from the Agricultural Information System and Fisheries (SIAP)13.
The location quotient (Qij), indicates the relative size of an activity in a region, compared to the relative size of the same activity at the national level. Qij expression is:

Where Vij= value of the variable V corresponding to the activity “i” and the region “j”; Σi Vij= value of the variable V for the regional total; Σj Vij= value of the variable V corresponding to the national total activity “i”; Σi Σj Vij= value of the variable V corresponding to the national total.
The values assumed for Qij are: Qij= 1, indicates that if relative size of the activity “i” in the region “j” is identical to the relative size of the same activity in the country, then there is no regional specialization in the activity “i”. Qij < 1 indicates that if the relative size of the activity “i” in the region “j” is less than the relative size of the same activity in the country, no regional specialization in the activity “i”. Qij> 1, indicates that if the relative size of the activity “i” in the region “j” is greater than the relative size of the same activity in the country, there is a regional specialization in the activity “i”.
The differential- structural modified method is used to compare the observed change in a variable that has occurred over a period of time, both in a region and in a country10. This method was used to determine whether the regional specialization evolved into sectors that are more dynamic or to see if the structural change was characterized by a specialization in sectors in decline at the end of the study.
The "shift and share" structural modification methodology, is broken down into four components: the total effect (TE), as amended regional effect (ARE), structural effect (SE) and modified structural effect (MSE).
TE compares the final value of the variable under study in region j, the value that hypothetically would have had this variable if the region had behaved like the country, in terms of growth. The expression of TE is:

Where Vij= value of the variable V corresponding to the activity "i" in the region "j".
0= initial year; t= final year; rSR= coefficient of variation at national level where rSR=
A positive TE indicates "hypothetical gain" due to the increased growth of the livestock sector in the region, compared to the national. A negative TE indicates "hypothetical loss", as the sector's growth in the region was lower than in the country10. TE is given by the combination of the modified regional effect (ARE), structural effect (EE) and modified structural effect (MSE).
TEj= AREj + SEj + MSEj
The structural effect reflects the difference in the composition of activities between the region and the country, derived from a different production structure at beginning of period10. The SE expression is:

Where national rSi = coefficient of variation activity

A positive SE indicates regional specialization at the beginning of the period in dynamic activities in the country; while a negative SE refers regional specialization in activities in decline at the national level.
The modified structural effect indicates the change in the difference in the regional production structure at the beginning and at end of the study period. It is obtained through the inverse difference structural effect EI and SE.
MSEj= EIj - SEj
Where:
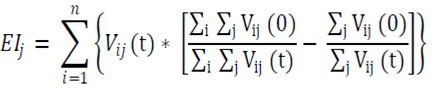
A positive MSE, indicates regional specialization at the end of the period of dynamic activity in the country; while a negative MSE, refers regional specialization in activities in decline nationally.
The modified regional effect, determines the regional dynamics of each activity. This expression is:
AREj= TEj - SEj - MSEj
A positive ARE indicates that the region is winning; while a negative ARE indicates that the region is losing12.
During the years of study, all regions of Mexico obtained positive ratios, below and above the unit value, distributed in different livestock activities. These values indicate the presence or absence of regional specialization since the relative size of the value of the actual production that generated those products in the regions was more or less the same as products at the national level14.
During 1994, the CW, PE, NW and SU regions specialized in pork and poultry eggs (except SU for egg); the latter two regions, did the same for beef, together with NR, NE and EA. The NR region also did it in milk, while NE and CE did so with egg and only CE with chicken (Table 1). In 2013, the regions NW, CW and EA continued their specialization in the same activities as the previous year, while the rest of the regions changed their expertise to other products. The NR region increased its specialization in milk; while the NE region continued specializing in beef and egg. The CE region continued in chicken and egg and added, milk and pork. The SU region continued to specialize in beef, pork decreased and they added chicken. The PE region increased its specialization in pork and continued with chicken meat (Table 2).
Table1. Location coefficients of actual cost of production by region of livestock activities in Mexico: 1994
| Activity | NW | NR | NE | CW | CE | SU | EA | PE |
| Beef | 1.27 | 1.02 | 1.78 | 0.76 | 0.48 | 1.55 | 1.59 | 0.80 |
| Chicken meat | 0.38 | 0.75 | 0.76 | 0.83 | 1.82 | 0.54 | 1.18 | 1.60 |
| Bovine milk | 0.46 | 1.95 | 0.17 | 1.15 | 0.95 | 0.77 | 0.85 | 0.10 |
| Pork meat | 1.76 | 0.26 | 0.66 | 1.23 | 0.84 | 1.29 | 0.48 | 1.84 |
| Chicken egg | 1.26 | 0.57 | 1.37 | 1.32 | 1.40 | 0.29 | 0.12 | 1.07 |
Regions of Mexico: Northwest (NW); North (NR); Northeast (NE); Center-West (CW); East Central (CE); South (SU); East (EA) and Yucatan Peninsula (PE).
Table 2 Location ratios of actual cost of production by region for livestock activities in Mexico: 2013
| Activity | NW | NR | NE | CW | CE | SU | EA | PE |
| Beef | 1.64 | 1.02 | 1.54 | 0.63 | 0.59 | 1.68 | 1.68 | 0.69 |
| Chicken meat | 0.61 | 0.98 | 0.93 | 0.87 | 1.29 | 1.05 | 1.22 | 1.29 |
| Bovine milk | 0.40 | 2.18 | 0.21 | 0.94 | 1.04 | 0.86 | 0.66 | 0.09 |
| Pork meat | 1.62 | 0.18 | 0.89 | 1.05 | 1.02 | 0.92 | 0.96 | 2.33 |
| Chicken egg | 0.88 | 0.33 | 1.38 | 1.80 | 1.06 | 0.16 | 0.07 | 0.86 |
Regions of Mexico: Northwest (NW); North (NR); Northeast (NE); Center-West (CW); Central East (CE); South (SU); East (EA) and Yucatan Peninsula (PE).
During the study, in some regions there was a tendency to specialize in certain livestock activities, such as regions NW, NE, SU and EA in beef meat. The productive vocation of the first two can be partly explained by their cow-calf grazing system of production and their feedlot for fattening with high technological levels partly explained. While regions SU and EA are productive areas with dual-purposes and providing areas for fattening calves and finishing feedlots, where their destinations are the markets of central Mexico15.
In comparison, the regions CE and EA remained specializing in chicken meat. Its production profile is positioned as such due to the high technological level of poultry companies located in Veracruz and Queretaro, whose strategy has been based on the absorption of small businesses4. The permanence of the NR region in bovine milk was explained by the dynamics of intensive cattle farming located in the Laguna region (Coahuila and Durango), where companies use a high degree of mechanization16 which is reflected in its productivity in the use of labor and land and make the activity profitable and competitive17.
The NW, PE and CW regions remained specialized in pig meat. The vocation of the first two, can be explained by the dynamics of pork production in Sonora and Yucatan5, which was based on the implementation of new forms of marketing, export dynamics and advanced technologies6,18. In the CW region, the pig remained an activity of slow growth5, because of lack of supportive policies and inefficient use of resources7, with a low level of productivity19 and low degree of mechanization compared to companies positioned in Jalisco20; this led to classification of the region as a laggard region5.
Some regions such as CW, CE and NE also specialized in poultry eggs, its productive vocation explained by the dynamics of Jalisco, Puebla and Nuevo Leon; entities with high-technology companies that were able to increase their efficiency and productivity of their production systems21.
Although the location quotient generates information about presence or absence of regional specialization, there are causes that affect its magnitude, such as income distribution, consumption habits, technology and efficient use of resources. Its scope depends on the level of disaggregation of information10.
In the period 1994 to 2003, NR, CE, SU and NW regions had a positive overall effect (TE) due to higher growth in the value of real output recorded by the livestock sector in the regions, compared with growth in the country; therefore, these regions were considered as dynamic (Table 3).
Table 3 Coefficients obtained from the application of the modified differential -structural method to the actual cost of production by region of livestock activities in Mexico: 1994-2003 (millions of Mexican pesos)
| Effects | ||||
| Region | Total | Structural | Modified structural | Modified regional |
| NW | 539.35 | -1,077.11 | -79.29 | 1,695.76 |
| NR | 4,427.86 | -200.92 | 318.61 | 4,310.17 |
| NE | -590.13 | -462.98 | 265.74 | -392.89 |
| CW | -1,990.24 | 427.32 | 507.73 | -2,925.29 |
| CE | 1,018.99 | 2,496.59 | -462.95 | -1,014.65 |
| SU | 948.95 | -781.61 | 65.75 | 1,664.81 |
| EA | -2,802.05 | -690.41 | -235.16 | -1,876.48 |
| PE | -1,552.73 | 289.13 | -380.42 | -1,461.44 |
Regions of Mexico: Northwest (NW); North (NR); Northeast (NE); Center-West (CW); Central East (CE); South (SU); East (EA) and Yucatan Peninsula (PE).
TE values in regions NR and SU had greater impact, due to the role that the modified regional effect (ARE) and modified structural effect (MSE), which were also positive. ARE values indicated that chicken meat and bovine milk recorded higher growth in the regions, than in the country. MSE values meant that regions modified their production structure at the end of the period and reoriented their specialization towards dynamic activities at the national level such as with milk and chicken meat. The positive value of TE in the NW region was not influenced by the value of ARE, which meant increased growth of poultry meat, milk, beef and pork meat in the region, compared with that recorded in the country (Table 4).
Table 4 Growth in the cost of actual production by region of livestock activities in Mexico: 1994-2003 (%)
| Activity | NW | NR | NE | CW | CE | SU | EA | PE | National |
| Beef | -2.08 | -6.38 | -30.46 | -26.81 | -7.66 | -4.86 | -16.96 | -11.88 | -14.29 |
| Chicken meat | 78.99 | 84.36 | 84.87 | 37.09 | 14.06 | 90.97 | -0.35 | -33.31 | 29.28 |
| Bovine milk | 30.23 | 24.72 | 21.82 | -11.29 | 10.59 | 31.49 | -12.24 | -4.12 | 6.96 |
| Pork meat | 5.52 | -12.77 | 26.39 | -3.05 | -11.92 | 1.03 | 33.20 | 8.19 | 1.13 |
| Chicken egg | -21.41 | -2.81 | -14.52 | 31.16 | 17.59 | -30.38 | 1.98 | -15.26 | 11.04 |
| Livestock | 6.59 | 19.94 | -3.22 | 0.57 | 7.04 | 11.59 | -8.16 | -12.57 | 4.08 |
Regions of Mexico: Northwest (NW); North (NR); Northeast (NE); Center-West (CW); Central East (CE); South (SU); East (EA) and Yucatan Peninsula (PE).
The TE in the CE region was determined by the value of EE, this meant that the region specialized at beginning of period in dynamic activities at the national level as chicken meat and egg. Meanwhile, regions EA, CW, PE and NE had negative TE. These values indicated that the growth of real output value of the livestock sector in the regions was lower than that obtained by the country; therefore, these regions were considered as laggards, and specialization in activities in decline at the national level, such as beef and pork.
During 2003 -2013, CW, EA and PE regions had positive TE, due to the higher growth of real output value of the livestock sector in these regions compared to registered in the country; therefore, these regions were considered dynamic (Table 5).
Table 5 Coefficients obtained from the application of the differential-structural method, modified to the actual cost of livestock production by region in Mexico: 2003-2013 (millions of Mexican pesos)
| Effects | ||||
| Region | Total | Structural | Modified Structural | Modified Regional |
| NW | -2,600.70 | -881.88 | 469.75 | -2,188.56 |
| NR | -2,179.23 | -2,320.51 | 512.12 | -370.85 |
| NE | -2,409.47 | 329.74 | -138.80 | -2,600.41 |
| CW | 11,994.62 | 2,245.53 | 209.48 | 9,539.61 |
| CE | -5,147.92 | 2,882.28 | -2,250.69 | -5,779.50 |
| SU | -1,377.89 | -1,134.64 | 590.87 | -834.12 |
| EA | 580.47 | -1,227.26 | 523.10 | 1,284.63 |
| PE | 1,140.12 | 106.73 | 84.17 | 949.21 |
Regions of Mexico: Northwest (NW); North (NR); Northeast (NE); Center-West (CW); Central East (CE); South (SU); East (EA) and Yucatan Peninsula (PE).
The magnitude and sign of TE in these regions are due to the positive contribution of all factors that generate it (except SE in the region EA). The ARE indicated that activities such as chicken, pork (except CW), beef and egg (except EA and PE) and milk (except EA and PE) obtained higher growth in the regions, compared to the same activities in the country (Table 6).
Table 6 Growth of real output value by region of livestock activities in Mexico: 2003-2013 (%)
| Activity | NW | NR | NE | CW | CE | SU | EA | PE | National |
| Beef | 47.10 | 37.50 | 8.26 | 45.38 | 45.22 | 35.03 | 34.77 | 6.45 | 37.49 |
| Chicken meat | 86.04 | 72.38 | 6.79 | 85.69 | 27.31 | 123.44 | 105.60 | 144.15 | 69.84 |
| Bovine milk | -14.63 | 34.31 | 4.19 | 38.23 | 25.52 | 15.62 | 8.13 | 8.20 | 27.15 |
| Pork meat | 13.48 | 18.39 | 7.48 | 32.80 | 76.50 | -2.70 | 86.54 | 46.92 | 35.55 |
| Egg | 87.13 | 46.37 | 95.09 | 155.29 | 34.83 | 75.88 | 19.37 | 96.13 | 101.32 |
| Livestock | 38.74 | 43.58 | 19.28 | 71.14 | 36.11 | 40.31 | 52.84 | 64.06 | 50.08 |
Regions of Mexico: Northwest (NW); North (NR); Northeast (NE); Center-West (CW); Central East (CE); South (SU); East (EA) and Yucatan Peninsula (PE).
Meanwhile the values of SE and MSE meant that regions (except EA) began and ended the period specializing in activities that are dynamic at the national level, such as chicken and egg. The regions NW, NR, NE, CE and SU had negative TE, due to the lower growth of beef, pork, chicken, milk and egg, in some regions for the country, as well as a specialization at the end of period with activities that are shrinking at the national level such as beef and pork.
The regions NR, SU, CE and NW were dynamic during the period 1994 to 2003, lagged behind in 2003 to 2013, due to an increase of the cost of production of the livestock sector in those regions. These were better for the first period (19.94, 11.59, 7.04 and 6.59 %), were inferior in the second period (43.58, 40.31, 36.11 and 38.74 %), and also inferior in relation to the growth of national livestock sector in both periods (4.08 and 50.08 %). The change of dynamism of the livestock sector in those regions is due to regional factors that caused a decrease in the growth of production volume of some activities such as poultry, meat and milk from cattle, in addition to regional specialization in activities in decline at the national level, such as milk, beef and pork.
CW, PE and EA regions lagged behind in the first period, became dynamic during the second period, because in the latter, the regional livestock sector growth exceeded the national.
The growth of chicken, egg and pork, as well as regional specialization in the first two products were the causes that determined the change in dynamics of the livestock sector in those regions.
Meanwhile, the permanent backwardness of the livestock sector in the NE region during the study was due to lower growth of most of their activities than the national average; coupled with a constant specialization in beef, this activity has slow growth in the country. In this regard, some authors5,6,7 reported the dynamics and regional growth of pig production in Mexico, which has a similar pattern in some regions and different in others because different periods were evaluated.
The presence of regional specialization, contributed to the growth of the livestock sector in those territories that had positive structural and modified structural effects.
Literatura citada
1. Escalante SRI, Catalán H. Situación actual del sector agropecuario en México: perspectivas y retos. Economía informa 2008;(350):7-25. [ Links ]
2. Basurto HS, Escalante SR. Impacto de la crisis en el sector agropecuario en México. Economíaunam 2012;9(25):51-73. [ Links ]
3. Brambila PJJ, Martínez DMA, Rojas RMM, Pérez CV. El valor de la producción agrícola y pecuaria en México: fuentes del crecimiento, 1980-2010. Rev Mex Cienc Agríc 2014;5(4):619-631. [ Links ]
4. SAGARPA. Secretaría de Agricultura, Ganadería, Desarrollo Rural, Pesca y Alimentación. Situación actual y perspectiva de la producción de carne de pollo en México 2009. http://www.sagarpa.gob.mx/ganaderia/Publicaciones/Lists/Estudios%20de%20situacin%20actual%20y%20perspectiva/Attachments/28/sitpollo09.pdf . Consultado 9 feb, 2015. [ Links ]
5. Rebollar RA, Gómez TG, Rebollar RS, Hernández MJ, González RFD. Dinámica regional de la producción porcina en México, 1994-2012. Agrociencia 2015;(49):455-473. [ Links ]
6. Bobadilla SEE, Espinoza OA, Martínez CFE. Dinámica de la producción porcina en México de 1980 a 2008. Rev Mex Cienc Pecu 2010;1(3):251-268. [ Links ]
7. Del moral BLE, Ramírez GBP, Muñoz JAR. Crecimiento regional de la producción de carne de cerdo en México, 1980-2005. Análisis económico 2008;XXIII(52):271-290. [ Links ]
8. Bassols BA. Geografía económica de México: teoría, fenómenos generales, análisis regional. 4ta ed. México, D.F: Trillas; 1980. [ Links ]
9. Ruiz FM. Evolución reciente y perspectivas del sector agropecuario en México. ICE 2005;(821):89-106. [ Links ]
10. Boisier S. Técnicas de análisis regional con información limitada. Santiago de Chile: Cuadernos del Instituto Latinoamericano y del Caribe de Planificación Económica y Social (ILPES). Serie II, número 27; 1980. [ Links ]
11. Cuadrado RJR, Mancha NT, Garrido YR. Convergencia regional en España: hechos, tendencias y perspectivas. Fundación Argentaria España: Visor; 1998. [ Links ]
12. Lira L, Quiroga B. Técnicas de análisis regional. Santiago de Chile: Manuales del Instituto Latinoamericano y del Caribe de Planificación Económica y Social (ILPES). 2003(30). [ Links ]
13. SIAP. Servicio de Información Agroalimentaria y Pesquera. Información de mercados. http://www.siap.gob.mx/?option=com_content&view=article&id=181&Itemid=426 . Consultado 9 ene, 2015. [ Links ]
14. Rendón RL, Mejía RP, Salgado VMC. Especialización y crecimiento manufacturero en dos regiones del Estado de México: un análisis comparativo. Economía: teoría y práctica 2013;(38):111-148. [ Links ]
15. Financiera Rural. Monografía de carne de bovino 2012. http://www.financierarural.gob.mx/informacionsectorrural/Documents/Monografias/Monograf%EDaCarneBovino(feb2012).pdf . Consultado 12 feb, 2015. [ Links ]
16. Ruiz GJL, Aguilar VA, Gómez GG, Ruiz LJ. Circuitos de gestión del conocimiento: innovación para la competitividad de la agroindustria lechera en la región lagunera (Coahuila-Durango, México). Rev Mex Agronegocios 2005;IX(17):1-18. [ Links ]
17. Odermatt P, Santiago CMJ. Ventajas comparativas en la producción de leche en México. Comercio Exterior 1997:955-961. [ Links ]
18. Sierra MLD, Ortiz RB, Sierra VAC, Rivera LJA, Sanginés GJR, Magaña MMA. Estructura del mercado y comportamiento del precio de la carne de cerdo en Yucatán. Téc Pecu Méx 2005;43(3):347 -360. [ Links ]
19. Bobadilla SEE, Franco MS, Regil GHH, Martínez CFE. Inventario porcino y su evolución en México. En: Bobadilla SEE, Martínez CFE editores. Porcicultura mexicana: auge y crisis de un sector. México: Universidad Autónoma Chapingo; 2013:33 -51. [ Links ]
20. Nava NJJ, Trueta SR, Finck VB, Barranco VB, Osorio HE, Lecumberri LJ. Impactos del nivel tecnológico en la eficiencia productiva y variables económicas, en granjas porcinas de Guanajuato, Jalisco, Sonora y Yucatán. Téc Pecu Méx2009;47(2):157-172. [ Links ]
21. ASERCA. Agencia de Servicios a la Comercialización y Desarrollo de Mercados Agropecuarios. Huevo. Claridades Agropecuarias 1996;(36):1-44. [ Links ]
Received: July 10, 2015; Accepted: October 15, 2015
 Este es un artículo publicado en acceso abierto bajo una licencia Creative Commons
