


Services on Demand
Journal
Article
 text in
  English (pdf)
 Article in xml format
 Article references
 Send this article by e-mail
Indicators
-
 Cited by SciELO
 -
 Access statistics
Related links
-
 Similars in
SciELO
Similars in
SciELO
Share

 Permalink
Revista mexicana de ciencias pecuarias
On-line version ISSN 2448-6698Print version ISSN 2007-1124
Rev. mex. de cienc. pecuarias vol.7 n.3 Mérida Jul./Sep. 2016
Articles
Development of the endocrine reproductive axis in hair breed ram lambs
a Centro Nacional de Investigación Disciplinaria en Fisiología y Mejoramiento Animal, INIFAP. Ajuchitlán, Querétaro, México. Correo electrónico: jimenez.hector@inifap.gob.mx. Correspondencia al sexto autor.
b Posgrado en Ciencias de la Producción y de la Salud Animal, FES Cuautitlán, UNAM. Cuautitlán Izcalli, Estado de México, México.
c Centro Nacional de Investigación Disciplinaria en Microbiología Animal, INIFAP. Cuajimalpa, DF, México.
d Instituto Nacional de Ciencias Médicas y Nutrición Salvador Zubirán. Tlalpan, DF, México.
The objectives were to characterize the profiles of LH and testosterone (T) and the response to GnRH administration in hair ram lambs. Study 1: seventeen lambs were used: Blackbelly (n=4), Pelibuey (n=5), Blackbelly x Pelibuey (Crossbred; n=8). At 2, 4, 8, 12, 16, 20 and 24 wk of age, blood samples were collected every 15 min for 6 h, to characterize LH and T profiles. There was no significant difference between genotypes at any age, for any variable of LH and T profiles (P>0.05). The effect of age was significant (P<0.05): mean LH concentration was lower on wk 2 (P<0.05), achieved the highest value on wk 12, and decreased on wk 16 (P<0.05). Mean T concentration increased steadily between wk 2 and 24 (P<0.05). Study 2: twelve lambs were used: Blackbelly (n=4), Pelibuey (n=4), Crossbred (n=4). At the same ages, lambs were challenged with GnRH (3, 9, 27 ng•kg-1 BW) and blood samples were obtained between -15 and 180 min from GnRH administration. On wk 8 and 12, LH response to GnRH was greater in Pelibuey, as compared with Blackbelly. Testosterone response tended to be different between genotypes (P<0.10), with Blackbelly showing the smallest response. In conclusion, the sexual endocrine development, as evaluated by the non-stimulated LH and T profiles, was not different among genotypes; however, Pelibuey elicited the greatest responsiveness to GnRH administration at 8 and 12 wk of age. Whether or not such differences have implications on the reproductive capacity of the adult animals deserves additional research.
Key words: Blackbelly; Pelibuey; LH; Testosterone; Sexual development
Los objetivos fueron caracterizar los perfiles de LH y testosterona (T) y la respuesta a GnRH en corderos de pelo. Estudio 1: se utilizaron corderos Blackbelly (n=4), Pelibuey (n=5), Blackbelly x Pelibuey (Cruzas; n=8). A las 2, 4, 8, 12, 16, 20 y 24 semanas de edad, se obtuvieron muestras de sangre cada 15 min durante 6 h, para caracterizar los perfiles de LH y T. No hubo diferencia entre genotipos a ninguna edad, para ninguna variable de LH y T (P>0.05); el efecto de la edad fue significativo (P<0.05): la concentración promedio de LH fue menor en la semana 2 (P<0.05), alcanzó el valor más alto en la 12, y disminuyó en la 16 (P<0.05). La concentración promedio de T aumentó constantemente entre 2 y 24 semanas (P<0.05). Estudio 2: se utilizaron corderos Blackbelly (n=4), Pelibuey (n=4), Cruzas (n=4). A las mismas edades, los corderos se desafiaron con GnRH (3, 9, 27 ng•kg-1 peso) y se obtuvieron muestras de sangre entre - 15 y 180 min. En las semanas 8 y 12, la respuesta de LH fue mayor en los corderos Pelibuey, en comparación con Blackbelly. La respuesta de T tendió a ser diferente entre genotipos (P<0.10), con Blackbelly mostrando la menor respuesta. En conclusión, el desarrollo de los perfiles de LH y T no fue diferente entre genotipos, pero los corderos Pelibuey presentaron mayor capacidad de respuesta a GnRH en las semanas 8 y 12; es necesario determinar si estas diferencias tienen implicaciones sobre la capacidad reproductiva de los animales adultos.
Palabras clave: Blackbelly; Pelibuey; LH; Testosterona; Desarrollo sexual
Introduction
The sexual endocrine development has been studied in lambs of wool breeds1,2, whereas in tropical hair sheep this information is scarce. From studies in wool breeds, several aspects have been described. It is known that there is an active endocrine axis in the new born lambs3, which develops as the ram grows1; the anatomical and histological changes during the prepubertal development are associated to endocrine changes4. The age at sexual maturation differs among breeds, some breeds being more precocious than others, and precocity is related to breed fertility and prolificacy in the adult ewe5. Barbados Blackbelly (hereafter just Blackbelly) and Pelibuey are important hair breeds (Ovis aries) developed in tropical latitudes and, therefore, well adapted to tropical conditions. Blackbelly is considered one of the most prolific hair breeds6; previous studies have shown that Blackbelly ewes are more prolific than Pelibuey ewes7,8, but litter size in Pelibuey is greater than in other breeds raised in the tropics9. Some controversy still exists as to whether Blackbelly is more precocious than Pelibuey10-13.
In Blackbelly male lambs, an early increase in serum LH was observed at 6 wk of age, with testosterone (T) increasing at wk 12 and 2114; however, this information was based on single samples taken just before castration; because of the pulsatile nature of LH and T secretion, a more frequent blood sampling is necessary to characterize accurately the hormonal profiles and sensitivity of the hypophysis-testis axis. Furthermore, to our knowledge, comparison, in terms of endocrine development, between Blackbelly and Pelibuey males have not been made; therefore, the objective of this study was to characterize the development of the endocrine reproductive axis in Blackbelly, Pelibuey and Blackbelly x Pelibuey ram lambs. The hypothesis was that the endocrine axis will develop earlier in Blackbelly, as compared with Pelibuey lambs, with crossbred lambs being intermediate.
Material and methods
Two studies were conducted using hair ram lambs: Blackbelly, Pelibuey and Blackbelly x Pelibuey (Crossbred). In the first study, the development of the circulating profiles of LH and T were evaluated by means of serial blood samplings. In the second study, graded doses of GnRH were administered to evaluate the development of the response, in terms of LH and T secretion.
General conditions
The studies were carried out in the state of Querétaro, México (20o 42’ N; 100o 01’ W). The experimental protocols and procedures were approved by the Institutional Subcommittee for Caring and Use of Animals for Experimentation (SICUAE), College of Veterinary Medicine and Animal Husbandry, National Autonomous University of Mexico, and according to the “International Guiding Principles for Biomedical Research Involving Animals” (http://www.cioms.ch/images/stories/CIOMS/IGP2012.pdf). Ram lambs were born between March 2 and 29 (Study 1) or between October 29 and November 14 (Study 2). Before weaning (70 d of age), lambs were creep fed a diet containing 16.9 % CP and 2.74 Mcal ME/kg DM, and ewes were fed a diet containing 13.04 % CP and 2.33 Mcal ME/kg DM. After weaning, lambs were offered a diet with 14.05 % CP and 2.65 Mcal ME/kg DM, and water ad libitum. One day before each lamb reached 2, 4, 8, 12, 16, 20 and 24 wk of age, body weight (BW) was recorded, scrotal circumference (SC) was measured as described previously15, and lambs were fitted with indwelling jugular catheters. At that time and at the end of samplings, lambs were administered vitamin B complex (thiamin 0.15 g, riboflavin 0.2 g, nicotinamide 0. 3 g, pyridoxine 0.2 g, cyanocobalamin 90 µg and D-panthenol 0.15 g), to prevent anemia, and a long -acting oxytetracycline solution (20 mg•kg-1 BW) in a prophylactic manner, as the catheter remained in the vein for at least one day.
Study 1. Development of LH and testosterone profiles
Ram lambs were allotted in three homogeneous genotype groups, based on birth weight, type of birth and age of the mother: Blackbelly (n=4), Pelibuey (n=5) and Crossbred (n=8). At 2, 4, 8, 12, 16, 20 and 24 wk of age, blood samples were collected every 15 min, during 6 h (0700 to 1300 h), and centrifuged at 720 xg for 15 min at 4 oC; plasma was obtained and kept frozen at -20 oC until assayed. The profile variables evaluated for LH and T were mean and basal concentrations (ng•ml-1), frequency (pulses•6h-1), amplitude and height of the pulses (ng•ml-1). Pulse detection was performed using computer algorithms16 (Pulsar software, modified for IBM-PC by JF Gitzen and VD Ramirez, Urbana, IL). G(n)-values (G(n): cut-off parameters to determine if one point value or a series of consecutive values belong to a pulse-16), for LH were G(1)=10.0, G(2)=2.6, G(3)=1.9, G(4)=1.5 and G(5)=1.1; for T were G(1)=3.8, G(2)=2.6, G(3)=1.9, G(4)=1.5 and G(5)=1.1. The standard deviation of the assays used in the algorithm was modeled as a quadratic function of the dose for each hormone.
Study 2. Development of LH and testosterone response to GnRH administration
Experimental plan, GnRH administration and blood sample collection. Ram lambs were allotted in three homogeneous genotype groups, based on birth weight, type of birth and age of the mother: Blackbelly (n=4), Pelibuey (n=4) and Crossbred (n=4). The acetate salt of the natural sequence of GnRH was used (Sigma Chemical Co., St Louis, MO.). At the same ages as in the study 1, animals were challenged in consecutive days with graded doses of GnRH: 3, 9 and 27 ng•kg-1 BW, via i.v. (small, medium and large dose, respectively), starting with the small dose at each age. The small dose was established based on a previous study with adult rams, where it was calculated that the administration of 3 ng•kg-1 generated LH pulses with characteristics similar to non-induced pulses17; therefore, it was initially considered as the physiological dose. Blood samples were collected at -15, 0, 15, 30, 60, 120 and 180 min from GnRH administration (0700 to 1015 h), and processed as explained for study 1.
Analysis of the hormonal response to GnRH administration. The variables of LH and T response to GnRH administration were the following: peak height (the highest hormone concentration subsequent to GnRH administration); area under the curve of response (AUC), which was calculated using the trapezoid rule from the initial concentration (average of the -15 and 0 min samples) until 3 h after GnRH administration; magnitude of the response (ΔLH and ΔT), calculated by subtracting the average initial concentration from the peak height, and using the initial concentration as a covariable for each hormone.
Hormone analysis
LH concentrations were determined by a double antibody RIA18, sensitivity was 95 pg•ml-1, the intra - and inter- assay CV were 8.6 and 9.5 %, and 14.2 and 7 % for studies 1 and 2, respectively. Testosterone concentrations were determined by a solid phase RIA (Coat-A-Count®, Siemens Medical Solutions Diagnostic; Los Angeles CA, USA); sensitivity was 40 pg•ml-1; the intra - and inter-assay CV were 4.9 and 7.1 %, and 5 and 5.9 % for studies 1 and 2, respectively.
Statistical analyses
Hormone data were analyzed as a completely randomized design, using the procedure MIXED of SAS (SAS Institute Inc. Cary NC, USA) for repeated measures, with the statement “repeated”, the option sub=animal (genotype) and the autoregressive (1) covariance structure within animal. Genotype, age (and dose in study 2) and the corresponding interactions were included in the model. The endocrine variables were transformed to Logn (Y+1), so the assumptions of the analysis of variance were valid; after analysis, data were transformed back to actual values for tables and figures. Data of BW and SC were pooled across studies before the analysis, and each study was included in the model as a block. Differences were considered significant with P<0.05, and tended to be significant with P values between 0.05 and 0.1.
Results
Development of LH profiles
The effect of genotype and genotype by age interaction were not significant for any of the variables of LH profiles, whilst the effect of age was significant for all variables (Table 1). The smallest mean concentration was observed on wk 2, an elevation was detected on wk 4 (P<0.05); then, there was a progressive increase, reaching the greatest concentration on wk 12 to fall on wk 16 (P<0.05), with an additional increase observed on wk 24 (P<0.05). Basal concentration did not change from 2 to 8 wk; then, increased at wk 12 (P<0.05), when reached a plateau until wk 20, with an additional increase on wk 24 (P<0.05). Pulse frequency was greatest on wk 8, but no differences were detected from 2 to 20 wk, whilst the least frequency was detected on wk 24 (P<0.05). Pulses of low amplitude were detected on wk 2; then, amplitude increased drastically on wk 4 (P<0.05) to reach the greatest value on wk 12, with a decreasing trend thereafter.
Table 1 Means ± SE for variables of LH and testosterone plasma profiles in hair ram lambs from weeks 2 to 24 of age
| Age | Mean concentration | Basal concentration | Pulse frequency | Pulse amplitude | |
| Hormone | (weeks) | (ng•ml-1) | (ng•ml-1) | (pulses•6 h-1) | (ng•ml-1) |
| LH | 2 | v1.18 ± 0.24 | v0.71 ± 0.18 | vw2.35 ± 0.33 | v2.74 ± 0.46 |
| 4 | w2.16 ± 0.34 | vw0.89 ± 0.19 | vw2.29 ± 0.21 | wx8.02 ± 1.46 | |
| 8 | wx2.52 ± 0.43 | vw1.07 ± 0.23 | w2.59 ± 0.26 | wx7.31 ± 1.11 | |
| 12 | xy3.42 ± 0.35 | x1.94 ± 0.31 | vw1.76 ± 0.32 | x11.11 ± 1.78 | |
| 16 | w2.33 ± 0.25 | wx1.40 ± 0.20 | vw1.71 ± 0.21 | wx7.97 ± 1.03 | |
| 20 | wx2.48 ± 0.27 | x1.76 ± 0.25 | vw2.06 ± 0.29 | w6.00 ± 1.17 | |
| 24 | y3.77 ± 0.39 | y2.87 ± 0.35 | v1.65 ± 0.24 | wx6.56 ± 1.07 | |
| Testosterone | 2 | v0.07 ± 0.01 | v0.04 ± 0.00 | v0.40 ± 0.16 | v0.69 ± 0.21 |
| 4 | vw0.17 ± 0.03 | v0.04 ± 0.00 | w1.20 ± 0.26 | v1.00 ± 0.16 | |
| 8 | w0.33 ± 0.07 | v0.09 ± 0.02 | wx1.60 ± 0.21 | v0.95 ± 0.15 | |
| 12 | x0.76 ± 0.14 | w0.30 ± 0.09 | x2.00 ± 0.31 | v1.85 ± 0.28 | |
| 16 | y1.69 ± 0.22 | w0.46 ± 0.11 | wx1.87 ± 0.19 | w4.51 ± 0.43 | |
| 20 | y2.01 ± 0.29 | x0.70 ± 0.15 | wx1.60 ± 0.13 | x5.13 ± 0.73 | |
| 24 | z2.31 ± 0.22 | y1.03 ± 0.23 | wx1.47 ± 0.17 | x5.59 ± 0.48 |
vwxyz Means without a common superscript within variable and hormone are different (P<0.05).
Development of testosterone profiles
The effect of genotype and genotype by age interaction were not significant for any of the variables of T profiles, whilst the effect of age was significant for all variables (Table 1). Mean T concentration increased constantly from wk 2 to 24 (P<0.05). Basal concentration was maintained low until wk 8; thereafter, a sustained increase was observed from wk 12 to 24 (P<0.05). Pulses of low magnitude were detected in some animals at 2 wk of age, but the average frequency was very small and was different from the rest of the ages. The highest frequency was observed on wk 12, but it was not different from wk 8, 16, 20 and 24. Pulse amplitude was small between wk 2 and 8; then, significant increases were observed on wk 16 and 20 (P<0.05), with no further changes.
Development of LH and testosterone responses to GnRH administration
The effects of the main factors and the corresponding interactions on LH and T response to the administration of GnRH are shown in Table 2.
Table 2 Effect of the main factors and the corresponding interactions on peak height, area under the curve (AUC) and magnitude of the response (Δ values) of LH and testosterone, after administration of GnRH in hair ram lambs
| Variable | LH | P-value | Testosterone | P-value |
| Peak height | Genotype | 0.002 | Genotype | 0.105 |
| Dose | 0.001 | Dose | 0.001 | |
| Age | 0.001 | Age | 0.001 | |
| Genotype x Age | 0.046 | Genotype x Age | 0.425 | |
| Genotype x Dose | 0.006 | Genotype x Dose | 0.406 | |
| Dose x Age | 0.001 | Dose x Age | 0.001 | |
| Genotype x Age x Dose | 0.458 | Genotype x Age x Dose | 0.664 | |
| AUC | Genotype | 0.012 | Genotype | 0.080 |
| Dose | 0.001 | Dose | 0.001 | |
| Age | 0.001 | Age | 0.001 | |
| Genotype x Age | 0.465 | Genotype x Age | 0.644 | |
| Genotype x Dose | 0.06 | Genotype x Dose | 0.405 | |
| Dose x Age | 0.001 | Dose x Age | 0.002 | |
| Genotype x Age x Dose | 0.207 | Genotype x Age x Dose | 0.676 | |
| Δ Values | Genotype | 0.002 | Genotype | 0.082 |
| Dose | 0.001 | Dose | 0.001 | |
| Age | 0.001 | Age | 0.001 | |
| Genotype x Age | 0.063 | Genotype x Age | 0.712 | |
| Genotype x Dose | 0.034 | Genotype x Dose | 0.161 | |
| Dose x Age | 0.001 | Dose x Age | 0.001 | |
| Genotype x Age x Dose | 0.444 | Genotype x Age x Dose | 0.647 |
LH secretion after GnRH administration. The triple interaction genotype by age by dose was not significant for any of the variables of LH response (Table 2). Genotype by age interaction was or tended to be significant for peak height of LH secretion (P=0.046) and for ΔLH (P=0.063; Tables 2 and 3). There were not differences between genotypes on wk 2, 4, 16 and 20, whereas on wk 8, 12 and 24, LH response was greatest in Pelibuey lambs. Pelibuey and crossbred lambs reached the highest response on wk 8 (P<0.05), which was maintained until wk 16, whereas Blackbelly lambs did not reach the highest response until wk 16 (P<0.05); after wk 16, peak height showed a decreasing trend for all the genotypes. Genotype by dose interaction was or tended to be significant for peak height (P=0.006), AUC (P=0.06) and ΔLH (P=0.034; Table 2). No differences between genotypes were detected for the small dose (Table 4; peak height and ΔLH), but for the medium and large doses, Pelibuey had the highest and Blackbelly the lowest LH response to GnRH, with crossbred lambs being intermediate. Dose by age interaction was significant for all the variables of LH response (Table 2); differences between doses were detected at every age in a dose-dependent manner (Table 5), except for AUC at wk 2. The effects of genotype, GnRH dose and age on the three variables of LH response were significant (Table 2). Pelibuey ram lambs always showed the greatest response, as compared with Blackbelly and crossbred lambs (Table 6). The response to GnRH administration was in a dose -dependent manner (Table 6). Regarding the effect of age, the greatest LH response was observed between 8 and 16 wk of age; thereafter, the response decreased (P<0.05) for the three variables evaluated (Figure 1).
Table 3 Genotype by age interaction on peak height and magnitude of the LH response (ΔLH), after administration of GnRH. Values are means ± SE (ng•ml-1)
| Age | Genotype | |||
| Variable | (weeks) | Blackbelly | Crossbred | Pelibuey |
| Peak height | 2 | w3.59 ± 0.46a | w3.07 ± 0.63a | w4.56 ± 0.81a |
| 4 | wx5.86 ± 1.25a | wx4.70 ± 1.02a | w5.35 ± 1.19a | |
| 8 | wx6.34 ± 1.61a | z12.80 ± 3.33b | y16.86 ± 3.69b | |
| 12 | x6.71 ± 1.18a | y8.42 ± 1.53a | y14.15 ± 2.15b | |
| 16 | y10.97 ± 2.06a | z12.68 ± 1.92a | y15.64 ± 2.82a | |
| 20 | xy7.40 ± 1.04a | y6.94 ± 1.24a | x10.16 ± 1.80a | |
| 24 | xy7.10 ± 0.97ab | xy6.45 ± 1.03a | xy11.63 ± 2.29b | |
| ΔLH | 2 | w2.86 ± 0.48a | w2.39 ± 0.63a | w3.77 ± 0.77a |
| 4 | wx4.29 ± 1.27a | wx4.11 ± 0.98a | w4.4 ± 1.24a | |
| 8 | wx4.99 ± 1.6a | z11.23 ± 3.25b | y14.9 ± 3.78b | |
| 12 | wx4.59 ± 1.06a | y5.82 ± 1.68a | y11.12 ± 2.38b | |
| 16 | y8.53 ± 2.06a | z10.25 ± 1.83a | y12.95 ± 2.83a | |
| 20 | xy5.45 ± 1.05a | xy5.76 ± 1.26a | x8.87 ± 1.8a | |
| 24 | x5.04 ± 1.05a | xy5.71 ± 1.08a | xy10.59 ± 2.14b |
ab Means without a common superscript within variable and age are different (P<0.05).
wxyz Means without a common superscript within variable and genotype are different (P<0.05).
Table 4 Genotype by GnRH dose interaction on peak height (ng•ml-1), area under the curve of response (AUC; ng•ml-1•3h-1) and magnitude of the LH response (Delta LH; ng•ml-1), after administration of GnRH. (Means ± SE)
| GnRH dose | Genotype | |||
| Variable | (ng•kg-1 BW) | Blackbelly | Crossbred | Pelibuey |
| Peak height | 3 | 2.96 ± 0.37a | 2.76 ± 0.41a | 3.15 ± 0.40a |
| 9 | 7.14 ± 0.70a | 8.09 ± 0.82a | 10.89 ± 1.06b | |
| 27 | 10.56 ± 0.97a | 12.20 ± 1.34a | 19.04 ± 1.62b | |
| AUC | 3 | 316 ± 35a | 284 ± 44ab | 338 ± 34b |
| 9 | 488 ± 50a | 497 ± 40ab | 666 ± 67b | |
| 27 | 665 ± 64a | 723 ± 65ab | 1064 ± 85b | |
| ΔLH | 3 | 1.16 ± 0.23a | 1.51 ± 0.33a | 1.73 ± 0.37a |
| 9 | 5.34 ± 0.67a | 6.59 ± 0.77ab | 9.06 ± 0.97b | |
| 27 | 88.84 ± 0.94a | 10.78 ± 1.26a | 17.27 ± 1.63b |
ab Means without a common superscript within variable and dose are different (P<0.05).
Table 5 Dose by age interaction on peak height (ng•ml-1), area under the curve of response (AUC; ng•ml-1•3h-1) and magnitude of the LH response (ΔLH; ng•ml-1), after administration of GnRH. (Means ± SE)
| Doses of GnRH | ||||||
| Variable | Age(weeks) | 3 ng•kg-1 BW | 9 ng•kg- 1 BW | 27 ng•kg-1 BW | ||
| Peak height | 2 | wx2.36 ± 0.60a | w3.33 ± 0.34b | w5.68 ± 0.67c | ||
| 4 | w2.08 ± 0.70a | w4.64 ± 0.84b | x9.33 ± 0.98c | |||
| 8 | wx2.33 ± 0.37a | x11.81 ± 1.73b | z23.31 ± 3.10c | |||
| 12 | y4.59 ± 0.75a | x10.58 ± 1.31b | y14.40 ± 2.25c | |||
| 16 | y3.95 ± 0.53a | y14.43 ± 1.34b | z21.00 ± 2.06c | |||
| 20 | x2.61 ± 0.32a | x8.73 ± 0.71b | y13.42 ± 1.21c | |||
| AUC | 24 | x2.68 ± 0.38a | x8.73 ± 0.76b | y14.18 ± 1.83c | ||
| 2 | w252 ± 47a | w222 ± 22a | w344 ± 36b | |||
| 4 | w237 ± 38a | w298 ± 36b | x501 ± 48c | |||
| 8 | wx290 ± 34a | xy722 ± 116b | z1184 ± 131c | |||
| 12 | y527 ± 77a | xy720 ± 104b | y868 ± 116b | |||
| 16 | xy391 ± 46a | y815 ± 65b | z1153 ± 92c | |||
| 20 | w243 ± 49a | x595 ± 51b | yz893 ± 90c | |||
| ΔLH | 24 | w256 ± 42a | x562 ± 54b | yz940 ± 129c | ||
| 2 | wx1.54 ± 0.57a | w2.67 ± 0.30b | w4.95 ± 0.64c | |||
| 4 | w0.67 ± 0.18a | w3.67 ± 0.93b | x8.50 ± 1.02c | |||
| 8 | w0.90 ± 0.21a | x9.72 ± 1.59b | z21.85 ± 3.15c | |||
| 12 | y2.52 ± 0.79a | x7.92 ± 1.40b | xy11.37 ± 2.48b | |||
| 16 | xy1.72 ± 0.48a | y11.64 ± 1.38b | z18.43 ± 2.09c | |||
| 20 | wx1.21 ± 0.22a | x7.11 ± 0.78b | y11.96 ± 1.26c | |||
| 24 | wx1.55 ± 0.37a | x7.34 ± 0.90b | y12.76 ± 1.77c | |||
abc Means without a common superscript within variable and age are different (P<0.05).
wxyz Means without a common superscript within variable and dose are different (P<0.05).
Table 6 Effects of genotype and GnRH dose on peak height (ng•ml-1), area under the curve of response (AUC; ng•ml-1•3h-1) and magnitude of the LH and testosterone (T) responses (Δ; ng•ml-1), after administration of GnRH (Means ± SE)
| Genotype | GnRH dose (ng•kg-1 BW) | |||||||||
| Hormone | Variable | Blackbelly | Crossbred | Pelibuey | 3 | 9 | 27 | |||
| LH | Peak height | 6.9±0.5a | 7.7±0.7a | 11±0.9b | x3±0.2 | y8.8±0.5 | z14.1±0.9 | |||
| AUC | 489±32a | 501±35a | 689±48b | x315±2 | y555±33 | z826±46 | ||||
| T | ΔLH | 5.1±0.5a | 6.3±0.7a | 9.4±0.9b | x1.5±0.2 | y7.0±0.5 | z12.4±0.9 | |||
| Peak height | 3.1±0.4a | 3.6±0.3b | 3.4±0.4ab | y2.3±0.3 | z3.7±0.4 | z3.8±0.4 | ||||
| AUC | 232±28a | 282±29b | 283±36b | x136±16 | y288±29 | z372±39 | ||||
| ΔT | 1.5±0.2a | 2±0.3b | 1.9±0.3ab | y0.91±0.22 | z2.11±0.26 | z2.36±0.28 | ||||
ab Means without a common superscript within hormone and variable are different (P<0.05).
xyz Means without a common superscript within hormone and variable are different (P<0.05).

Figure 1 Effect of age on peak height (panel A), area under the curve of response (panel B) and magnitude of the response (panel C) of LH and testosterone, after administration of GnRH
Testosterone secretion after GnRH administration. The triple interaction of genotype by age by dose, as well as the interactions of genotype by age and genotype by dose were not significant for any of the variables of T response (Table 2). Dose by age interaction was significant for the three variables of T response (Table 2). No differences among doses (Table 7) were detected for peak height (2 and 4 wk) and ΔT (2 wk); AUC was greater for the large dose, as compared with the small dose (2 wk); AUC and ΔT were greater in the large dose, as compared with the other doses. From wk 8 onwards, T response to the small dose was lower than T response to the medium and large doses, with no difference between the last for all variables, except for AUC at wk 24, when the response to all doses was different from each other.
Table 7 Dose by age interaction on peak height (ng•ml-1), area under the curve of response (AUC; ng•ml-1•3h-1) and magnitude of the testosterone response (ΔT; ng•ml-1), after administration of GnRH (Means ± SE)
| Age | Doses of GnRH | |||
| Variable | (weeks) | 3 ng•kg-1 BW | 9 ng•kg-1 BW | 27 ng•kg-1 BW |
| Peak height | 2 | v0.46 ± 0.21a | v0.43 ± 0.10a | v0.55 ± 0.15a |
| 4 | v0.43 ± 0.19a | v0.59 ± 0.17a | v0.95 ± 0.14a | |
| 8 | v0.75 ± 0.24a | w1.33 ± 0.13b | w1.80 ± 0.19b | |
| 12 | v1.00 ± 0.17a | w2.08 ± 0.40b | w2.11 ± 0.28b | |
| 16 | w1.92 ± 0.45a | x4.44 ± 0.42b | x4.45 ± 0.35b | |
| 20 | x2.73 ± 0.51a | y6.19 ± 0.37b | y6.76 ± 0.37b | |
| 24 | y5.72 ± 0.86a | z8.64 ± 0.50b | z9.19 ± 0.40b | |
| AUC | 2 | v20 ± 6a | v24 ± 5ab | v36 ± 12b |
| 4 | v20 ± 5a | v30 ± 9a | w77 ± 12b | |
| 8 | w53 ± 11a | w114 ± 15b | x149 ± 22b | |
| 12 | x105 ± 19a | w194 ± 36b | x215 ± 36b | |
| 16 | y199 ± 36a | x439 ± 45b | y498 ± 47b | |
| 20 | y276 ± 47a | x619 ± 29b | z729 ± 39b | |
| 24 | y260 ± 49a | x556 ± 60b | z845 ± 104c | |
| ΔT | 2 | v0.07 ± 0.06a | v0.26 ± 0.08a | v0.43 ± 0.14a |
| 4 | v0.02 ± 0.02a | v0.28 ± 0.13a | v0.78 ± 0.11b | |
| 8 | w0.30 ± 0.14a | w1.25 ± 0.13b | w1.57 ± 0.19b | |
| 12 | w0.33 ± 0.09a | w1.04 ± 0.30b | w1.21 ± 0.31b | |
| 16 | x0.63 ± 0.24a | x2.38 ± 0.44b | x2.07 ± 0.30b | |
| 20 | y1.11 ± 0.55a | y3.82 ± 0.56b | y4.12 ± 0.70b | |
| 24 | z3.72 ± 1.02a | z5.55 ± 0.78b | z6.16 ± 0.82b |
ab Means without a common superscript within variable and age are different (P<0.05).
vwxyz Means without a common superscript within variable and dose are different (P<0.05).
Within dose, T response increased as the lambs were older (Table 7); however, differences were not always significant. For the small dose, peak height did not change from 2 to 12 wk of age, but then it increased until wk 24; for the medium and large doses, peak height was not different between 2 and 4 wk, but from wk 8 it increased constantly until the end of the study. Regarding AUC, when the small and medium doses were used, there was no difference between 2 and 4 wk, then it increased between wk 8 and 20; the AUC to the large dose increased continuously from 2 to 24 wk. ΔT was no different between 2 and 4 wk, but from wk 8 onwards it increased until wk 24, for all doses.
The effect of genotype on the three variables of T response tended to be significant (Table 2), Blackbelly ram lambs always showed a lower response than crossbred lambs (Table 6), with Pelibuey being intermediate. The effects of GnRH dose and age were significant (Table 2); T response to the small dose was lower than the response to the medium and large doses (P<0.05; Table 6), with no difference between the larger doses (peak height and ΔT); AUC was different among the three doses administered (P<0.05). The response of T increased as the lambs were older for the three variables evaluated (Figure 1).
Body weight and scrotal circumference
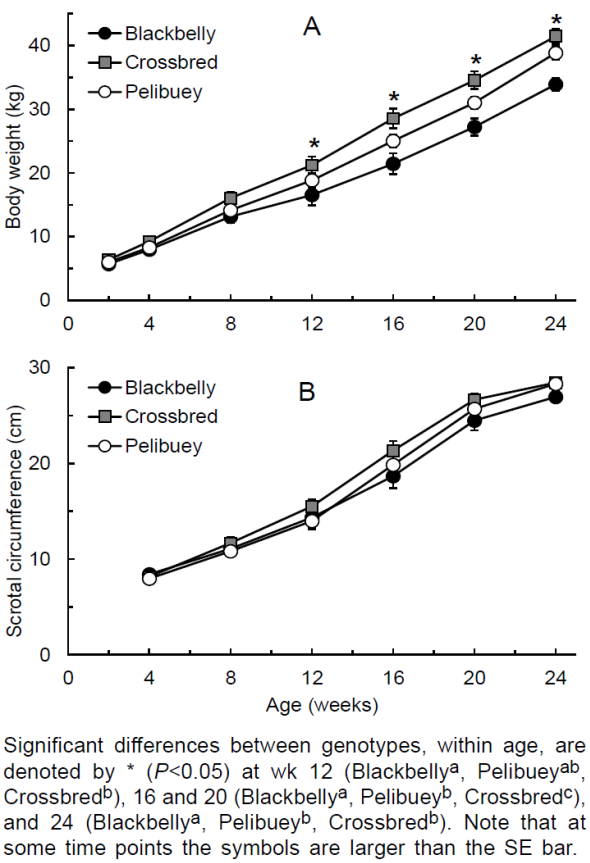
The interaction of genotype by age on BW was significant (P=0.01; Figure 2 A ); from wk 12 onwards, Blackbelly lambs had usually the lightest and crossbred lambs had the heaviest BW (P<0.05). Regarding SC, the effect of the genotype and genotype by age interaction were not significant. The effect of age was significant (P<0.001), and SC augmented as the age increased (Figure 2 B ).
Discussion
Previous studies have found a relationship between the endocrine changes during the pre-pubertal development and some reproductive characteristics in sheep. The age at which LH concentration starts increasing seems to be related with the precocity and prolificacy of the breed, as LH increase is observed earlier in life in more precocious1 and more prolific breeds5,19. Therefore, the lack of differences between genotypes for any of the variables of the LH and T profiles was unexpected, as several authors have reported that Blackbelly is a more precocious and prolific breed, as compared with Pelibuey7,8,10,12. It is possible that differences between sexes in the endocrine mechanisms leading to puberty20 had hidden subtle differences between males of these breeds. Alternatively, as the breeds used in the present study have similar origin6, they are not too different from each other, which accounted for a similar endocrine development.
Mean LH concentration followed a pattern similar to that reported previously for Blackbelly ram lambs14 and for several wool breeds1,2,3,21,22. There were small concentrations during the first weeks of life2,3, reaching maximum concentrations between 11 and 13 wk of age, depending on the breed3,22, followed by a decline or minimal variations thereafter. In the present study, low amplitude pulses were detected as early as 2 wk of age, which agrees with that reported for wool breeds1,21, indicating that a functional, yet immature, reproductive axis exists at very early age. Pulse amplitude at 28 d of age was similar to that previously reported for wool breeds at the same age22. Pulse frequency at 2 wk of age is higher in lambs from the present study, as compared with lambs from wool breeds at one month of age22, in which frequency did not reach values comparable to our lambs until 90 d of age.
An important event during sexual development is an early rise in LH concentration. In our study, a significant increase in mean LH concentration and pulse amplitude was first detected at 4 wk of age, which is in agreement with previous studies in Blackbelly14) and several wool sheep14 y varias razas de lana 1,3,5,19. The early and then sustained increase in LH concentration until wk 12 results from a decrease in the sensitivity of the hypothalamus-hypophysis axis to steroid negative feedback, representing perhaps the beginning of the pubertal process14. The subsequent decline in the LH profile parameters after wk 12 (Study 1) and in the response to GnRH after wk 16 (Study 2), in conjunction with increasing T values, were probably consequence of the establishment of the mechanisms of negative feedback of gonadal steroids2,23.
The progressive increase of T concentration and pulse amplitude is in agreement with previous reports for wool breeds1,4,22; it is initially triggered by the increased frequency and (or) magnitude of LH pulses 4,21,24, and the enhanced testicular steroidogenic activity and responsiveness to LH stimulation2,21,22. Albeit the decreased LH secretion after wk 12, T concentrations continued rising until wk 24; in addition to the greater number of Leydig cells25, there are also increased numbers of LH receptors22,26, enhanced enzymatic activity, and more availability of cholesterol to the interior of the cells26.
At the beginning of the study, the small dose of GnRH (3 ng•kg-1) was considered the “physiological dose”, as previously it had induced LH rises with characteristics similar to the natural LH pulses in adult rams 17. However, after analyzing the data, it was evident that ΔLH for the medium dose (9 ng GnRH•kg-1) was more comparable to the LH pulse amplitude from the study 1 than the small dose was; therefore, the medium dose might be considered closer to physiological GnRH discharges.
Differences among genotypes in the LH response to GnRH were not always evident when challenged with the small dose; however, with the larger doses peak height and ΔLH were greater in Pelibuey lambs, which indicates a greater capacity of response of the hypophysis27 in this breed, primarily on wk 8 and 12. This is in agreement with data from Study 1, where changes in the characteristics of LH profile are evident at those ages, which seem to be important endocrine events associated to the process of puberty. These endocrine changes are temporally associated with the establishment of spermatogenesis14, testis development and the greatest rate of testicular growth(15) in Blackbelly ram lambs. In the present study no observations were made regarding the puberty status; however, based on previous studies under similar conditions14, spermatogenesis starts between 9 and 12 wk of age and is completed (based on the presence of elongated spermatids in most of the seminiferous tubules) by wk 15 to 18, albeit not reached full capacity; furthermore, under similar conditions, sperms were present in the cauda epididymidis at 18 wk of age28.
The age at which Pelibuey lambs reached the greatest LH response to GnRH is in agreement with a previous report for Romney lambs; in such breed, the maximal response to GnRH was observed at 6 wk of age, and the magnitude of the response decreased as the lambs became older29. The dose by genotype interaction on LH response to GnRH found in the present study is in contrast with a study in lambs of several wool breeds (Finn, Finngalway and High Fertility). In the last, lambs were administered between 5 and 100 µg GnRH at 4 and 8 wk of age, and the breed by dose interaction was no significant at any age30. A possible explanation to this disagreement is that the doses used with the wool lambs were so high that the response elicited was maximal at any dose; in contrast, the maximum dose administered to our lambs was close to 1 µg at the end of the study, which could have allowed for some degree of discrimination in the magnitude of the GnRH stimulus.
Findings in T secretion after GnRH administration support the results of the first study, in which the interactions of genotype by dose and genotype by age were not significant for any of the variables evaluated. Even though the differences between genotypes in the LH response to GnRH, they did not suffice to induce clear differences between genotypes in the testicular response, in terms of T secretion. The effect of GnRH dose on LH secretion was significant and the response was always in a dose-dependent manner, which agrees with previous similar studies30,31. Testosterone response was also dose-dependent, which suggests that in developing lambs the testes are able to detect the different LH concentrations induced by GnRH, and release T accordingly. These findings contrast with those previously reported for adult rams; despite the differential LH response to graded doses of GnRH, the magnitude of T response was the same regardless the GnRH dose32. On the other hand, in a study with bulls, AUC of T response was related to GnRH dose33. The biphasic LH response, elicited when high doses of GnRH are administered, accounted for extended testis stimulation, and therefore, greater amounts of T were secreted 33,34.
Even though Pelibuey lambs showed a greater capacity of response to GnRH, such enhanced capacity did not become evident nor had repercussion on the normal physiological process of endocrine maturation (Study 1). It is possible that under physiological conditions the hypothalamus generates only the necessary stimulus to trigger the endocrine changes associated with the onset of puberty and sexual development, and, therefore, the variables of the non-stimulated LH and T profiles did not differ between genotypes27. The differential response to GnRH between genotypes or between individuals, however, might be of some value to predict the reproductive performance of the ram in the adult life or its progeny27,35, but such possibility cannot be verified from data of the present study.
No differences were detected in SC development, albeit the greater BW in Pelibuey and crossbred lambs from wk 12, which disagree with previous studies, where differences in SC in developing ram lambs were explained based on differences in breed BW36. The small number of lambs per group might have accounted for not detecting significant differences among genotypes.
Conclusions and implications
In conclusion, the sexual endocrine development of Blackbelly, Pelibuey and their crosses does not differ when the non-stimulated circulating profiles of LH and T are evaluated; however, Pelibuey lambs showed a greater capacity of LH response, when challenged with physiological and supra physiological doses of GnRH. This differential response was observed during a period in the life, when important changes occur in the development of the testicular function of the rams. Whether or not such differences have implications on the reproductive capacity of the adult rams deserves additional research.
Acknowledgements
Thanks to Leticia García and Patricia Sánchez for technical assistance in the laboratory, Cristina Huerta and Martín Martínez for helping in collecting samples and caring for the lambs. LJ Montiel-Olguín is a former graduate student, whose academic program was supported by CONACYT, under the supervision of the last author (HJS).
REFERENCES
1. Echternkamp SE, Lunstra DD. Relationship between LH and testicular development in progesterone-implanted prepubertal ram lambs. J Anim Sci 1984;59(2):441-453. [ Links ]
2. Rawlings NC, Churchill IJ, Currie WD, Joseph IBJK. Maturational changes in opioidergic control of luteinizing hormone and follicle-stimulating hormone in ram lambs. J Reprod Fertil 1991;93:1-7. [ Links ]
3. Lee VW, Cumming IA, de Kretser DM, Findlay JK, Hudson B, Keogh EJ. Regulation of gonadotrophin secretion in rams from birth to sexual maturity. I. Plasma LH, FSH and testosterone levels. J Reprod Fertil 1976;46:1-6. [ Links ]
4. Klindt J, Ohlson DL, Davis SL, Schanbacher BD. Ontogeny of growth hormone, prolactin, luteinizing hormone, and testosterone secretory patterns in the ram. Biol Reprod 1985;33(2):436-444. [ Links ]
5. Glatzel P. Variation in hormonal feedback and reproductive performance in rams of different genotypes from birth through puberty. Theriogenology 1988;30(4):763-776. [ Links ]
6. Mason IL. Prolific tropical sheep 1980; Paper 17, FAO Rome. [ Links ]
7. González-Reyna A, Valencia MJ, Foote WC, Murphy BD. Hair sheep in México: reproduction in the Pelibuey sheep. Anim Breed Abstr 1991;59:509-524. [ Links ]
8. Segura JC, Sarmiento L, Rojas O. Productivity of Pelibuey and Blackbelly ewes in Mexico under extensive management. Small Ruminant Res1996;21(1);57-62. [ Links ]
9. Young LD, Fahmy MH, Torres HG. The use of prolific sheep: North America. In: MH Fahmy editor. Prolific Sheep. CAB International, Wallingford United Kingdom; 1996:289- 349. [ Links ]
10. Valencia-Zarazúa M, González-Padilla E. Pelibuey sheep in Mexico. In: Fitzhugh HA, Bradford GE editors. Hair sheep of Western Africa and the Americas. A genetic resource for the tropics 1st ed. Boulder CO: Westview Press; 1983:55-73. [ Links ]
11. Heredia AM, Velázquez MPA, Zarco QLA. Efecto de genotipo sobre el peso y edad a la pubertad en corderas Pelibuey, Blackbelly y sus cruzas [resumen]. Reunión Nacional de Investigación Pecuaria. Cuernavaca, Mor. México. 1996;322. [ Links ]
12. Wildeus S. Hair sheep genetic resources and their contribution to diversified small ruminant production in the United States. J Anim Sci 1997;75:630-640. [ Links ]
13. Zavala-Elizarraraz R, Ortiz-Ortiz JR, Ramón-Ugalde JP, Montalvo-Morales P, Sierra-Vásquez A, Sanginés-García JR. Pubertad en hembras de cinco razas ovinas de pelo en condiciones de trópico seco. Zoot Trop 2008;26(4):465-473. [ Links ]
14. Herrera-Alarcón J, Villagómez-Amezcua E, González-Padilla E, Jiménez-Severiano H. Stereological study of postnatal testicular development in Blackbelly sheep. Theriogenology 2007;68(4):582-591. [ Links ]
15. Jiménez-Severiano H, Reynoso ML, Roman-Ponce SI, Robledo VM. Evaluation of mathematical models to describe testicular growth in Blackbelly ram lambs. Theriogenology 2010;74(7):1107-1114. [ Links ]
16. Merriam GR, Wachter KW. Algorithms for the study of episodic hormone secretion. American J Physiol 1982;243(4):E310-E318. [ Links ]
17. Jiménez-Severiano H. Endocrine and testicular responses of male cattle and sheep to chronic treatment with analogs of GnRH [unpublished PhD dissertation]. University of Nebraska; Lincoln 2001. [ Links ]
18. Jiménez-Severiano H, Jiménez-Krassel F, Menéndez-Trejo M. Endocrine and testicular responses of prepubertal Zebu crossbred bulls to active immunization against testosterone. Anim Reprod Sci 1996;41(3-4):169-81. [ Links ]
19. Lunstra DD, Echternkamp SE. Repetitive testicular biopsy in the ram during pubertal development. Theriogenology1988;29(4):803-810. [ Links ]
20. Foster DL, Jackson LM. Puberty in sheep. In: Neill JD editor. Knobil and Neill’s Physiology of Reproduction. Third ed vol.1. San Diego CA; Elsevier Academic Press; 2006:2127-2176. [ Links ]
21. Foster DL, Mickelson IH, Ryan KD, Coon GA, Drongowski RA, Holt JA. Ontogeny of pulsatile luteinizing hormone and testosterone secretion in male lambs. Endocrinology 1977;102(4):1137-1146. [ Links ]
22. Yarney TA, Sanford LM. Pubertal changes in the secretion of gonadotropic hormones, testicular gonadotropic receptors and testicular function in the ram. Domest Anim Endocrinol 1989;6(3):219-229. [ Links ]
23. Schanbacher BD. Testosterone regulation of luteinizing hormone and follicle stimulating hormone secretion in young lambs. J Anim Sci 1980;51(3):679-684. [ Links ]
24. Chase DJ, Schanbacher BD, Lunstra DD. Effects of pulsatile and continuous luteinizing hormone (LH) infusions on testosterone responses to LH in rams actively immunized against gonadotropin-releasing hormone. Endocrinology 1988;123(2):816-826. [ Links ]
25. Monet-Kuntz C, Hochereau-de Reviers MT, Terqui M. Variations in testicular androgen receptors and histology of the lamb testis from birth to puberty. J Reprod Fertil 1984;70:203-210. [ Links ]
26. O’Shaughnessy PJ, Willerton L, Baker PJ. Changes in Leydig cell gene expression during development in the mouse. Biol Reprod 2002;66(4):966-975. [ Links ]
27. Evans NP, McNeilly JR, Springbett AJ, Webb R. Alterations in pituitary gland sensitivity in ram lambs to physiological doses of gonadotrophin-releasing hormone (GnRH), after divergent selection based on the luteinizing hormone response to a pharmacological GnRH challenge. J Reprod Fertil 1991;93:559-567. [ Links ]
28. Vargas-Velázquez AD, Jiménez-Severiano H. Estudio morfométrico de los epidídimos durante el desarrollo postnatal de corderos Barbados Blackbelly. Rev Mex Cienc Pecu 2016;7(1):53-68. [ Links ]
29. Wilson PR, Lapwood KR. Studies of reproductive development in Romney rams. I. Basal levels and plasma profiles of LH, testosterone and prolactin. Biol Reprod 1979;20(4):965-970. [ Links ]
30. Hanrahan JP, Quirke JF, Gosling JP. Effect of lamb age, breed and sex on plasma LH after administration of GnRH. J Anim Sci 1981;61:281- 288. [ Links ]
31. Tyrrell RN, Starr BG, Restall BJ, Donnelly JB. Repeatability of LH responses by lambs to monthly challenge with synthetic gonadotrophin releasing hormone (GnRH). Anim Reprod Sci 1980;3(2):155-160. [ Links ]
32. Jiménez-Severiano H, D’Occhio MJ, Lunstra DD, Mussard ML, Davis TL, Enright WJ, Kinder JE. Comparative response of rams and bulls to long-term treatment with gonadotropin-releasing hormone analogs. Anim Reprod Sci 2007;98(3-4):204-224. [ Links ]
33. Post TB, Reich MM, Bindon BM. Characterization of LH and testosterone responses to intramuscular injection of GnRH in tropical post pubertal bulls. Theriogenology 1987;27(2):305-315. [ Links ]
34. Evans NP, McNeilly JR, Webb R. Effects of indirect selection for pituitary responsiveness to gonadotropin- releasing hormone on the storage and release of luteinizing hormone and follicle-stimulating hormone in prepubertal male lambs. Biol Reprod 1995;53(2):237-243. [ Links ]
35. Haley CS, Lee GJ, Fordyce M, Baxter G, Land RB, Webb R. Study of LH response to GnRH in the young male as a criterion of genetic merit for female reproduction in sheep. J Reprod Fert 1989;86:119- 133. [ Links ]
36. Notter DR, Lucas JR, McClaugherty FS, Copenhaver JS. Breed group differences in testicular growth patterns in spring-born ram lambs. J Anim Sci 1985;60(3):622-631. [ Links ]
Received: April 20, 2015; Accepted: July 20, 2015
 Este es un artículo publicado en acceso abierto bajo una licencia Creative Commons
