


Servicios Personalizados
Revista
Articulo
 texto en
  Inglés (pdf)
 Artículo en XML
 Referencias del artículo
 Enviar artículo por email
Indicadores
-
 Citado por SciELO
 -
 Accesos
Links relacionados
-
 Similares en
SciELO
Similares en
SciELO
Compartir

 Permalink
Revista mexicana de ciencias agrícolas
versión impresa ISSN 2007-0934
Rev. Mex. Cienc. Agríc vol.14 no.8 Texcoco nov./dic. 2023 Epub 09-Feb-2024
https://doi.org/10.29312/remexca.v14i8.3378
Articles
Fertilization analysis in the corn agroecosystem in the Papaloapan basin
1Campus Veracruz-Colegio de Postgraduados. Carretera Xalapa-Veracruz km 88.5, Tepetates, Manlio Fabio Altamirano, Veracruz, México. CP. 91690. Tel. 229 2010770, ext. 6430. (lopez.roberto@colpos.mx; gustavolr@colpos.mx; lango.veronica@colpos.mx).
2Instituto Nacional de Investigaciones Forestales, Agrícolas y Pecuarias. Carretera Toluca-Zitácuaro km 4.5. Vialidad Adolfo López Mateos, Col. Los Ángeles, Zinacantepec, Estado de México. CP. 51350.
Corn is the main crop of the basic basket in Mexico and one of the products of greatest commercial and economic importance nationwide. Among the main factors of agronomic management that determine its level of productivity is fertilization. Currently, as a result of the armed conflicts between Russia and Ukraine, there is a shortage and, consequently, a rise in the price of fertilizers. Therefore, this work studied the fertilization factor in the Papaloapan basin to analyze the effect of chemical nutrition on the corn crop based on its productivity in t ha-1 of grain. Three fertilization scenarios were simulated with the use of the SWAT model, and the results of the factors were mapped by statistically analyzing the difference in means of the treatments through an Anova, which yielded a value of P= 2e-16, showing a significant difference in the effects of the factors analyzed on the yield of the crop. In conclusion, the fertilization factor was higher than the non-fertilization factor, with a difference between means of 7.8 t ha-1 of grain, which indicates that the absence of fertilization work of the crop negatively impacts the productivity of corn grain. Nonetheless, the efficiency between half and full doses of nitrogen fertilization in terms of yield was found to be similar, with the half-dose factor being more efficient than the previous one.
Keywords: corn grain; fertilization; study; SWAT
El maíz es el principal cultivo de la canasta básica en México, así como uno de los productos de mayor importancia comercial y económica a nivel nacional. Dentro de los principales factores del manejo agronómico que determinan su nivel de productividad se encuentra la fertilización. Actualmente derivado de los conflictos bélicos entre Rusia y Ucrania, existe un desabasto y por ende una elevación del precio de los fertilizantes. Por lo anterior, en este trabajo se analizó el factor de fertilización en la cuenca del Papaloapan para analizar el efecto que ejerce la nutrición química en el cultivo de maíz en función de su productividad en t ha-1 de grano. Se simularon tres escenarios de fertilización con el uso del modelo SWAT y se mapearon los resultados de los factores analizando estadísticamente la diferencia de medias de los tratamientos por medio de una Anova la cual arrojó un valor de P= 2e-16 mostrando diferencia significativa en los efectos de los factores analizados sobre el rendimiento del cultivo. En conclusión, el factor de fertilización fue superior al de no fertilización con una diferencia entre medias de 7.8 t ha-1 de grano, lo cual indica que la ausencia de la labor de fertilización del cultivo impacta negativamente sobre la productividad de grano de maíz. Sin embargo, se encontró que la eficiencia entre media dosis y dosis completa de fertilización nitrogenada en términos de rendimiento es similar, siendo el factor de media dosis más eficiente que el anterior.
Palabras clave: estudio; fertilización; grano de maíz; SWAT
Introduction
According to SIAP (2022), corn production in Mexico has increased since 2006, reaching 27.5 million tonnes between 2020 and 2021. This crop represents more than 60% of the calories of the poorest sectors of the population (Bourges, 2013). Although Mexico is one of the largest producers (ASERCA, 2018), it also imports 34.12% of the corn it consumes, the second highest in the ranking of importers (FIRA, 2016).
Corn is Mexico’s staple food, and its production is vital to the nation’s food security (Ureta et al., 2020). Mexico is also one of the largest reservoirs of corn genetic diversity, hosting approximately 50% of the known genetic diversity in the Americas (Vigouroux et al., 2008). Any imbalance in the development and production of corn agroecosystems could put this genetic diversity at risk.
One of the relevant factors in the agronomic management of the corn crop is fertilization. Soil fertilization with nitrogen (N) is a priority for profitable crop production, followed by the use of phosphorus (P) and potassium (K). A balanced dose of NPK greatly influences crop growth and yield (Garbanzo et al., 2021).
According to CEPAL (2022), transnational armed conflicts, such as the current one between Ukraine and Russia, are affecting the world economy and trade, including Latin America. Among the repercussions on input trade, fertilizers are one of the most affected products, as Mexico and other Latin American nations import 88% of agricultural fertilizers from Russia.
Although nitrogen fertilizer prices are already declining, they still remain at historically high levels, and their use is expected to decrease in the field due to issues of affordability and availability, which would negatively affect grain production at the national level and food security (CEPAL, 2022). In Mexico, according to Bada-Carbajal et al. (2021), the Papaloapan basin is one of the main corn-growing regions, with municipalities such as San Andrés Tuxtla or José Azueta with high grain yields per hectare, and a negative impact on the crop fertilization process would greatly affect certain socioeconomic areas of the basin. Therefore, this work studied the fertilization factor in the Papaloapan basin to analyze the effect of chemical nutrition on the corn crop based on its productivity in t ha-1 of grain.
Materials and methods
Study area
The Papaloapan basin is located on the southern slope of the Gulf of Mexico (Figure 1). It covers territories of the states of Puebla, Oaxaca, and Veracruz, with an area of 46 263 km2, represents 2.36% of the national territory and is the second most important region in the country for its volume of runoff, estimated at 46 billion m3 per year (Murillo and López, 2005).

Analysis of fertilizer use in the corn crop
The SWAT (Soil and Water Assessment Tool) model (Neitsch et al., 2009) was implemented to calculate the productive potential of corn in the Papaloapan basin. Three scenarios were compared: a) one with recommended fertilization agronomic management (Tinoco, 2019); b) half fertilization dose; and c) lack of fertilization under rainfed conditions. The simulation covered the period 2016-2021 and considered three variables of analysis: optimal fertilization, half dose of fertilization, and no fertilizer applications.
Delimitation of the sub-basins within the Papaloapan basin
SWAT works at the basin and sub-basin levels. The model subdivides the basin into sub-basins based on the topography of the study area (Akhavan et al., 2010; Garg et al., 2011). For the present work, the total area of the Papaloapan basin was taken. The sub-basins were generated using a digital elevation model (DEM) with 90 x 90 pixels acquired from (INEGI). The generation of accumulated flows and the runoff network was formed based on the DEM and a river map. The sub-basins were delimited by selecting all the outlets of the flow network generated by the model. For this process, 168 sub-basins were generated for the total study area.
Generation of hydrological response units (HRUs)
The sub-basins were subdivided into hydrological response units (HRUs) based on soil type, land use, and slope (Akhavan et al., 2010; Garg et al., 2011). The HRUs within the basin were generated using a soil map from INEGI (2015) in vector format (scale 1:250 000). The database used in the study consisted of 4 418 soil profiles classified according to the WRB system (INEGI, 2015). These data provided information on the environmental characteristics, physical and chemical analyses of 14 349 soil horizons, as well as morphological details and limitations for land use and management (Paz-Pellat, 2018).
From the soil vector layer and its attribute table, 340 soil types were unified according to the WRB classification for the study area, considering the first subdivision and its horizons. To assess land use, a mask was created in raster format, which simulated the potential yield of the corn crop over the entire surface, assuming that the area of the basin was allocated to agricultural use in this study.
For the generation of the slope ranges, five categories were generated (0-3, 3-8, 8-15, 15-30, and >30%) based on the digital elevation model. At the end of the process, the model generated 4 852 HRUs. Table 1 shows, by way of example, the typical profile of the skeletic-mazic-Vertisol (skmzVR) soil with the parameters required by the model, as well as the source of their obtaining.
Table 1 Characteristics of the typical skeletic-mazic-Vertisol soil profile.
| Horizon | Dep (mm) | Text (%) | BD (g cm-3) | AM (mm mm-1) | OC (%) | SHC (mm hr-1) | RC (%) | Alb | USLE K | EC (dS m-1) |
|---|---|---|---|---|---|---|---|---|---|---|
| A | 130 | 14-14-72 | 1.48 | 0.15 | 1.5 | 0.08 | 0 | 0.21 | 0.5 | 2 |
| B1 | 440 | 32-14-54 | 1.56 | 0.15 | 0.3 | 0.1 | 0 | 0.21 | 0.25 | 2 |
| B2 | 830 | 36-14-50 | 1.54 | 0.15 | 0.2 | 0.11 | 0 | 0.21 | 0.25 | 2 |
Dep= depth (INEGI, 2015); Text= texture in the following order: clay, silt, sand (INEGI, 2015); BD= bulk density (Saxton et al., 1986); AM= available moisture (Saxton et al., 1986), OC= organic carbon (Neitsch et al., 2009); SHC= saturated hydraulic conductivity (Saxton et al., 1986); RC= rock content (INEGI, 2015); Alb= dimensionless albedo (Harris equation, CurveExpert 2.0 software); USLE K= factor ‘K’ of the universal soil loss equation (Neitsch et al., 2009); EC= electrical conductivity (INEGI, 2015).
Climate generation and allocation
Historical data from 1 074 weather stations of the National Meteorological Service (SMN, for its acronym in Spanish) located in the humid tropics were used. These data cover at least 100 years of records of precipitation and maximum and minimum temperature in the period 1912-2020. Using the EPIC climate generator (Sharpley and Williams, 1990), the climate statistics required by the model and daily temperature and precipitation data were generated for the entire period from 1950 to 2020.
The climatic variables considered are the following: a) maximum temperature; b) minimum temperature; c) standard deviation of the maximum temperature; d) standard deviation of the minimum temperature; e) average monthly rainfall, f) standard deviation of average monthly rainfall; g) asymmetry coefficient of average monthly rainfall; h) probability of a wet day after a dry day; i) probability of a wet day after a wet day; j) average number of days with rainfall per month; k) maximum rainfall in half an hour; and l) solar radiation. For the total area of the Papaloapan basin, the model selected 128 weather stations based on the proximity to the centroid of the sub-basins generated.
Entering physiological parameters and management
To calculate the productive potential of crops, the model requires the physiological parameters of the species to be simulated. SWAT contains a database with physiological parameters of various crops, within which, according to Neitsch et al. (2011), those corresponding to the corn crop were entered. Table 2 shows, by way of example, the physiological parameters entered into the model.
Table 2 Physiological parameters of corn enter into SWAT.
| Specie | RUE (kg ha-1/Mj m-2) | 2a point RUE | LAI | HI | Canopy height (m) | Root depth (m) | Optimal temperature (°C) | Base temperature (°C) |
|---|---|---|---|---|---|---|---|---|
| Corn | 39 | 45 | 6 | 0.5 | 2.5 | 2 | 25 | 8 |
RUE= radiation-use efficiency; LAI= leaf area index; HI= harvest index.
To calculate crop yield, management was entered into the model, including sowing and harvest dates, fertilization doses, and cultural tasks (Table 3).
Table 3 Optimal management of the corn crop entered into the model under rainfed conditions.
| Activity | Year | Task | Input or activity | Date |
|---|---|---|---|---|
| Soil preparation | 1 | Chapeo (cutting with a machete) | Blade | May 14 |
| 1 | Subsoiling | Disk Plow | May 24 | |
| 1 | Harrowing | Finishing Harrow | May 29 | |
| 1 | Harrowing | Finishing Harrow | May 30 | |
| 1 | Furrowing | Furrow Diker | May 31 | |
| Crop establishment | 1 | Sowing | Corn | June 1 |
| Fertilization | 1 | 1a Fertilization | 60-00-00 NPK (kg ha-1) | June 1 |
| 1 | 2a Fertilization | 00-60-00 NPK (kg ha-1) | June 1 | |
| 1 | 3a Fertilization | 60-00-60 NPK (kg ha-1) | June 27 | |
| Harvest | 1 | Harvest | Harvest and kill operation | September 28 |
NPK= nitrogen, phosphorus, potassium (Tinoco, 2019).
Analysis of results
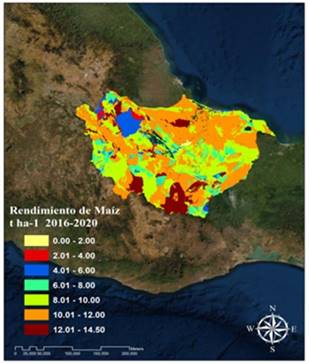
Using geographic information systems, the potential yield of corn in the basin was mapped for three scenarios: complete fertilization, half dose of fertilization, and no fertilization. Statistical analysis of the difference in means in R® (R Core Team, 2021) was used with Fischer’s Anova method (Cayuela, 2010) to assess the significance and accept or reject the null hypothesis of equal corn yield in the three simulated scenarios.
Results and discussion
By means of a box plot, Figure 2 shows the difference in means between the factors analyzed for the simulated yield of the corn crop in the Papaloapan basin. Fischer’s method of analysis of variance (Anova) (Cayuela, 2010) was used to find the significance value and determine if there was a significant difference between the factors analyzed. The P-value obtained was 2e-16, which indicates that the null hypothesis is rejected, and it is demonstrated that there is a large significant difference between the factors analyzed based on the simulated yield of the corn crop in the Papaloapan basin.

Table 4 presents the basic comparative statistics of the simulated scenarios (with fertilization, half dose of fertilization, and without fertilization) where the significant differences of the three factors analyzed are observed.
Table 4 Basic statistics of analysis of the effect of fertilization on the corn crop in the Papaloapan basin.
| Factor | Mean (t ha-1) | Minimum (t ha-1) | Maximum (t ha-1) |
|---|---|---|---|
| With fertilization | 9.4 | 0.04 | 14.37 |
| Half dose of fertilization | 6.75 | 0.05 | 10.7 |
| No fertilization | 1.6 | 0.05 | 5.2 |
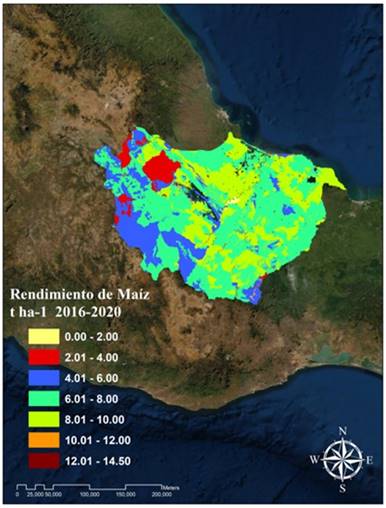
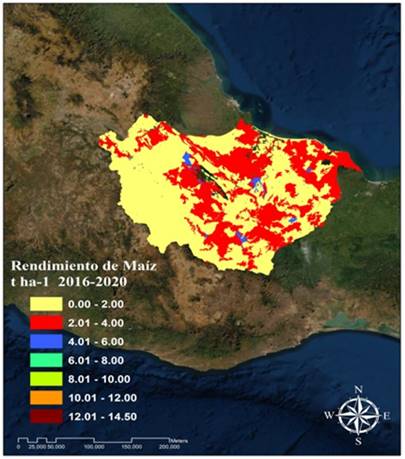
The spatially explicit distribution of the effects of the factors analyzed on the corn crop in the basin are shown in Figure 3, of the corn crop with fertilization (Figure 4), corn crop under the effect of half dose of fertilization, and Figure 5 corn crop without fertilizer application.
Using Pearson’s correlation method (Lalinde et al., 2018), data measured in the field were validated based on those obtained through the simulation process. The analyzed values are shown in Table 5.
Table 5 Correlation analysis of data measured in the field based on data simulated by the model.
| Locality | HRU | Simulated yield (t ha-1) | Measured yield (t ha-1) |
|---|---|---|---|
| +Ignacio de la Llave | 1 219 | 8 | 6.65 |
| +San Andres Tuxtla | 2 457 | 7.96 | 6.69 |
| *Loma Bonita | 3 702 | 6.79 | 5.99 |
| +Tlalixcoyan | 1 730 | 6.01 | 5.18 |
| +Cotaxtla | 1 285 | 8.5 | 7.74 |
| +Mata de Agua | 2 175 | 7.28 | 5.82 |
| +Rodriguez Clara | 3 819 | 4.05 | 3.3 |
| +Sampedro Quilitongo | 6 140 | 4.01 | 1.28 |
| *San Juan Bautista Coixtlahuaca | 6 153 | 4.02 | 1.48 |
| *Tepelmeme de Morelos | 4 310 | 4.01 | 1.27 |
Figure 6 shows the behavior of the correlation analysis of data taken in the field compared to the values obtained through the simulation process. The R2 value obtained shows a high correlation and, therefore, demonstrates that the SWAT model (Neitsch et al., 2009) simulates with remarkable precision the behavior of the corn crop in the Papaloapan basin.

Based on the results obtained, it can be seen that the application of fertilizer in the corn crop of the Papaloapan basin is crucial for grain production; in turn, it was observed that the difference between a half dose of nitrogen (60 kg ha-1) and an optimal dose (120 kg ha-1) is only 3.67 t ha-1. Based on this, the efficiency of nitrogen use in both scenarios was analyzed. The efficiency in the use of nitrogen was calculated according to (Dobermann, 2005), with the following formula: PFPN = YN/FN. Where: PFPN= nitrogen-use efficiency; YN= crop yield under the application of N (t ha-1); FN= amount of N applied (kg ha-1). The nitrogen-use efficiency of the scenario with a half dose of fertilization was found to be higher than that of the full dose. Table 6 shows the results obtained in proportion to the statistical value of the mean and maximum value of the effects evaluated.
Table 6 Nitrogen-use efficiency under the application of half and optimal doses of nitrogen in the Papaloapan basin.
| Factor FN | Mean YN | Maximum YN | Value of PFPN |
|---|---|---|---|
| Optimal fertilization (120 kg N ha-1) | 9.4 t ha-1 of corn | 14.37 t ha-1 of corn | PFPN (mean)= 0.08 PFPN (maximum)= 0.12 |
| Half dose of fertilization (60 kg N ha-1) | 6.75 t ha-1 of corn | 10.7 t ha-1 of corn | PFPN (mean)= 0.11 PFPN (maximum)= 0.18 |
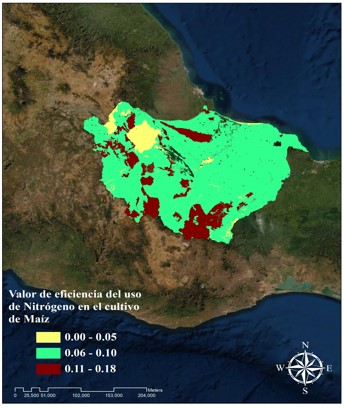
The optimal dose of fertilizer for the corn crop in the Papaloapan basin turns out to be excessive, as indicated by Capetillo et al. (2021). Applying half the dose of nitrogen fertilizer is sufficient to obtain yields greater than 10.7 t ha-1, as shown in Figures 7 and 8. This practice not only has implications for the benefit-cost ratio but also contributes to the sustainability of the agroecosystem by avoiding degradative processes associated with the inefficient use of nitrogen fertilizers, as mentioned by Saynes-Santillán et al. (2019).
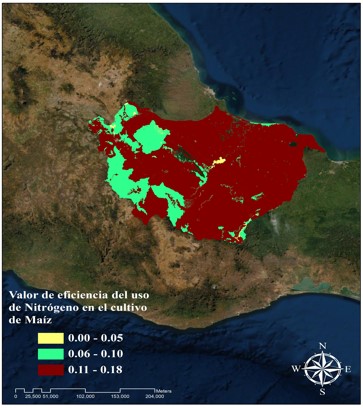
Figure 7 Nitrogen-use efficiency (PFPN) value in the corn crop under an effect of half the fertilization dose.
Conclusions
Fertilization is crucial for corn crops since a significant difference in yield is observed between fertilization and non-fertilization, with an average of 7.8 t ha-1. Nevertheless, waste in the use of nitrogen fertilizers has been found since the yield does not vary so much between the full dose and the reduced dose. This suggests that a moderate application of fertilizer could be sufficient to obtain good yields, above 10.7 t ha-1, and be more sustainable for the corn agroecosystem. Further research is required to improve the use of nitrogen fertilizers through new technologies and agronomic practices.
Bibliografía
Akhavan, S.; Abedi, K. L.; Mousavi, S. F.; Afyuni, M.; Eslamianand, S. S. and Abba, P. K. C. 2010. Applications of SWAT model to investigate nitrate leaching in Hamadan-Bahar Watershed, Iran. Ecosystems and Environment. 139:675-688. https://doi.org/10.1016/j.agee.2010.10.015. [ Links ]
ASERCA. 2018. Agencia de servicios a la comercialización y desarrollo de mercados agropecuarios. Maíz grano cultivo representativo de México. https://www.gob.mx/aserca/articulos/maiz-grano-cultivo-representativo-de-mexico?idiom=es. [ Links ]
Bada-Carbajal, L. M.; Osorio-Antonia, J. y Ramírez-Hernández, Z. 2021. Evolución de la producción del maíz en Veracruz, México. Investigación Administrativa. 50(128):12807. https://doi.org/10.35426/iav50n128.07. [ Links ]
Bourges, H. 2013. El maíz: su importancia en la alimentación de la población mexicana. In: Álvarez-Buylla, E. R.; Piñeyro-Nelson, A. Ed. El maíz en peligro ante los transgénicos: un análisis integral del caso de México. Universidad Nacional Autónoma de México (UNAM)-UCCS, UV. 231-248 pp. https://www.jstor.org/stable/43695257 . [ Links ]
Capetillo, B. A.; López, C. C. J.; Zetina, L. R.; Chávez, R.; Matilde, H. C.; Cadena, Z. M. y López, L. J. A. 2021. Modelo conceptual de fertilización nitrogenada para maíz (Zea mays L.) en Veracruz, Ciudad de México. Rev. Iberoam. Bioecon. Cambio Clim., 7(14) https://doi.org/10.5377/ribcc.v7i14.12606. [ Links ]
Cayuela, L. 2010. Modelos lineales: regresión, Anova y Ancova. Eco Lab. Centro andaluz de medio ambiente. Universidad de Granada. Notas de clase. 1-57 p. https://tauniversity.org/sites/default/files/modelos-lineales-regrsion-anova-y-ancova.pdf. [ Links ]
CEPAL. 2022. Comisión Económica para América Latina y el Caribe. Efectos económicos y financieros en América Latina y el Caribe del conflicto entre la Federación de Rusia y Ucrania. Reflexiones de Alicia Bárcena. Secretaría Ejecutiva de la Comisión Económica para América Latina y el Caribe. Argentina. 10 p. https://repositorio.cepal.org/handle/11362/47831. [ Links ]
Dobermann, A. R. 2005. Nitrogen use efficiency-state of the art. Agronomy, Faculty Publications. 316 p. https://digitalcommons.unl.edu/cgi/viewcontent.cgi?article=1319&context=agronomyfacpub . [ Links ]
FIRA. 2016. Fideicomisos Instituidos en Relación con la Agricultura. Dirección de Investigación y Evaluación Económica y Sectorial. Panorama Agroalimentario. México, DF. https://www.gob.mx/fira/documentos/panorama-agroalimentario. [ Links ]
Garbanzo-León, G.; Alvarado-Hernández, A.; Vargas-Rojas, J. C.; Cabalceta-Aguilar, G and Vega-Villalobos, E. V. 2021. Nitrogen and potassium fertilization in corn in an Alfisol of Guanacaste, Costa Rica. Costa Rica. Agronomía Mesoamericana. 32(1):137-148. Doi:10.15517/am.v32i1.39822. [ Links ]
Garg, K. K.; Bharati, L.; Gaur, A.; George, B.; Acharya, S.; Jella, K. and Narasimhan, B. 2011. Spatial mapping of agricultural water productivity using the SWAT model in Upper Bhima Catchment, India. Irrigation and Drainage. 61: 60-79https://doi.org/10.1002/ird.618. [ Links ]
INEGI. 2015. Instituto Nacional de Geografía y Estadística. Guía para la interpretación de la Cartografía. Edafología WRB escala 1:250 000 serie III. México, DF. 60 p. https://www.inegi.org.mx/contenidos/productos/prod-serv/contenidos/espanol/bvinegi/productos/nueva-estruc/702825076221.pdf. [ Links ]
Lalinde, J. D. H.; Castro, F. E.; Rodríguez, J. E.; Rangel, J. G. C.; Sierra, C. A. T.; Torrado, M. K. A. y Pirela, V. J. B. 2018. Sobre el uso adecuado del coeficiente de correlación de Pearson: definición, propiedades y suposiciones. Archivos Venezolanos de Farmacología y Terapéutica. 37(5):587-595. [ Links ]
Murillo, L. M. y López, R. E. 2005. Organización social y producción en la cuenca del Río Papaloapan. In: Vargas, S. y Mollard, E. Ed. Problemas socioambientales y experiencias organizativas en las cuencas de México. Instituto Mexicano de Tecnología del Agua (IMTA). 245-275. http://187.174.234.55/handle/20.500.12013/2113. [ Links ]
Neitsch, S. L.; Arnold, J. G.; Kiniry, J. R. and Williams, J. R. 2011. Soil and water assessment Tool. Theoretical documentation version 2009. Backland Research Center. Texas. USA. 618 p. https://oaktrust.library.tamu.edu/bitstream/handle/ 1969.1/128050/TR406-SoilandWaterAssessmenToolTheoreticalDocumentation. pdf?sequence=1. [ Links ]
Neitsch, S. L.; Arnold, J. G.; Kiniry, J. R. and Williams, J. R. 2009. Soil and water Assessment Tool. Theoretical documentation. Backland research center. Texas, USA. 494 p. https://swat.tamu.edu/mdia/99192/swat2009-theory.pdf. [ Links ]
Paz-Pellat, F. 2018. Base de datos de perfiles de suelos en México. Elementos para Políticas Públicas. 2:210-235. https://www.elementospolipub.org/ojs/index.php/ epp/article/view/16. [ Links ]
R Core Team. 2021. R: A language and environment for statistical computing. R Foundation for Statistical Computing. Vienna, Austria. https://www.R-project.org/. [ Links ]
Sánchez-Hernández, M. A.; Jiménez-Maya, J. B.; Morales-Terán, G.; Acevedo-Gómez, R.; Antonio-Estrada, C. y Villanueva-Verduzco, C. 2019. Rendimiento de grano en maíces adaptados a condiciones de la baja cuenca del Papaloapan. Tropical and Subtropical Agroecosystems. 22(1):519-529. [ Links ]
Saxton, K. E.; Rawls, W. J.; Romberger, J. S. and Papendick, R. I. 1986. Estimating generalized soil water characteristics from texture. Trans. ASAE. 50:1031-1035. https://doi.org/10.2136/sssaj1986.03615995005000040039x. [ Links ]
Saynes-Santillán, V.; Turrent-Fernández, A. y Etchevers, J. D. 2019. Agricultura sustentable: el papel de la fertilización inteligente con nitrógeno y fósforo en México. Elementos para Políticas Públicas . 3(3):275-290. https://elementospolipub.org/ojs/index.php/epp/article/view/35. [ Links ]
SIAP. Servicio de Información Agroalimentaria y Pesquera. 2022. Resumen de producción anual de maíz en México. https://nube.siap.gob.mx/cierreagricola/. [ Links ]
Sharpley, A. N. and Williams, J. R. 1990. EPIC-erosion/productivity impact calculator. USDA. Agricultural research service. Technical Bulletin No. 1768. Washington, DC. EUA. 235 pp. https://agris.fao.org/agris-search/search.do?recordID=US9551549. [ Links ]
Sierra, M. M.; Palafox, C. A.; Rodríguez, M. F.; Espinosa, C. A.; Gómez, M. N.; Caballero, H. F. y Vázquez, C. G. 2008. H-520, híbrido trilineal de maíz para el trópico húmedo de México. Agricultura Técnica en México. 34(1):119-122. https://www.scielo.org.mx/scielo.php?script=sci-arttext&pid=S05682517200800010001. [ Links ]
Tinoco, C. A. 2019. Tecnología de producción de maíz de temporal en el sur de Veracruz. Instituto Nacional de Investigaciones Forestales Agrícolas y Pecuarias (INIFAP). Campo Experimental Cotaxtla. 17 p. https://www.gob.mx/cms/uploads/attachment/file/723016/Maiz-temporal-tehuantepec.pdf . [ Links ]
Ureta, C. 2020. Maize yield in Mexico under climate change. Agricultural systems. Elsevier. 177(12):102697-XX pp. Doi: 10.1016/j.agsy.2019.102697. [ Links ]
Vigouroux, Y. 2008. Population structure and genetic diversity of new world maize races assessed by DNA microsatellites. American Journal of Botany. 95(10):1240-1253. Doi: 10.3732/ajb.0800097 . [ Links ]
Received: August 01, 2023; Accepted: October 01, 2023
 Este es un artículo publicado en acceso abierto bajo una licencia Creative Commons
