


Serviços Personalizados
Journal
Artigo
 texto em
  Inglês (pdf)
 Artigo em XML
 Referências do artigo
 Enviar este artigo por email
Indicadores
-
 Citado por SciELO
 -
 Acessos
Links relacionados
-
 Similares em
SciELO
Similares em
SciELO
Compartilhar

 Permalink
Revista mexicana de ciencias agrícolas
versão impressa ISSN 2007-0934
Rev. Mex. Cienc. Agríc vol.14 no.8 Texcoco Nov./Dez. 2023 Epub 09-Fev-2024
https://doi.org/10.29312/remexca.v14i8.3202
Articles
Controlled water deficit and its effect on the yield and quality of three potato varieties
1Campo Experimental Valle del Fuerte-INIFAP. Carretera internacional México-Nogales km 1 609, Juan José Ríos, Sinaloa, México. CP. 81110. (sifuentes.ernesto@inifap.gob.mx).
2Colegio Mexicano de Ingenieros en Irrigación. Vicente Garrido no. 106, Cuernavaca, Morelos, México. CP. 62230.
3Facultad de Agricultura del Valle del Fuerte-Universidad Autónoma de Sinaloa. Calle 16 y Av. Japaraqui, Juan José Ríos, Sinaloa, México. CP. 81110.
4Tecnológico Nacional de México-Instituto Tecnológico de Torreón. Carretera Torreón-San Pedro km 7.5, Ejido Ana, Torreón, Coahuila, México. CP. 27170. (ppreciador@yahoo.com.mx).
The quantity and quality of potato tubers are related to irrigation. We studied the effect of three levels of water deficit (L= low, M= medium, and H= high) on the yield and quality of three potato varieties (Fiana, Atlantic, and Ágata), induced by varying the parameter α3 of the maximum allowable deficit (MAD) function of a comprehensive irrigation programming model. The work was carried out in the north of Sinaloa, Mexico (autumn-winter cycle 2015-2016), using a design in divided plots with two factors and four repetitions, where the large plots were the levels of water deficit and the sub-plots were the varieties. There was a significant effect (p= 95%) on yield (Y) as it decreased by 3.65 t ha-1 in H compared to L. In the variety factor, Fiana and Ágata were the best in quantity and quality, with Fiana standing out with fewer noncommercial (NCO) tubers. In the water deficit-variety interaction, Fiana was the best, with more tubers of first and second quality (Q1 and Q2) in L. In M, Ágata was the best in Y but the lowest in Q1 and highest in deformed (DEF) and NCO. In H, the behavior was similar; Ágata was the best but with less Q1 and Q2 and a significant presence of DEF and NCO. A 29.5, 28.8, and 28.4 cm water requirement was estimated in L, M, and H, respectively. The behavior of Fiana suggests managing it under drip irrigation, while Ágata under gravity irrigation and limited water conditions.
Keywords: Solanum tuberosum L.; comprehensive model; growing degree-days (GDD); water use efficiency.
La cantidad y calidad de tubérculos de papa están relacionados con el riego. Se estudió el efecto de tres niveles de déficit hídrico (B= bajo, M= medio y A= alto) en el rendimiento y calidad de tres variedades de papa (Fiana, Atlantic y Ágata), inducido al variar el parámetro α3 de la función máximo déficit permitido (MDP) de un modelo de programación integral del riego. El trabajo se realizó en el norte de Sinaloa, México (ciclo otoño-invierno 2015-2016), utilizando un diseño en parcelas divididas con dos factores y cuatro repeticiones, donde las parcelas grandes fueron los niveles de déficit hídrico y las sub-parcelas las variedades. Se tuvo efecto significativo (p= 95%) en rendimiento (Y) al reducirse 3.65 t ha-1 en A con respecto a B. En el factor variedades, Fiana y Ágata fueron las mejores en cantidad y calidad, destacando Fiana con menos tubérculos rezaga (REZ). En la interacción déficit hídrico-variedad, Fiana fue la mejor con más tubérculos de primera y segunda calidad (C1 y C2) en B. En M, Ágata fue la mejor en Y, pero la más baja en C1 y más alta en deformes (DEF) y REZ. En A, el comportamiento fue similar, Ágata fue la mejor, pero con menos C1 y C2 y presencia importante de DEF y REZ. Se estimó un requerimiento hídrico de 29.5, 28.8 y 28.4 cm en B, M y A respectivamente. El comportamiento de Fiana sugiere manejarla bajo goteo, mientras que Ágata en riego por gravedad y bajo condiciones limitadas de agua.
Palabras clave: Solanum tuberosum L.; eficiencia en el uso del agua; grados día-desarrollo (GDD); modelo integral.
Introduction
In Mexico, 62 000 ha of potato (Solanum tuberosum L.) are established annually, with a production of 1.7 million tonnes and an average yield of 27 t ha-1 (Onamu et al., 2015; SIAP, 2021); in addition, 8 700 producers participate directly, benefiting 20 000 families, generating more than 17 500 direct jobs and 51 600 indirect jobs (ASERCA, 2018). Sinaloa is the largest potato-producing state in Mexico, establishing annually in the autumn-winter cycle (AW), around 14 000 ha under gravity and sprinkler irrigation, which represented 22% of the national area, with an average yield of 30 t ha-1 (CONAGUA, 2018).
The quality and quantity of tubers are related to good irrigation programming due to the high sensitivity of the crop to water stress (Wagg et al., 2021). Steduto et al. (2012) reported that the crop’s accumulated water demand fluctuates from 350 to 650 mm, depending on sowing date, climate, soil moisture, and variety, with water productivity of 4 to 11 kg m-3. The same authors suggested that in order not to affect the yield, water deficit should be avoided during the stages of stolon formation and tuber development, and the usable moisture (UM) of the soil should not be depleted by more than 30 to 50%.
During two agricultural cycles, Camargo et al. (2015) assessed the response of potato crop yield and water productivity to four irrigation treatments (60, 80, 100, and 120% of the water requirement), finding statistically significant differences in the treatment where 60% was applied in the first year, while in the second, the treatments with high levels of water supply (100 and 120%) were also different compared to those of low supply (60 and 80%). Water productivity fluctuated from 8.6 to 11.6 kg m-3 in the first year and 7.1 to 8.4 kg m-3 in the second.
Regarding quality, Steduto et al. (2012); Da Silva et al. (2019) recommended that to reduce the presence of deformed tubers, the crop should not be stressed during the tuber development phase, heavy irrigation after a period of stress at this stage also generates cracking of tubers and black hearts. Jha et al. (2017) evaluated the effect of water stress induced by the concentration of salts in irrigation water on yield and quality under drip and gravity irrigation, finding a gradual reduction of the variables plant height, number of tubers, and yield as stress increased, mainly under gravity irrigation.
This effect was also observed in tuber quality as starch concentration decreased, and tubers of less weight and size increased with increasing salt concentrations. Poor irrigation programming is also related to the presence of diseases that reduce quality, mainly caused by bacteria and fungi (Rich, 1983).
The use of indicators of the level of soil moisture (θ) is one of the most recommended techniques to schedule irrigation; the moment is defined when the moisture reaches a minimum allowable or critical value (θc), dependent on the factor known as maximum allowable deficit (MAD); in this way, soil moisture fluctuates between field capacity (θfc) and θc (Mahima et al., 2018). Another widely used irrigation programming method is water balance, which is based on making a rigorous balance of water inputs and outputs in the root zone that affect soil moisture dynamics.
In the former are irrigation (I); effective precipitation (EP); capillary rise (CR); and runoff (Ru), while in the latter are crop evapotranspiration (ETc); percolation (P); and runoff or drainage (Ru). Because the ETc depends on environmental conditions, soil moisture, species, and stage of crop development, it is difficult to estimate it using fixed values for the duration of each stage, so it is pertinent to incorporate the concept of Growing Degrees-Days (GDD) in the monitoring of programming variables (Ojeda et al., 2006; Ojeda et al., 2015).
This approach is becoming increasingly important due to the possible intensification of climate variability and change in Mexico’s various agricultural regions. The Secretariat of Environment and Natural Resources (SEMARNAT, for its acronym in Spanish), an agency of the Mexican government, reported that according to records from 1971-2008 in the country, the historical average annual temperature was 20.9 °C and since 1990, most of the average annual temperatures have been higher than this value.
Only in the period 1999-2008 the increase was 0.7 °C (SEMARNAT, 2012). Lobato and Altamirano (2017) reported an increase in the average annual temperature greater than 2 °C for northern Sinaloa, where the present study was carried out, taking as reference the base period 1961-1990. For the programming and scheduling of irrigation under the GDD concept, computer systems have been developed, which are applied on a large scale to better couple the water demands of crops to their phenological development, such as the Irrimodel platform (Sifuentes and Macías, 2015).
Nonetheless, most studies using these irrigation programming tools have focused on reporting the effect of water stress on yield (Erdem et al., 2006), and there is limited information on these effects on tuber quality for currently grown varieties.
Given this demand for knowledge, the objective of the present research work was to evaluate the response of the yield and quality of the tubers of the three potato varieties with the largest sown area in northern Sinaloa (Fiana, Ágata, and Atlantic) to the water deficit controlled through parameter ∝3 of the MAD function of a comprehensive-dynamic model of irrigation programming based on the GDD concept, using the Irrimodel software.
Materials and methods
The study was conducted in the northern part of the state of Sinaloa, Mexico, during the autumn-winter (AW) cycle 2015-2016, in the central part of the DR-075 Río Fuerte at an altitude of 12 m. The region has an average annual temperature of 24 to 26 °C and an average accumulated annual rainfall of 360 mm, concentrated from July to September. The predominant soils are clayey (C) and clayey loam (CL) in texture, poor in organic matter (OM), flat slope, and without problems of soluble salts (INIFAP, 2010).
An experimental lot of 2 500 m2 was established in the Valle del Fuerte Experimental Field (CEVAF, for its acronym in Spanish) of the National Institute of Forestry, Agricultural, and Livestock Research (INIFAP, for its acronym in Spanish), located at coordinates 25° 45’ 49” north latitude and -108° 51’ 41” west longitude. The soil of the lot was clayey, deep, and without salt problems, typical of the region, and there were no significant rains during the growing period of the crop.
The soil water deficit was managed through parameter ∝3, included in the MAD function of the comprehensive irrigation programming model indicated in Table 1, proposed specifically for this crop by Ojeda et al. (2004) and executed automatically through the Irrimodel software (Sifuentes and Macías, 2015).
Table 1 Components of the comprehensive irrigation programming model for the potato crop in northern Sinaloa, Mexico (Ojeda et al., 2004).
| Variable | Function | Parameter |
|---|---|---|
| Crop coefficient (Kc) |
|
Kmax= 1.3 |
| XKmax= 0.6 | ||
| α1 = 0.45 | ||
| Kco= 0.2 | ||
| Root depth (RD) |
|
RDo = 0.15 m |
| RDmax= 0.7 m | ||
| α 2= 600 | ||
| Maximum allowable moisture deficit (MAD) |
|
α 3 = 0.15-0.7 |
| α 4 = 0.1 |
Kco= represents the crop coefficient for the first phenological stage of the crop, which depends essentially on soil evaporation; Kmax= is the maximum value of Kc during its development; XKmax= corresponds to an auxiliary variable defined by the accumulated growing degree-days (AGDDs) when the crop reached its maximum; Kc, ∝1= is a regression parameter obtained by adjusting experimental data from the study area; erfc= is the complementary function of the error; and x= is an auxiliary variable calculated with equation (1):
.
Where: AGDD= is the accumulated value of GDD from sowing to the calculation date, and ∝0= is the AGDDs required until the end of the phenological cycle. RDo and RDmax represent the sowing depth and maximum root depth, respectively; the ∝2 value was empirically adjusted from an approximate value to 2/3 of the AGDD value where the potato reaches the maximum root depth.
Three water deficit conditions were generated, using three values for parameter ∝3, which vary according to the irrigation system, as reported by Ojeda et al. (2004): 0.15 for low water deficit (L), 0.3 for medium deficit (M) and 0.45 for high deficit (H), in three commercial varieties currently grown in the study area: Atlantic (V1); Ágata (V2); and Fiana (V3).
The ∝4 value was assumed to be 0.1, suggested for potato crops (Ojeda et al., 2004). The experimental design used was in divided plots (Soltero-Díaz et al., 2010; Badii et al., 2007), with the applied level of moisture or water deficit being the large plot and the three varieties distributed randomly being the sub-plots, generating 36 experimental plots formed of four beds 0.9 m wide by 15 m long (54 m2).
The sowing was carried out dry on October 24, 2015, manually, depositing 4 to 5 seed tubers in the center of each bed at a depth of 0.2 m to have a sowing density of 45 000 seeds ha-1. After sowing, gravity germination irrigation was applied to bring soil moisture to θfc in the upper meter of the profile. Fertilization, crop management, and phytosanitary control were carried out according to the technological package recommended for the area (INIFAP, 2010).
The programming of the irrigations in each treatment, in terms of timeliness (interval) and quantity (sheet), was carried out using the water balance method through the Irrimodel Software (Sifuentes and Macías, 2015), which uses the comprehensive model described in Table 1.
This Software is executed through a computer platform via the internet and also requires the following information: 1) usable moisture by soil stratum (UM) calculated as the difference between θfc and permanent wilting point (θpwp); 2) crop phenology; 3) climatic variables: mean temperature (Tm) and reference evapotranspiration (ETo-FAO) (Allen et al., 1998; Mahima, 2018) and rainfall (PP), acquired in ‘quasi-real’ time from an automated agroclimatic station; and 4) application of irrigation. It was assumed that the root zone reaches moisture at field capacity (θfc) at the end of each irrigation.
To have greater control of the application and evaluation of the irrigations, a drip system was used with a tape of 18 mm in diameter and drippers separated at 0.3 m with a nominal expenditure of 1 L h-1, installed in the upper part to the center of each sowing bed. The irrigations were evaluated in terms of application efficiency (AE) and water productivity (WP), expressed in % and kg m-3, respectively.
The estimation of AE was made with equation (2):
Where: Sn= represents the net sheet or net irrigation requirement (cm) determined with the model, and Sb= represents the applied sheet (cm) measured with the irrigation system (Rendón et al., 2012). The calculation of WP was performed with equation (3):
Where: Y= represents the yield (t ha-1) and VA= the volume of water applied per hectare (m3 ha-1).
The phenology of the crop was monitored weekly using an adaptation of the methodology reported by Jefferies and Lawson (1991), considering the following phases of development: 1) sprouting; 2) emergence; 3) start of stolonization; 4) stolon elongation; 5) start of tuberization (diameter >1 cm); 6) tuber development (diameter from 3 to 5 cm); 7) developed tubers (diameter >5 cm); 8) foliage killing (complete skin) (diameter from 7 to 8 cm); and 9) harvest.
GDDs were accumulated for each development phase using the mean daily air temperature (Ta) from an automated weather station (AWS) located 100 m from the experimental lot. GDDs were calculated with the method reported by Ojeda et al. (2004) in potato crop studies in Sinaloa, using 2 and 29 °C as minimum and maximum development threshold temperatures.
Soil moisture was also monitored biweekly in the two upper strata (0-30 and 30-60 cm) with a Spectrum 300 time-domain reflectometry (TDR)-type portable moisture sensor manufactured in Illinois, USA, and calibrated for the study area.
The killing of foliage was carried out using contact herbicide Velquat 25 (ai. Paraquat) on 10/02/2016 at 1 754 AGDDs, while the harvest was carried out on 11/03/2016 at 2 282 AGDDs once the tuber skin had the appropriate consistency. The tubers were extracted from the soil mechanically by tractor, using 18-inch moldboards mounted on a horizontal support bar. After the killing of foliage, in each experimental plot, the tubers that remained within an area of 9 m2 (useful plot) formed of the two central beds 5 m long (2 x 0.9 x 5 m) were collected and weighed manually.
The samples obtained were determined the variables Y, relative yield (RY), and quality; the first calculated with equation (4):
Where: Ws= represents the weight of the sample expressed in kg, Y= in t ha-1 and the constants 10 and 9 are constants for unit conversion. RY of each variety was calculated with respect to the yield of the treatment with low water deficit, expressed as a percentage.
To analyze the quality of tubers, the different qualities were separated considering the equatorial diameter (mm), according to the criteria of the area (Table 2) and it was expressed in terms of percentage with respect to the total yield. Camargo et al. (2015) used a similar methodology grouping three categories, specifying that tubers of 40 to 80 mm in diameter are the most commercialized, which coincides with the classification of the study area. In addition to the equatorial diameter, deformed (DEF) and diseased (NCO) tubers were separated.
Table 2 Classification of potato tubers based on equatorial diameter used in northern Sinaloa, Mexico.
| Quality | Code | Diameter (mm) |
|---|---|---|
| First | Q1 | 71-80 |
| Second | Q2 | 51-70 |
| Third | Q3 | 41-50 |
| Fourth | Q4 | 31-40 |
| Fifth | Q5 | 21-30 |
| Giant | GIA | >80 |
| Deformed | DEF | - |
| Noncommercial | NCO | - |
For the statistical analysis, the SAS online version (www.sas.com/es-mx/software/on-demand-for-academics.htm) computer program was used, with which an analysis of variance of the variables yield (Y) and quality (Q) was carried out, considering the simple effects and the interaction of the factors water stress and varieties, in addition to a comparison of means with Tukey’s test (p≤ 0.05). The model used is shown in equation (6) (Fernández et al., 2010).
Where: Yijr - μ= represents the deviation of an observation from the global mean (μ); ρr= are the deviations caused by the blocks; αi= is the main factor; βj= is the subordinate factor; (αβ)ij= is the interaction between factors; and εjr and εijr= are random errors. For the quality variable, an analysis of the distribution of each classification by variety was carried out to know the effect of water deficit on this important variable.
Results and discussion
Yield and quality
Table 3 shows the analysis of variance of variables Y and Q of the two factors studied. The analysis shows a significant effect (Tukey, p≤ 0.05) of the water deficit factor only for the variable Y; the results showed a reduction of up to 3.65 t ha-1 of the variable Y in the treatment with high water deficit compared to the low deficit, which is consistent with what was reported by Steduto et al. (2012); Mahima et al. (2018).
Table 3 Analysis of significance of yield (Y) and quality (Q) of three potato varieties subjected to three levels of water deficit.
| Treatments | Y | Q1 | Q2 | Q3 | Q4 | Q5 | DEF | NCO | |
|---|---|---|---|---|---|---|---|---|---|
| (t ha-1) | |||||||||
| Water deficit | |||||||||
| Low | 26.45 | 2.61 | 4.56 | 5.21 | 6.19 | 5.08 | 1.03 | 1.76 | |
| Medium | 24.99 | 2.04 | 4.06 | 5.27 | 5.92 | 4.64 | 1.88 | 1.17 | |
| High | 22.8 | 1.96 | 3.5 | 4.96 | 4.01 | 5.48 | 1.66 | 1.24 | |
| Tukey (p ≤ 0.05) | s | ns | ns | ns | ns | ns | ns | ns | |
| Varieties | |||||||||
| Fiana | 26.14 | 3.09 | 5.29 | 5.23 | 4.14 | 5.88 | 1.49 | 1.01 | |
| Ágata | 26.45 | 0.57 | 3.13 | 4.93 | 7.4 | 6.74 | 1.94 | 1.75 | |
| Atlantic | 21.22 | 2.99 | 3.62 | 5.29 | 4.44 | 2.36 | 1.15 | 1.38 | |
| Tukey (p ≤ 0.05) | s | s | s | ns | s | s | ns | ns | |
| Water deficit x variety interaction | |||||||||
| Low | Fiana | 30.29 | 3.5 | 6.64 | 5.96 | 4.65 | 6.77 | 1.2 | 1.58 |
| Ágata | 26.11 | 1.23 | 3.03 | 4.96 | 8.6 | 4.91 | 1.19 | 2.2 | |
| Atlantic | 21.78 | 3.26 | 3.85 | 4.55 | 5.02 | 3.07 | 0.61 | 1.41 | |
| Medium | Fiana | 25.80 | 2.9 | 5.03 | 5.65 | 4.47 | 6.06 | 1.41 | 0.29 |
| Ágata | 27.83 | 0.38 | 3.93 | 5.23 | 7.88 | 5.58 | 3.1 | 1.73 | |
| Atlantic | 21.34 | 2.85 | 3.21 | 4.94 | 5.42 | 2.3 | 1.13 | 1.5 | |
| High | Fiana | 22.33 | 2.86 | 4.22 | 4.08 | 3.29 | 4.83 | 1.87 | 1.18 |
| Ágata | 25.42 | 0.1 | 2.42 | 4.62 | 5.71 | 9.72 | 1.53 | 1.33 | |
| Atlantic | 20.67 | 2.92 | 3.87 | 6.19 | 3.02 | 1.88 | 1.58 | 1.22 | |
| Tukey (p ≤ 0.05) | ns | ns | ns | ns | ns | s | ns | ns | |
Y= yield; Q= quality; DEF= deformed tubers; NCO= noncommercial; s= statistically significant; ns= statistically non-significant (Tukey, p≤ 0.05).
Regarding the variety factor, a significant effect was also observed in the variables Y, Q1, Q2, Q4, and Q5; Fiana and Ágata obtained similar yields, with 26.14 and 26.45 t ha-1 respectively, while Atlantic obtained 21.22 t ha-1, which represents a difference of 4.92 t ha-1. In this factor, Q1 and Q2 were higher with Fiana, followed by Atlantic and Ágata; Fiana also presented fewer noncommercial tubers.
In the water deficit-variety interaction, significance was found only for the Q5 variable; however, important effects were observed: at the low level of water deficit, Fiana obtained the highest yield (30.29 t ha-1), with more Q1 and Q2, followed by Ágata and Atlantic, with the latter showing fewer DEF and NCO tubers. At the medium level, Ágata was the best in yield but the lowest in Q1 and highest in DEF and NCO. The behavior was similar at the high level; Ágata was the best in Y but with less Q1 and Q2 and an important presence of DEF and NCO.
Relative yield (RY)
Figure 1 shows the effect of the three levels of water deficit on the RY of each variety (stress level x variety interaction). The results indicate that with the high level of water stress (∝3 = 0.45), the Fiana variety had the highest RY drop, with 26.3%, followed by Atlantic with 5.1% and Ágata with only 2.8%, compared to the low level, and tendency not to affect the yield at the medium level. This indicates that the Fiana variety is the most sensitive to water deficit, while Ágata is the most tolerant, Atlantic can be considered of intermediate sensitivity.
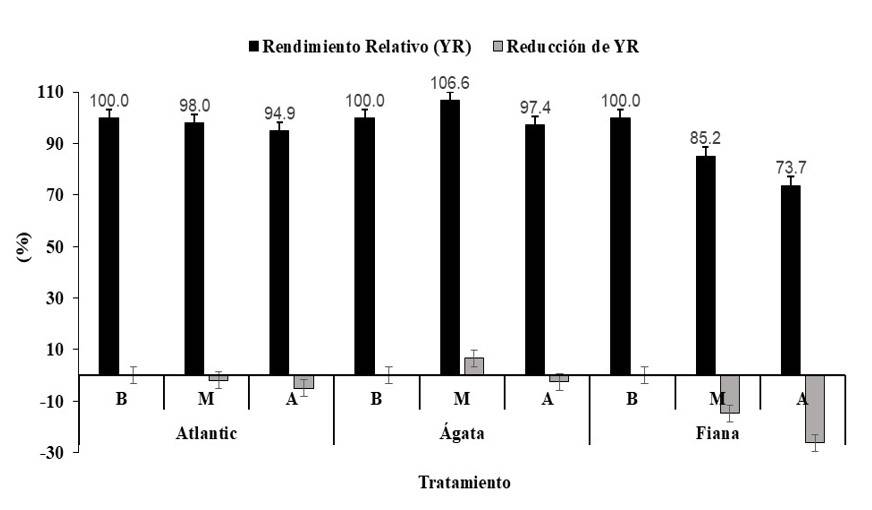
Figure 1 Relative yield (RY) in three potato varieties subjected to three levels of water deficit. B= low deficit (L); M= medium deficit; A= high deficit (H) in northern Sinaloa, Mexico.
Studies such as those by Da Silva et al. (2019) reported a similar behavior regarding the Ágata variety, concluding that the best management conditions were obtained when applying intermediate irrigation sheets (27 mm between irrigations).
Quality distribution
An important effect of water deficit on this variable was found in each variety (Figure 2), as reported by Jha et al. (2017). At the low deficit level, the Atlantic variety produced the largest number of Q1 and Q2 tubers, with 15 and 18% of total production, respectively. The high and medium deficits generated the highest values of Q3 tubers, with 30 and 23%, while the highest value of Q4 tubers was obtained with the medium level of water deficit.
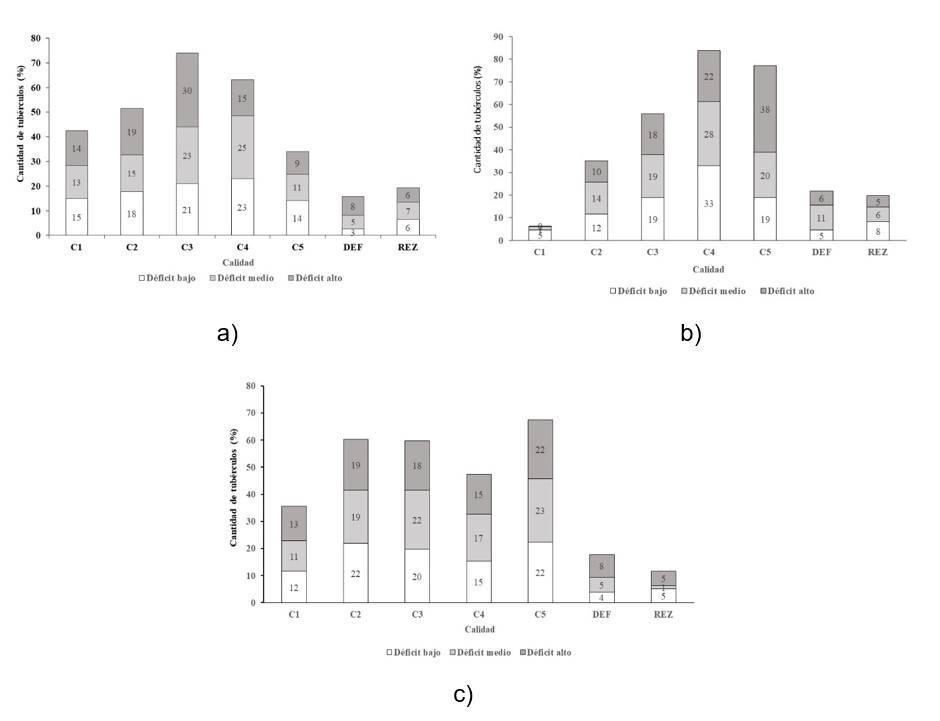
Figure 2 Distribution of the quality of the tuber production of potato varieties Atlantic. a) Ágata; b) Fiana and c) subjected to three levels of water deficit in northern Sinaloa, Mexico.
The Q5 tubers remained around 10% in the three levels of water deficit due to their little development due to the advance to harvest induced through the defoliant. Similarly, for the Ágata variety, the highest percentages of Q1 and Q2 tubers were generated with the low level of water deficit (5 and 12%, respectively), maintaining similar values in the Q3 tubers in the three levels of deficit (18 to 19%).
A significant increase in Q4 and Q5 tubers was analyzed in the three deficit levels, mainly with the high value, which induced the production of 38% of Q5 tubers. The high values of Q4 and Q5 tubers could also be due to the slower development of this variety compared to the others. This confirms that the values of parameter ∝3 are associated with the irrigation system; the values vary from 0.15 to 0.3 for drip irrigation, from 0.4 to 0.55 for sprinkler irrigation, and they were greater than 0.6 for gravity irrigation (Ojeda et al., 2004).
Regarding the Fiana variety, the highest values of Q1 tubers were similar in the three levels of water deficit, with percentages of 11 to 13%, while the highest values of Q2 tubers occurred with the low level of deficit, with 22%. The Q3, Q4, and Q5 tubers presented similar increases in the three stress levels; although the higher percentage was more frequent with the medium level of water deficit in the three qualities, a behavior similar to the other varieties.
With regard to DEF tubers, a direct relationship with water deficit was examined in all three varieties; that is, when this increases, the proportion of this class of tubers increases, as mentioned by Steduto et al. (2012), it reached values close to 10% of production with the high and medium level of deficit.
In the NCO, a tendency towards an increase with the low level of water deficit was found in the three varieties, which may be associated with a more humid environment generated by the low permeability of the soil, Wagg et al. (2021) suggest high levels of moisture in well-drained soils, since heavy and frequent irrigation in soils with low permeability favors the development of pathogens, mainly fungi and bacteria (Rich, 1983). With the medium and high deficit levels, the tendency was towards decreasing NCO, so in practice, the different stress management scenarios should be analyzed according to the objectives of each producer.
Water use efficiency
Table 4 presents a summary of applied supplemental irrigations generated with the three levels of water deficit. It was perceived that 14 supplemental irrigations with a maximum interval of 22 days and a minimum of five days were generated for the low level; eight supplemental irrigations with a maximum interval of 30 days and a minimum of eight days were applied with the medium level of deficit.
Table 4 Summary of supplemental irrigation applied in three levels of water deficit (MAD) in potato crops, generated with the Irrimodel platform (Sifuentes and Macías, 2015).
| Water deficit (MAD) | Supplemental irrigations applied | Maximum interval (days) | Minimum interval (days) | Net sheet (cm) | Gross sheet (cm) | Application efficiency (%) |
|---|---|---|---|---|---|---|
| L (0.15) | 14 | 22 | 5 | 29.5 | 32.5 | 90.6 |
| M (0.3) | 8 | 30 | 8 | 28.8 | 32 | 90 |
| H (0.45) | 5 | 36 | 13 | 28.4 | 34.8 | 81.5 |
L= low deficit; M= medium deficit; H= high deficit.
On the other hand, with the high level, the maximum and minimum intervals were 36 and 13 days, respectively. Regarding the irrigation requirements or Sn, the low level had a value of 29.5 cm, higher than the medium and high levels, due to the lower level of stress to which the crop was subjected, which affects evapotranspiration.
A higher value of AE was also observed at the low and medium levels, with values of 90.6 and 90%, respectively, while at the high level of stress, it was 81.5% because of the reduction of Sn due to the high stress considered in the ETc calculations and the greater Sb derived from a longer irrigation time used in the formation of the wet bulb.
Regarding WP, it was found that with the low level of water deficit, the varieties Atlantic and Fiana obtained the highest values, with 6.7 and 9.32 kg m-3, respectively, while for Ágata, the highest values were similar at the low and medium levels, with 8.03 and 8.7, which indicates some resistance to water stress. In all cases, the values are in the range reported by Erdem et al. (2006); Steduto et al. (2012); Mahima et al. (2018).
Conclusions
The Fiana variety was the most sensitive to water deficit from the point of view of yield, followed by Atlantic and Ágata. Applying irrigation intervals, sheets, and AE recommended by the Irrimodel Software was very convenient in all cases. The effect of water deficit on tuber size was different for each variety due to their specific development pattern and tolerance to water stress.
As the water deficit increased (∝3 high), associated with a longer irrigation interval, the proportion of deformed tubers increased, while diseased and noncommercial tubers increased with the low deficit (∝3 low), so conditions of excess moisture should be avoided, mainly in heavy soils and cold climatic conditions.
The application of the Irrimodel software represents an excellent automated tool for the controlled management of water deficit according to the irrigation system, which translates into the improvement of potato yield and quality for the producing areas of Mexico. For a greater effect of water deficit on yield, it is suggested to use ∝3 values of 0.15, 0.45, and 0.6 for low, medium, and high deficits, which are associated with drip, sprinkler, and gravity irrigation systems, respectively.
Bibliografía
Allen, R. G.; Pereira, L. S.; Raes, D. and Smith, M. 1998. Crop evapotranspiration guidelines for computing crop water requirements. FAO Irrigation and Drainage Paper. 56. ISSN: 0254-5293. Roma, Italia. 298 p. [ Links ]
ASERCA. 2018. Agencia de Servicios a la Comercialización y Desarrollo de Mercados Agropecuarios. http://www.infoaserca.gob.mx/claridades/revistas/057/ca057.pdfwww.infoaserca.gob.mx/claridades/revistas/057/ca057.pdf. [ Links ]
Badii, M. H.; Castillo, J.; Rodríguez, M.; Wong, A. and Villalpando, P. 2007. Experimental designs and scientific research. UANL, San Nicolás, NL, 66450,. México. InnOvaciOnes de NegOciOs. 4(2):283-330. [ Links ]
Camargo, D. C.; Montoya, F.; Ortega, J. F. and Córcoles, J. I. 2015. Potato yield and water use efficiency responses to irrigation in semiarid conditions. Agronomy Journal. 107(6):2120-2131. Doi:10.2134/agronj14.0572. American Society of Agronomy, Madison, WI 53711 USA. [ Links ]
CONAGUA. 2018. Comisión Nacional del Agua. Estadísticas hidroagrícolas de los distritos de riego. https://www.gob.mx/conagua/documentos/estadisticas-agricolas-de-los-distritos-de-riego. [ Links ]
Da Silva, E. F.; Jadoski, S. O. and Martinkoski, L. 2019. Water depletion depth for irrigation of potato cultivar Ágata. Engenharia agrícola, Jaboticabal. 39(4):434-443. Doi: http://dx.doi.org/10.1590/1809-4430-Eng.Agric.v39n4p434-443/2019 [ Links ]
Erdem, T.; Erdem, Y.; Orta, H. and Okursoy, H. 2006. Water yield relationships of potato under different irrigation methods and regimens. Sci. Agric. Piracicaba, Braz. 63(3):226-231. [ Links ]
Fernández-Escobar, R.; Trapero, A. y Domínguez, J. 2010. Experimentación en agricultura. Junta de Andalucía Consejería de Agricultura y Pesca-Secretaría General Técnica, Servicio de Publicaciones y Divulgación. ISBN: 978-84-8474-281-4. Madrid, España. 350 p. [ Links ]
INIFAP. 2010. Instituto Nacional de Investigaciones Forestales. Agrícolas y Pecuarias. Informe final del proyecto: evaluación del cambio climático en la productividad de la agricultura de riego y temporal del estado de Sinaloa’. Reporte técnico del proyecto. Instituto Mexicano de Tecnología del Agua (IMTA). 15-35 pp. [ Links ]
Jefferies, R. A. and Lawson, H. M. 1991. A key for the stages of development of potato (Solanum tuberosum). Annals of Applied of Biology. 119(2):387-389. [ Links ]
Jha, G.; Choudhary, O. P. and Sharda, R. 2017. Comparative effects of saline water on yield and quality of potato under drip and furrow irrigation. Cogent Food & Agriculture 3(1) https://doi.org/10.1080/23311932.2017.1369345. [ Links ]
Lobato, S. R. y Altamirano, M. A. 2017. Detección de la tendencia local del cambio de la temperatura en México. Tecnología y Ciencias del Agua (IMTA). 8(6):101-116. Jiutepec, Morelos, México. [ Links ]
Mahima, B.; Mrinal, S.; Abhijit, S.; Nayan, J. O.; Pompy, D.; Poran, K. D. and Ipsita, O. 2018. Water management for higher potato production: a review. Int. J. Curr. Microbiol. App. Sci. 7(5):24-33. [ Links ]
Ojeda, B. W.; Flores, V. J.; Íñiguez, C. M.; Unland, W. H.; Carrillo, G. M.; Rojano, A. A.; Flores, G. H.; Macías, C. J.; Flores, M. H.; López, L. R.; Sifuentes, I. E. y Ruiz, G. A. 2015. Calendarización del riego: teoría y práctica. Libro, 2da. Ed. Jiutepec, Morelos, México. Instituto Mexicano de Tecnología del Agua. 3-307 pp. [ Links ]
Ojeda, B. W.; Sifuentes, I. E. y Unland, W. H. 2006. Programación integral del riego en maíz en el norte de Sinaloa. Agrociencia. 40(1):13-25. Montecillos, Estado de México. [ Links ]
Ojeda, B. W.; Sifuentes, I. E.; Slack, D. C. and Carrillo, M. 2004. Generalization of irrigation scheduling parameters using the growing degree days concept: application to a potato crop. Irrigation and Drainage. 53(1):521-261. [ Links ]
Onamu, R.; Legaria, S. J. P.; Castellanos, S. J.; Rodríguez, O J. L. y Pérez, N. J. 2015. Diversidad genética entre variedades de papa (Solanum tuberosum L.) cultivadas en México. Revista Fitotecnia Mexicana. 38(1):7-15. Chapingo, Texcoco, Estado de México. [ Links ]
Rendón, P. L.; Saucedo, R. H. E. y Fuentes, R. C. 2012. Diseño de riego por gravedad. Ed. Universidad Autónoma de Querétaro ISBN: 978-607-513-031-6. Querétaro. 358 p. [ Links ]
Rich, A. E. 1983. Potato diseases. Department of botany and plant pathology. University of New Hampshire, Durhan, New Hampshire. Published by academic press Inc. London. ISBN 0-12-587420-0. 10-238 pp. [ Links ]
SEMARNAT. 2012. Secretaría del Medio Ambiente y Recursos Naturales. Informe de la Situación del Medio Ambiente en México. Compendio de estadísticas ambientales. indicadores clave y de desempeño ambiental. 361 p. [ Links ]
SIAP. 2021. Servicio de Información Agroalimentaria y Pesquera. Avance de siembras y cosechas resumen por estado; producción anual agrícola. https://www.gob. mx/siap/acciones-y-programas/produccion-agricola-33119. [ Links ]
Sifuentes, I. E. y Macías C. J.2015. Programación integral y gestión del riego a través de Internet. Manual de usuario v. 2.0. INIFAP-CIRNO-Campo Experimental Valle del Fuerte. Folleto técnico núm. 42. 39 p. [ Links ]
Soltero-Díaz, L.; Garay-López, C. y Ruiz-Corral, J. A. 2010. Respuesta en rendimiento de híbridos de maíz a diferentes distancias entre surcos y densidades de plantas. Revista Mexicana de Ciencias Agrícolas. 1(2):149-158. [ Links ]
Steduto, P.; Hsiao, T. C. Fereres, E. y Raes, D. 2012. Respuesta del rendimiento de los cultivos al agua. Estudio FAO. (Organización de las Naciones Unidas para la Alimentación y la Agricultura). Riego y drenaje 66. ISSN 0254-5284, E-ISBN 978-92-5-308564-4 (PDF). Roma, Italia. 510 p. [ Links ]
Wagg, C.; Hann, S.; Kupriyanovich, Y. and Li, S. 2021. Timing of short period water stress determines potato plant growth, yield and tuber quality. Agricultural Water Management. 247: https://doi.org/10.1016/j.agwat.2020.106731 [ Links ]
Received: August 01, 2023; Accepted: October 01, 2023
 Este es un artículo publicado en acceso abierto bajo una licencia Creative Commons
