


Serviços Personalizados
Journal
Artigo
 texto em
  Inglês (pdf)
 Artigo em XML
 Referências do artigo
 Enviar este artigo por email
Indicadores
-
 Citado por SciELO
 -
 Acessos
Links relacionados
-
 Similares em
SciELO
Similares em
SciELO
Compartilhar

 Permalink
Revista mexicana de ciencias agrícolas
versão impressa ISSN 2007-0934
Rev. Mex. Cienc. Agríc vol.14 no.5 Texcoco Jun./Ago. 2023 Epub 15-Set-2023
https://doi.org/10.29312/remexca.v14i5.3084
Articles
Temporal variation of irrigation requirements in corn Rodionov method in DR001, Pabellón, Aguascalientes
1Posgrado de Hidrociencias-Colegio de Postgraduados. Carretera México-Texcoco km 36.5. Montecillo, Texcoco, Estado de México. CP. 56230. (guzman.lilibeth@colpos.mx; bolanos@colpos.mx).
2 Instituto de Investigaciones en Ecosistemas y Sustentabilidad-Universidad Nacional Autónoma de México. Antigua Carretera a Pátzcuaro #8701, Col. ExHacienda de San José de la Huerta, Morelia, Michoacán. CP. 58190. (fpascualr@iies.unam.mx).
3 Universidad Tecnológica Latinoamericana. Calzada de la Naranja núm. 159. Col. Fraccionamiento Industrial, Naucalpan, Estado de México, México. CP. 53370. (jrguzman84@gmail.com).
Some of the consequences of climate change will manifest themselves in temporal and spatial variations in precipitation and in an increase in the evaporative demand of the atmosphere, which in turn will lead to an increase in the demand for irrigation of agricultural crops. This work analyzed the temporal variation of agroclimatic irrigation requirements (AIRs) for corn in DR001 Pabellón, Aguascalientes, as well as the thermal growth period (TGP) with information from five climatological stations with 36 years of records. A base temperature of 9 °C was assumed to define three sowing dates: February 15, June 15 and October 15. The AIRs were estimated with a climatological station with more records (1943-2018), the Hargreaves method was used to calculate reference evapotranspiration and the United States Agricultural Service method was used for effective precipitation. The temporal variation (mean and standard deviation) of the AIRs was performed by the Rodionov method, by means of the indices of regime changes in the mean and in the variance (CSSI). The index values of regime changes indicate that an increase in the AIRs began in 1995, for the sowing date February 15, an initial change was observed in 2009 for that of June 15, while for October 15 there is an increase in the year 1993 with another in the years 2012 to 2018. No changes in CSSI, with evidence of changes in the AIRs, which are related to the variation of precipitation and temperature.
Keywords: climate change; mean changes; rainfall regime; variance changes.
Algunas de las consecuencias del cambio climático se manifestarán en variaciones temporales y espaciales de la precipitación y en un incremento en la demanda evaporativa de la atmósfera, lo que a su vez propiciará un incremento en la demanda de riego de cultivos agrícolas. En este trabajo se analizó la variación temporal de los requerimientos de riego agroclimáticos (RRa) para maíz en el DR001 Pabellón, Aguascalientes, así como el periodo de crecimiento térmico (PCT) con información de cinco estaciones climatológicas con 36 años de registros. Se asumió una temperatura base de 9 °C, para definir tres fechas de siembra: 15 de febrero, 15 de junio y 15 de octubre. Se estimó los RRa con una estación climatológica con más registro (1943-2018), se utilizó el método de Hargreaves para calcular la evapotranspiración de referencia y el método del Servicio de Agricultura de los Estados Unidos para la precipitación efectiva. La variación temporal (media y desviación estándar) de los RRa se realizó por el método de Rodionov, por medio de los índices de cambios de régimen en la media y en la varianza (CSSI). Los valores índices de cambios de régimen en la indican que se inició un incremento en los RRa en el año 1995, para la fecha de siembra 15 de febrero, se apreció un cambio inicial en 2009 para la de 15 de junio, mientras que para el 15 de octubre hay un aumento en el año 1993 con otro en los años 2012 a 2018. Sin cambios en CSSI, con evidencias de los cambios en los RRa, que se relacionan con la variación de la precipitación y temperatura.
Palabras clave: cambio climático; cambios de media; cambios de varianza; régimen de lluvia
Introduction
The Comision Nacional del Agua (CNA, 2018) considers agriculture the sector with the highest amount of water demanded, being around 76% of the total available in the country. A resource that tends to be scarce due to human demand and competition by other sectors (FAO, 2012). To enable a more efficient and sustainable use of water resources, a greater understanding of water use is needed, especially how water deficiencies develop and affect plant growth and productivity (Kadambot et al., 2014).
Increasing water productivity in agriculture means increasing crop production per unit of use of water resources, improving the competitiveness of producers, and enabling better management of water, land, and other resources (Al Hinai and Jayasuriya, 2021). On the other hand, global warming is causing changes in the water cycle (Trenberth et al., 2014), for example, with greater energy in the Earth’s climate system, evaporation increases and more precipitation occurs, a global rate of increase around 2% per degree Celsius of warming is estimated (Trenberth and Fasullo, 2012); however, the spatial and temporal distribution is highly variable, as some areas will receive more precipitation, but most currently water-scarce regions will become drier and warmer (Perry et al., 2009).
An increase in potential evapotranspiration is also estimated, in dry areas it means greater desiccation and more intense and lasting droughts (Trenberth et al., 2014). Lopez et al. (2016) mention that one of the expected effects of climate change is the modification of precipitation patterns, in addition to the decrease in food production as crop cycles are altered, changing sowing and harvesting dates, and promoting the proliferation of weeds, pests and diseases in crops. With increased demand for water for agricultural use, supply-demand tensions are likely to worsen (Perry et al., 2009).
To know the effect on crops, it is necessary to know the irrigation requirements (IRs) (Allen et al., 2006; Ojeda et al., 2008). Net irrigation requirements (NIRs) should also be estimated by the potential evapotranspiration of the crop minus effective precipitation, water table inputs and moisture changes in the crop’s root zone. To calculate the gross irrigation requirements (GIRs), it is adjusted with the overall efficiency of the irrigation system and soil washing needs are considered (Ojedad et al., 2008).
For the estimation of NIRs, there are different programs, for example, CropWat (FAO, 1992), RASPAWIN; SPRITER (IMTA) for real-time irrigation forecasting (Ojeda et al., 1999), some can even generate irrigation schedules, among others is AquaCrop (FAO, 2012). For Soares et al. (2018), the hydrological cycle and climate are highly related, so climate variations directly influence the rainfall regime of many countries and particularly in Mexico. Martínez and Patiño (2012) mention that the repercussions of global climate change are observed in the availability of water in many agricultural regions of Mexico.
With a forecast of an increase in the average temperature in different regions of Mexico, which will imply a scarcity of water resources, the production and yield of crops can be conditioned. The tests applied by authors such as Maronna and Yohai (1978); Alexandersson (1986); Gullett et al. (1990); Easterling and Peterson (1995) have been used as precedents and are suggested as reliable methods of testing homogeneity in climatic time series (Tayanç, 1998).
Normally, these methods developed to detect a regime change, or discontinuity, in time series, employ statistical techniques, such as Student or Mann-Kendall tests and their updates (Rodionov, 2004), with different applications (Rodionov and Overland, 2005). Rodionov (2004) proposed a technique of data processing in a sequential manner, where the number of observations are not fixed, but come in sequence, where for each new observation, the check is made to determine if it represents a statistically significant deviation that considers the existence of a regime change.
Variance changes in climate parameters can have an equivalent or greater impact on ecosystems than changes in the mean (Rodionov, 2005). Given the variation of climate, the present work analyzed the effect of temporal variations in water requirements of corn crops in DR001 Pabellón, Aguascalientes.
Materials and methods
It is assumed that the main effect is given by changes in atmospheric conditions, during historical records given a place. Changes in water demand and water deficiencies are affected by variations in climate elements, in particular by reference evapotranspiration (ETo), crop coefficient (Kc, crop development condition and management) and effective precipitation. The type of soil and its storage capacity were not considered in this first approximation.
Description of the study area
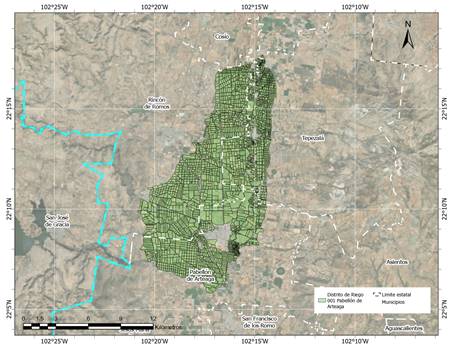
The Irrigation District 001 (DR001), Pabellón de Arteaga, Aguascalientes, is located in the north central region of the state of Aguascalientes, between coordinates 22° 06’ and 22° 17’ north latitude and between 102° 13’ and 102° 21’ west longitude, with an altitude ranging from 1 884 masl to 1 927 masl, it is administered by CONAGUA through the hydrological-administrative region VIII, Lerma-Santiago-Pacífico (Figure 1).
Climatological information
The historical records of the variables of temperatures (°C) and precipitation (mm) referring to the stations within the study area were recovered from the National Meteorological Service (SMN, 2021), which provides the meteorological information of the country. Through the website https://smn.conagua.gob.mx/, data (*.txt) of the stations was downloaded from a linking file in KMZ format (*.kmz).
Strategy for the acquisition of climatological information
Stations that had their area of influence within the limits of the DR001, which was obtained from geoprocessing in a geographic information system (GIS); through Thiessen polygons that allowed them to be identified. Have the largest number of years of record and most current, with at least a period of 30 years with data on minimum and maximum temperature and precipitation (Wilhite and Glantz, 1985). Verification of the quality and quantity of information, by the graphical method to identify the continuity in the series, and analytical method for the percentage of information available.
Information processing
Through Python programming, the pre and processing of agroclimatic information was carried out, as well as to calculate the time series of irrigation requirements. The geoprocessing of the vector information was done through the software: ArcGIS Pro, QGIS and Google Earth.
Calculation of the thermal growth period (TGP)
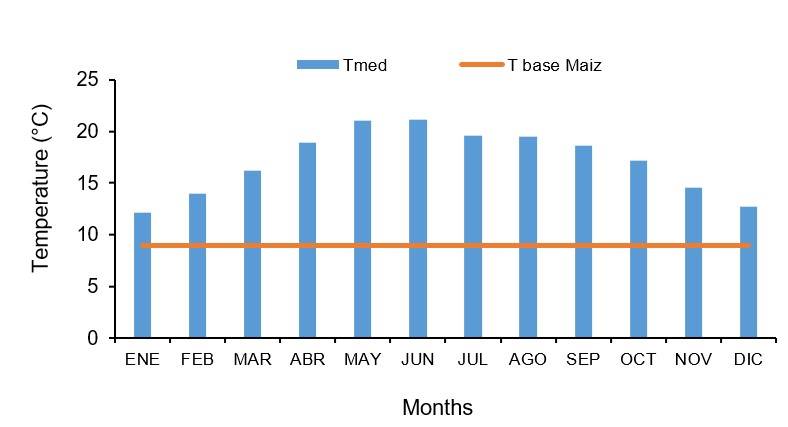
With the maximum and minimum temperatures available from the five stations that cover the study area of the DR001, the average monthly temperatures were calculated and a graph was made to analyze the base temperature of corn growth of 9 °C that favors the growth and development of the crop (Arista et al., 2018), to subsequently determine the period during the year where the corn crop will have no limitations in its growth with respect to temperature.
Calculation of atmospheric irrigation requirement (AIR)
It was calculated as a difference between crop evapotranspiration minus effective precipitation, without considering the type of soil (atmospheric demand only). The calculation of the reference evapotranspiration (ETo) was estimated with the Hargreaves formula and the effective precipitation with the method of the United States Agricultural Service (USDA), for different periods of growth during the period of historical record available in the study area of the climatological station 01019, Presa Jocoque, Pabellón de Arteaga. Corn evapotranspiration was calculated using the equation recommended by FAO (Allen et al., 2006): ETc = Ks * Kc * ETo.
Where: ETc= is the crop evapotranspiration (mm day-1); Kc= is the dimensionless crop coefficient; Eto= is the reference evapotranspiration (mm day-1); and Ks= is the dimensionless coefficient due to the effect of the residual water stored in the soil, because it is an irrigation area and it is expected that the plants are not subjected to water stress (so its value is assumed at 1). The considerations were made in the above equation, and it was simplified: ETc = Kc * ETo. The AIRs were estimated from the equation: AIR= ETc-EP Where: AIR= is the effective precipitation (mm).
Estimation of reference evapotranspiration (ETo)
The simplified formula of the Hargreaves method was used ET0 = 0.0023(tave + 17.78)R0 × (tmax--tmin)0.5. Where: ET0 = is the daily potential evapotranspiration (mm day-1); tave = is the average daily temperature (°C); R0 = is extraterrestrial solar radiation, in tables (mm day-1); tmax = is the maximum daily temperature (°C); and tmin= is the minimum daily temperature (°C).
Estimation of effective precipitation (EP)
The calculation was performed with the USDA method with the formulas:
when P<250 mm ⁄period.EP=125-0.1×P when P>250 mm ⁄period.
Where: EP= is the effective precipitation; mm or cm; and P= is the total precipitation mm or cm.
Application of the normality test
The series of corn irrigation requirements was evaluated with the Kolmogorov-Smirnov test improved by Lilliefors (Lilliefors, 1967) by means of R, to evaluate the adjustment to a normal distribution.
Temporal evaluation of agroclimatic irrigation requirements (AIRs)
The methodology proposed by Rodionov (2006) was used through the Excel add-in (SHIFT Detection), version 2.1, which was developed in Visual Basic for Applications (VBA) for use in Excel 2002, a method that has been used to investigate trends in drought (Cortez et al., 2021). Tool available from the website https://www.beringclimate.noaa. gov/regimes/.
The detection of changes (in the mean and standard deviation) was carried out by means of the add-in, the time series of the irrigation requirements obtained was used, it was analyzed with different cut lengths of 5, 10, 15, 20, 25, 30, 35 for a significance level of 0.05 and for two different Huber weights: 1 and 2.
Results and discussion
Growth period. In the DR001 001 Pabellón, the average temperature exceeds the base temperature of corn throughout the year (Figure 2), thermal conditions that favor the growth and development of the crop during the twelve months of the year, although the difference is greater in the period from March to October.
Agroclimatic irrigation requirement (AIR)
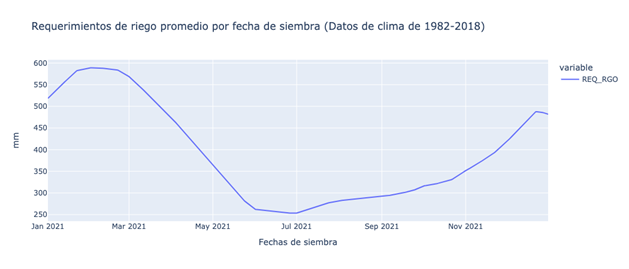
From the distribution of the AIRs (Figure 3), on the distribution of agroclimatic irrigation requirements for different sowing dates presented, the following sowing dates were proposed: June 15 (CNA, 2005), February 15 (from the average maximum irrigation requirement) and October 15 (beginning of the autumn-winter cycle), period where the irrigation requirements were obtained, where a duration of the cultivation cycle of 130 days, respectively, was assumed. On the last sowing date (October 15) the end of the cycle occurred in the following year, as shown in Figure 3.
Temporal variation of AIRs
For the date of February 15, a minimum requirement of 441.3 mm (in 2015) was obtained, while in 2011 a maximum requirement of 739.5 mm was found (Figure 4). Similarly, for the date of June 15 there is a minimum requirement of 113.1 mm (1971), while in 2011 the maximum requirement of 489.3 mm was found. Thus, for the date of establishment of October 15, there is a minimum requirement of 117.9 mm for the year 1992 and a maximum of 429.2 mm for the year 2008 (Figure 4). In all cases, regardless of the sowing date, it is observed that the highest irrigation requirements were obtained after the year 2000.
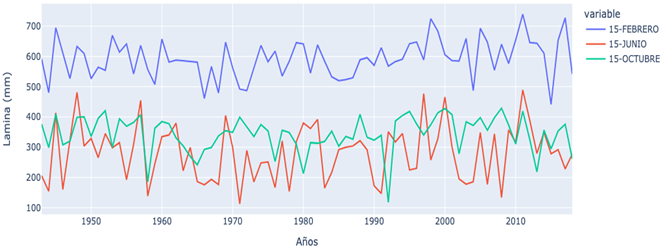
Figure 4 Temporal variation of irrigation requirements in corn for the three dates of establishment (1943-2018).
The year 2011 resulted in the highest requirements for both the theoretical date and the spring-summer cycle. In the modeling of agricultural production under climate change scenarios, it has been found that changes at the time of maximum irrigation demand, generated by uncertain water availability and increases in temperature, lead to reductions in corn yield (Woznicki et al., 2015), thus, changes in the requirements are related to changes in the pattern of sowing and harvesting, which affects the expected yield even without water stress.
In the case of the sowing date of February 15, the AIR has a mean of 592.29 mm, with a minimum value of 441.32 mm, a value that is above 75% of the requirements calculated for the establishment dates of June 15 and October 15 (Table 1). The AIRs for June 15 have a mean of 282.39 mm, the lowest of the means analyzed. For October 15, the lowest standard deviation occurred with a value of 58.92 mm and a maximum value of 429.15 mm, the lowest of the three maximum values calculated (Table 1).
Table 1 Statistics of the irrigation requirement (mm) for each date of establishment.
| Variables | February 15 | June 15 | October 15 |
| Years | 76 | 76 | 76 |
| Mean | 592.29 | 282.39 | 344.24 |
| Standard deviation | 63 | 90.78 | 58.92 |
| Minimum | 441.32 | 113.08 | 117.9 |
| 25% | 554.39 | 194.85 | 312.51 |
| 50% | 587.13 | 295.1 | 353.83 |
| 75% | 641.32 | 341.37 | 385.14 |
| Maximum | 739.52 | 489.3 | 429.15 |
In contrast, in a study on water balance in traditional irrigated corn in Zaragoza, Spain, during the period 2001-2010, where through the simulation of weather data (LARG-WG), the agro-hydrological model (SWAP), it was concluded that irrigation is sufficient, given the availability of water. Nevertheless, the simulation of heavy rains, there will be losses due to drainage and reduction in transpiration, therefore, also in yields (Utset and Martínez, 2003).
Detection of changes in the time of the AIRs
The changes in the mean of the irrigation requirements (for February 15) have increased from the year 1995 and between the years (2016-2018) in the mean of the AIRs, which depends on the parameters (Huber and cut length and level of significance α= 0.05. (Figure 5). With the sowing date set at February 15, when considering variations in the adjustment parameters (Huber, cut length) of the Radionov method and a significance level of α= 0.05 . The results showed increases in the AIRs from 1995, when the cut length was set at 15 and 25, while when it was set at 10, the increase was observed from 2016 (Figure 5).
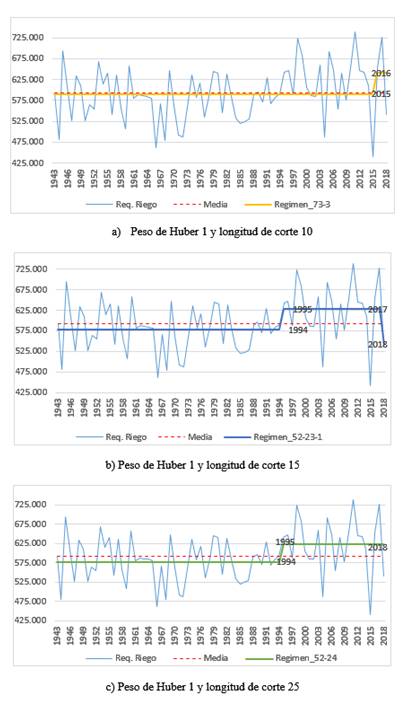
Figure 5 Changes in the mean of irrigation requirements from 1943 to 2018 with an establishment date of February 15.
Given the increases in water demand in crops, techniques are explored to reduce water demand; for instance, the application of foliar potassium silicate in combination with irrigation intervals every 15 days produces increases in yield and decreases the sheet of water consumed, which leads to the improvement of the total irrigation efficiency (Gomaa et al., 2021); however, these solutions explored by these authors are based on the incorporation of chemical elements into the system, to the detriment of sustainable solutions to improve the health of the productive agroecosystem.
The Huber parameter allowed evaluating the outliers (extremes) based on the standard deviation and the cut length is the number of years, to evaluate the moving averages. The effect on changes in the AIRs involved changes in rainfall and temperature patterns (Figure 6), which is reflected in the AIRs (Perry et al., 2009; Trenberth et al., 2014). The increase in temperature influences the earlier establishment of crops, where life cycles are shortened and their number increases; although this situation can favor the proliferation of invasive species as occurs with the corn pest Spodoptera frugiperda (fall armyworm) with its effect on decreasing yields in corn (Ramirez-Cabral et al., 2020).
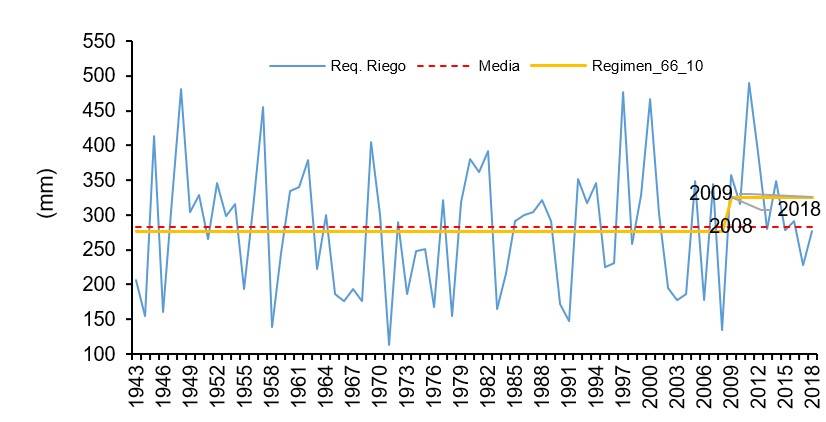
Changes in daily temperature accumulation lead to the modification of sowing patterns; however, in a work developed in the Kalamazoo River basin in Michigan, United States of America, when experimenting with soybeans and corn, it was found that bringing froward the sowing date increased the demand for irrigation due to more water available for transpiration, while delaying sowing contributed to decreasing water demand (Woznicki et al., 2015). For the establishment date of June 15, increases in AIRs were observed from the years 2008-2009 (Figure 6), with respect to the mean. The change of the regime during the record period (76 years), during the first 66 years there was no change and a change (increase) started in the last 10 years based on the Rodionov method and the configuration of the parameters (Huber, cut length and significance level α= 0.05).
When the sowing date was set at October 15, increases in the mean of irrigation requirements were observed from 1993 (Figure 7). In the period between 2012-2018, a decrease was obtained (or it remains), which depends on the magnitude of the change depending on the configuration parameters (Huber and cut length). With respect to the variance (CSSI), no changes in irrigation requirements were found; for different dates of establishment, for different cut lengths and Huber weighting with a significance level of α= 0.05.
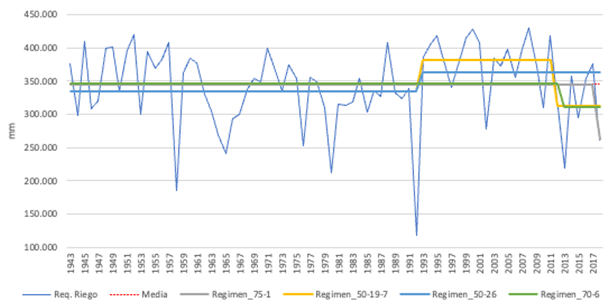
Figure 7 Changes in the mean of irrigation requirements between the years 1943 to 2018 with an establishment date of October 15.
The distribution of temperature and precipitation in time and space causes different production periods, which affect the demand for AIRs of the crop, showing seasonal variations. For example, for grain corn in Mexico, there are two production periods, one in January-November (year-on-year) which represented 59.9% of production and another in May-June with 27%. With the states of Sinaloa, Jalisco and Michoacán having the highest percentage, in terms of the value of production, of 22.1%, 15.7% and 7.3%, respectively (SADER and SIAP, 2020). Where based on the results, the mean AIRs have begun changes from the 90s, in the study region. Finally, in recent times, the adaptation strategies of corn to climate change are investigated with greater intensity, one of the lines that are followed in the development of new varieties is the prediction of stomatal responses, since it has been found that corn in the face of extreme water stress reduces the size of stomata and the area of stomatal pores, so this knowledge can contribute to anticipate the yield of corn in the coming years, to improve decision-making in the management of this crop (Serna, 2022).
Conclusions
From the analysis of the temporal behavior of the atmospheric irrigation requirements (AIRs) of the corn crop, in three sowing dates in the DR001. Based on the indices of regime changes in the mean (RSI) and variance (CSSI) by the Rodionov method, no change in variance was found, but in the mean of the AIRs. Based on the index (RSI) in the sowing dates: February 15 there were changes in the year 1995 (increase), also for the years (2016-2018), of June 15 the change began in 2009 (increase), and on October 15 it was observed in the year 1993 (with increase) and in the years 2012-2018 (it decreases or remains, based on the parameters of Huber and cut length, with α= 0.05). There is evidence of changes in the AIRs, which are related to the variation of temporal and spatial patterns of precipitation and temperature.
Bibliografía
Al Hinai, A. and Jayasuriya, H. 2021. Enhancing economic productivity of irrigation water by product value addition: case of dates. J. Saudi Soc. Agric. Sci. 20(8):553-558. https://doi.org/10.1016/j.jssas.2021.06.007. [ Links ]
Alexandersson, H. 1986. A homogeneity test applied to precipitation data. J. Climatol. 6(6):661-675. https://doi.org/10.1002/joc.3370060607. [ Links ]
Allen, R. G.; Pereira, L. S.; Raes, D. y Smith, M. 2006. Evapotranspiración del cultivo: guía para la determinación de los requerimientos de agua de los cultivos, Roma. FAO 298. 17-28 pp. [ Links ]
Arista-Cortes, J.; Quevedo-Nolasco, A.; Zamora-Morales, B. P.; Bauer-Mengelberg, R.; Sonder, K. y Lugo-Espinosa, O. 2018. Temperaturas base y grados días desarrollo de 10 accesiones de maíz de México. Rev. Mex. Cienc. Agríc. 9(5):1023-1033. https://doi.org/10.29312/remexca.v9i5.1507. [ Links ]
CNA. 2005. Comisión Nacional del Agua. Formulación del plan director para la modernización integral del riego del distrito de riego 001, Pabellón. Subdirección general de infraestructura hidroagrícola gerencia de distritos de riego. 204 p. [ Links ]
CNA. 2018. Comisión Nacional del Agua. Estadísticas del agua en México. Capítulo 1. Contexto geográfico y soberanía socioeconómica. Secretaría de Medio Ambiente y Recursos Naturales. 10-25 pp. http://sina.conagua.gob.mx/publicaciones/EAM-2018.pdf. [ Links ]
Cortez-Villa, J.; Quevedo-Nolasco, A.; Arteaga-Ramírez, R. y Carrillo-Flores, G. 2021. Tendencia de la sequía meteorológica en el estado de Durango, México, por el método de Rodionov. Tecnología y ciencias del agua. 11(1):85-131. https://doi.org/10.24850/j-tyca-2020-01-03. [ Links ]
Easterling, D. R. and Peterson, T. C. 1995. A new method for detecting undocumented discontinuities in climatological time series. Inter. J. Climatol . 15(4):369-377. https://doi.org/10.1002/JOC.3370150403. [ Links ]
FAO. 1992. Food and Agriculture Organization. Cropwat a computer program for irrigation planning and management. Irrigation and drainage paper 46. Rome. 65-80 pp. [ Links ]
FAO. 2012. Food and Agriculture Organization. Respuesta del rendimiento de los cultivos al agua. 119-125. http://www.fao.org/3/a-i2800s.pdf. [ Links ]
Gomaa, M. A.; Kandil, E. E.; El-Dein, A. A. M. Z.; Abou-Donia, M. E. M.; Ali, H. M. and Abdelsalam, N. R. 2021. Increase maize productivity and water use efficiency through application of potassium silicate under water stress. Scientific Reports. 11(1):1-8. https://doi.org/10.1038/s41598-020-80656-9. [ Links ]
Gullett, D. W.; Vincent, L. and Sajecki, P. J. F. 1990. Testing for homogeneity in temperature time series at Canadian climate stations. Atmospheric Environment Service. ON, Canada. 4-90 pp. [ Links ]
Kadambot, H. M. and Siddique, H. B. 2014. Water deficits: development. In: Encyclopedia of Natural Resources: land. Taylor and Francis: New York. 522-525 pp. [ Links ]
Lilliefors, H. W. 1967. On the Kolmogorov-Smirnov test for normality with mean and variance unknown. J. Am. Stat. Assoc. 62(318):399-402. Doi: 200.130.19.152. [ Links ]
López, F. A. J. y Hernández, C. D. 2016. Cambio climático y agricultura: una revisión de la literatura con énfasis en américa latina. El trimestre económico. 83(332):459-496. [ Links ]
Maronna, R. and Yohai, V. J. 1978. A bivariate test for the detection of a systematic change in mean. J. Am. Stat. Assoc. 73(363):640-645. https://doi.org/10.1080/01621459.1978.10480070. [ Links ]
Martínez-Austria, P. y Patiño-Gómez, C. 2012. Efectos del cambio climático en la disponibilidad de agua en México El cambio climático. Tecnología y ciencias del agua . 3(1):5-20. [ Links ]
Ojeda-Bustamante, W.; Hernández, B. L. y Sánchez, C. I. 2008. Tecnificación del riego. In: manual para diseño de zonas de riego pequeñas. Ed. Instituto Mexicano de Tecnología del Agua. México. Capítulo 1:15-44. [ Links ]
Ojeda-Bustamante, W.; Sitafuentes-Ibarra, E.; González-Camacho, J. M. y Guillen-González, J. A. y Unland-Weiss, H. 1999. Pronóstico del riego en tiempo real. Instituto Mexicano de Tecnología del Agua. México, DF. 17-80. [ Links ]
Perry, C.; Steduto, P.; Allen, R. G. and Burt, C. M. 2009. Increasing productivity in irrigated agriculture: agronomic constraints and hydrological realities. Agricultural Water Management. 96(11):1517-1524. https://doi.org/10.1016/j.agwat.2009.05.005. [ Links ]
Ramírez-Cabral, N.; Medina-García, G. and Kumar, L. 2020. Increase of the number of broods of fall armyworm (Spodoptera frugiperda) as an indicator of global warming. Rev. Chapingo Ser. Zonas Áridas. 19(1):1-16. https://doi.org/10.5154/r.rchsza.2020.11.01. [ Links ]
Rodionov, S. 2004. A sequential algorithm for testing climate regime shifts. Geophysical Research Letters. 31(9):2-5. Doi: 10.1029/2004GL019448. [ Links ]
Rodionov, S. 2005. A brief overview of the regime shift detection methods. Joint Institute for the Study of the Atmosphere and Ocean, University of Washington, Seattle, WA 98195, USA. 17-24. https://www.beringclimate.noaa.gov/regimes/rodionov-overview.pdf. [ Links ]
Rodionov, S. 2006. Help with regime shift detection software. Retrieved from. https://www.beringclimate.noaa.gov/regimes/help3.html. [ Links ]
Rodionov, S. and Overland, J. 2005. Application of a sequential regime shift detection method to the Bering Sea ecosystem. J. Marine Sci. 62(3):328-332. Doi: 10.1016/j.icesjms.2005.01.013. [ Links ]
SADER-SIAP. 2020. Secretaría de Agricultura y Desarrollo Rural y Servicio de Información Agroalimentaria y Pesquera. Panorama Agroalimentario. Publicaciones SIAP. 90-92 pp. https://nube.siap.gob.mx/gobmx-publicaciones-siap/pag/2020/Atlas-Agroalimentario-2020. [ Links ]
Serna, L. 2022. Maize stomatal responses against the climate change. Frontiers in Plant Science. 13:01-09. https://doi.org/10.3389/fpls.2022.952146. [ Links ]
SMN. 2021. Servicio Meteorológico Nacional. Información estadística climatológica. https://smn.conagua.gob.mx/es/climatologia/informacion-climatologica/informacion-estadistica-climatologica. [ Links ]
Soares, M. D.; Peña A. y García, M. E. 2018. Una aproximación al marco conceptual, institucional y normativo relativo al cambio climático. In: Soares, M. D. y Peña, A. Ed. Impacto del cambio climático para la gestión integral de la cuenca hidrológica del río Apatlaco. Instituto Mexicano de Tecnología del Agua. 28-39 pp. [ Links ]
Tayanç, M.; Nüzhet, D. H.; Karaca, M. and Yenigün, O. 1998. A comparative assessment of different methods for detecting inhomogeneities in Turkish temperature data set. Inter. J. Climatol . 18(5):561-578. Doi: 10.1002/(sici)1097-0088(199804)18:5<561:aid-joc249>3.0.co;2-y. [ Links ]
Trenberth, K. E. and Asrar, G. R. 2014. Challenges and opportunities in water cycle research: WCRP contributions. Surv Geophys. 35:515-532. https://doi.org/10.1007/s107 12-012-9214-y. [ Links ]
Trenberth, K. E. and Fasullo, J. T. 2012. Tracking earth’s energy: from El Niño to global warming. Surv Geophys . 33(1):413-426. https://doi.org/10.1007/s10712-011-9150-2. [ Links ]
Trenberth, K. E.; Fasullo, J. T. and Balmaseda, M. A. 2014. Earth’s energy imbalance. J. Climate. 27(9):3129-3144. https://doi.org/10.1175/JCLI-D-13-00294.1. [ Links ]
Utset, A. and Martínez-Cob, A. 2003. Estimación del posible efecto del cambio climático en el balance hídrico del maíz cultivado en una llanura mediterránea. Estudio de la zona no saturada del suelo. 305-312 pp. [ Links ]
Wilhite, D. A. and Glantz, M. H. 1985. Understanding: the drought phenomenon: the role of definitions. Water International. 10(3):111-120. [ Links ]
Woznicki, S. A.; Nejadhashemi, A. P. and Parsinejad, M. 2015. Climate change and irrigation demand: Uncertainty and adaptation. Journal of Hydrology: Regional Studies. 3(1):247-264. ISSN 2214-5818. https://doi.org/10.1016/j.ejrh.2014.12.003. [ Links ]
Received: January 01, 2023; Accepted: March 01, 2023
 Este es un artículo publicado en acceso abierto bajo una licencia
Creative Commons
Este es un artículo publicado en acceso abierto bajo una licencia
Creative Commons
