


Serviços Personalizados
Journal
Artigo
 texto em
  Inglês (pdf)
 Artigo em XML
 Referências do artigo
 Enviar este artigo por email
Indicadores
-
 Citado por SciELO
 -
 Acessos
Links relacionados
-
 Similares em
SciELO
Similares em
SciELO
Compartilhar

 Permalink
Revista mexicana de ciencias agrícolas
versão impressa ISSN 2007-0934
Rev. Mex. Cienc. Agríc vol.14 no.3 Texcoco Abr./Mai. 2023 Epub 19-Jun-2023
https://doi.org/10.29312/remexca.v14i3.3091
Articles
Selection of corn populations based on early biomass production under saline stress conditions
1Maestría en Ciencias en Fitomejoramiento. Universidad Autónoma Agraria Antonio Narro
2Centro de Capacitación y Desarrollo en Tecnología de Semillas. Universidad Autónoma Agraria Antonio Narro
3Departamento de Horticultura-Universidad Autónoma Agraria Antonio Narro. Calzada Antonio Narro 1923, Buenavista, Saltillo, Coahuila, México. CP. 25315. (ulises.felix.lizarraga@gmail.com; frincon@uaaan.edu.mx; frajavsanram@gmail.com; fborregoe9@gmail.com; abenmen@gmail.com).
Native corn populations have attributes that differentiate them because of their area of adaptation to adverse biotic and abiotic conditions that can be used in selection schemes. The objectives of the present research were to analyze dry matter production in early stages of development and selection of corn populations under conditions of salinity stress. One hundred eighteen corn populations of the Ratón race and two controls (hybrids) were evaluated in trials conducted in greenhouse in two contrasting environments in 2021 (with and without saline stress). Dry root weight, dry stem weight and chlorophyll content were determined. In the environments, statistical differences were found in dry stem weight (p≤ 0.01) and chlorophyll content (p≤ 0.05), while in DRW there was no difference. In the genotypes (populations and controls) statistical differences (p≤ 0.01) were found for the variables of dry weight, except in the chlorophyll content. There was no evidence of interaction of genotypes × environments in any of the variables studied. Saline stress conditions had an effect relative to non-stress conditions with a reduction of 25.9% in DRW and of 47.5% in dry stem weight. It is determined that there is genetic variation in the studied populations of the Ratón race for dry root weight and dry stem weight with an estimate of broad-sense heritability of 0.6 and 0.62, respectively, which allows selection of genotypes in the early stage of development. Of the 25 superior genotypes, 10 were identified in the favorable environment (control), six in the stress (salinity tolerant) environment and nine with an average behavior across environments.
Keywords: Zea mays L.; genetic diversity; ratón race; salinity stress
Las poblaciones nativas de maíz cuentan con atributos que las diferencian por su área de adaptación a condiciones bióticas y abióticas adversas que pueden usarse en esquemas de selección. Los objetivos de la presente investigación fueron analizar la producción de materia seca en etapas tempranas de desarrollo y selección de poblaciones de maíz bajo condiciones de estrés por salinidad. Se evaluaron 118 poblaciones de maíz de la raza Ratón y dos testigos (híbridos) en ensayos realizados en invernadero en dos ambientes contrastantes en 2021 (con y sin estrés salina). Se determinó el peso seco de raíz, peso seco de vástago y el contenido de clorofila. En los ambientes se encontraron diferencias estadísticas en peso seco de vástago (p≤ 0.01) y el contenido de clorofila (p≤ 0.05), en tanto que en PSR no hubo diferencia. En los genotipos (poblaciones y testigos) se encontraron diferencias estadísticas (p≤ 0.01) para las variables de peso seco, excepto en el contenido de clorofila. No hubo evidencia de interacción de genotipos × ambientes en ninguna de las variables estudiadas. Las condiciones de estrés salino tuvieron un efecto en relación con las condiciones sin estrés con una reducción de 25.9% en PSR y 47.5% en peso seco de vástago. Se determina que existe variación genética en las poblaciones estudiadas de la raza Ratón para el peso seco de raíz y peso seco de vástago con una estimación de heredabilidad en sentido amplio de 0.6 y 0.62, respectivamente, lo que permite realizar selección de genotipos en la etapa temprana de desarrollo. De los 25 genotipos superiores se identificaron 10 en el ambiente favorable (testigo), seis en el ambiente de estrés (tolerantes a salinidad) y nueve con un comportamiento promedio a través de ambientes.
Palabras clave: Zea mays L.; diversidad genética; estrés por salinidad; raza ratón
Introduction
Currently, agriculture faces modifications to the environment due to the effect of climate change, which, in particular, modifies temperature, radiation and rainfall, which negatively affect production (Arce-Romero et al., 2018). It is considered that an alternative to mitigate the effects of climate change is the use of genetic diversity of native varieties, because they are adapted to adverse conditions, and commonly face various types of stress, caused by biotic and abiotic factors (Rincón-Sánchez and Ruiz-Torres, 2017).
In the development of improved varieties to increase yield potential, productivity and adaptation to environmental conditions, it is necessary to identify sources of genetic variation to be incorporated into the selection processes. Native corns have genetic information of agronomic importance, such as the ability to adapt to adverse conditions, precocity, yield potential and stability in different environments, which can be used in genetic improvement programs (González-Martínez et al., 2020). In addition to agronomic evaluation, an alternative is required to identify germplasm with potential under stress conditions, Farooq et al. (2015) propose to carry out trials where genotypes are subjected to salinity conditions.
In a study of the response of the root system in corn to drought stress conditions, Li et al. (2015) report genetic variation of the root, which can be used as a selection criterion in the seedling stage. In corn, massive tests can be performed to identify salinity-tolerant genotypes based on seedling weight and growth rate under saline stress conditions (Farooq et al., 2015). In trials conducted during the early stages of growth in corn, Khan et al. (2003) found that root growth as a function of salt concentrations is useful for preliminary selection of salinity-tolerant genotypes.
Likewise, a good development of the root system in the emergence and early stage of development is of great importance so that the corn crop can be established under conditions of water stress (Leach et al., 2011). The objectives of the present research were to analyze dry matter production in early stages of development and selection of corn populations under conditions of salinity stress. The work was carried out under the assumptions that in corn populations there is genetic variation and differential response in the production of dry matter that can be used as an early selection criterion.
Materials and methods
The genetic material consisted of 118 populations of corn classified as Ratón race from the states of Coahuila (83), Nuevo León (20) and Tamaulipas (15), sheltered in the Northern Region Center for the Conservation of Orthodox Seeds (CCSONorte, for its acronym in Spanish), located at the Antonio Narro Autonomous Agrarian University (UAAAN, for its acronym in Spanish). Two commercial hybrids were included as controls in the experiment: Rx715 of Asgrow and 6818 of Syngenta. The trial was established in greenhouse number two of UAAAN, Saltillo, Coahuila, Mexico. The greenhouse has passive temperature control, which was recorded every four hours using a Hobo® data logger. The average temperature recorded during the development of the experiment was 26.5 and 18.7 °C and average relative humidity of 54.1 and 70.4%, during the day and night, respectively.
The study was conducted in two contrasting environments with and without salinity stress. In the trial, 120 genotypes (118 populations and two controls) were established in the months of June, July and August 2021, under the experimental design of divided plots in randomized complete blocks with four repetitions, where large plot A were the environments (with/without salt) and small plot B, genotypes. For reasons of handling of the experimental material and data collection, each block was established on different sowing dates, with a separation of one week and a duration of the experiment of five weeks from the date of sowing.
The experimental unit (EU) consisted of 6 x 20 cm black polyethylene pots, with a substrate composed of Peat-Moss, Perlite and Vermiculite in a 2:1:1 ratio, respectively. Three seeds per pot were sown three centimeters deep and one plant was removed after the emergence, leaving only two plants per EU, without additional fertilization. The irrigations for the stress environment consisted of a saline solution based on NaCl (18.57 mS cm-1) and application of distilled water to the environment without stress. In each case, 100 ml per pot was applied with an irrigation interval of seven days. To support the plants in the germination and emergence stage, a supplemental irrigation was applied on the third day after sowing.
After each irrigation, electrical conductivity readings were made directly on the substrate, with the Hanna HI993310® portable soil conductivity meter. At the end of the trial, the chlorophyll content (CLO) was estimated in SPAD units (Chlorophyll Relative Content Index) using a Konica Minolta SPAD 501 portable meter (Konica Minolta Inc, 2009). The sample was made on the last ligulate leaf of a plant of the experimental unit and three readings were made, recording the average value. After five weeks after sowing, the roots were carefully removed from the substrate.
Each plant was sectioned into two parts (root and stem) and then they were placed in brown paper bags to subject them to drying in an oven at 70 °C for 48 h. The samples were then weighed on an AMD HR-200 analytical balance and the result was expressed as dry root weight (DRW) and dry stem weight (DSW) in mg plant-1.
Analysis of variance according to the experimental design used and a Tukey multiple comparison of means (p≤ 0.05) were performed with the PROC GLM procedure of SAS (SAS Institute Inc, 2018). The mean value of total dry weight (TDW) was computed with the fractions of dry root weight (DRW) and dry stem weight (DSW). With the mean values, a Pearson simple correlation analysis was performed with the PROC CORR procedure of SAS (SAS Institute Inc, 2018). Environments, genotypes and the genotype x environment interaction were considered as fixed effects, the rest of the effects in the model as random. A decision value was calculated to identify superior genotypes, defined by the mean plus one and twice the standard error of the mean (𝜇 + ɛɛ; 𝜇 + 2ɛɛ).
Finally, a random model was used to estimate the variance components with the PROC MIXED procedure of SAS (SAS Institute Inc, 2018). With the variance components, the average coefficient of genetic determination or broad-sense heritability was estimated for the traits under study (Hallauer et al., 2010). The means of genotypes x traits in environments were used to perform the graphical dispersion analysis of these, based on the principal component analysis (PCA), which was obtained with the GGEbiplot model (Yan, 2014).
Results and discussion
The mean squares of the analysis of variance and the estimation of the variance components for the traits dry root weight (DRW), dry stem weight (DSW) and chlorophyll content (CLO) obtained in the trials in greenhouse in 2021 are shown in (Table 1).
Table 1 Mean squares and variance components of dry matter production in the trials in greenhouse, in 2021.
| SV | DF | Dry root weight (mg plant-1) | Dry stem weight (mg plant-1) | Chlorophyll content(SPAD) | |||||
| MS | 𝜎 2 | MS | 𝜎 2 | MS | 𝜎 2 | ||||
| Blocks (BLO) | 3 | 55 258.4 | 0 | 424 974.9 | 0 | 2 075.8 | 6.3 | ||
| Environments (ENV) | 1 | 447 912.7 | 732.1 | 17 893 944.1** | 36 409 | 10 881* | 21.5 | ||
| BLO × ENV | 3 | 135 315.3** | 775.8 | 475 056.7** | 3 652.3 | 589.5** | 4.8 | ||
| Genotypes (GEN) | 119 | 5 293.1** | 397.7 | 40 057.8** | 3 150.6 | 11 | 0 | ||
| ENV × GEN | 119 | 2 143.7 | 78.8 | 15 098.2 | 295 | 12.4 | 0 | ||
| Error | 712 | 1 826.6 | 1 827.9 | 13 994.1 | 13 989 | 11.8 | 11.8 | ||
| CV (%) | 29.6 | 27 | 11.7 | ||||||
| H2 | 0.6 | 0.62 | 0 | ||||||
*, **, Significant at probability levels of 0.05 and 0.01, respectively; SV= sources of variation; DF= degrees of freedom; MS= mean squares; CV= coefficient of variation; H2= coefficient of genetic determination or broad-sense heritability.
In the evaluation environments (with and without saline application), statistical differences were found in DSW and CLO, while in DRW there was no evidence of statistical differences. In the genotypes (GEN) (populations and controls), statistical differences were found (p≤ 0.01) for the dry weight variables, except in CLO, which is due to the variation existing in the experimental material under study. No statistical differences were found in the interaction of genotypes × environments in any of the variables under study, which indicates that the genotypes showed similar behavior in the two evaluation environments.
Considering that no fertilization was applied in the trial, Bänziger et al. (2012) share a point of view that allows analyzing the phenomenon of the root-stem relationship and mention that nitrogen is the nutrient that the plant requires in larger quantities and it is closely related to the production of vegetative biomass and chlorophyll content; in addition, they mention that under conditions of nitrogen-deficiency stress, plants favor root growth more than stem growth and, consequently, the root:stem ratio increases.
Table 2 presents the mean values of the evaluation environments (with and without salt), identified as the stress conditions and control, respectively, that represent the trials carried out in greenhouse for the variables under study. According to this, saline stress conditions (stress) had an effect on DRW and DSW with respect to non-stress conditions (control), which manifested itself in a reduction of 25.9 and 47.5%, respectively. In the case of chlorophyll content (CLO), the answer was the opposite since an average increase of 26% was found in the stress conditions with respect to the control. This is because the materials that were not exposed to salt showed a greater production of biomass, which caused a depletion of nutrients, because they never received any type of fertilization.
Table 2 Means of the evaluation environments for the study variables in trials in greenhouse in 2021.
| Environments | Dry root weight (mg plant-1) | Dry stem weight (mg plant-1) | Chlorophyll content (SPAD) |
| Control (without salt) | 165.6 a† | 574.66 a | 25.99 b |
| Stress (with salt) | 122.7 a | 301.75 b | 32.74 a |
| Mean | 144.15 | 438.21 | 29.36 |
| Tukey (α= 0.05) | 75.65 | 141.74 | 5 |
†= values with the same letter in the column are not statistically different.
In this regard, Correndo and García (2012) mention that there is a phenomenon where the increase in dry matter production causes a dilution of nutrients in the tissues when there is no contribution of nutrients. During the development of the experiment, under the conditions of saline stress, corn plants were exposed to an average electrical conductivity of 3.45 mS cm-1, with an amplitude between blocks (sowing dates) of 3.13 to 3.88 mS cm-1. Leland and Mass (1999) mentioned that the corn crop begins to be affected when electrical conductivities are higher than 1.7 mS cm-1. The root is the first organ exposed to saline stress, subsequent shoots are more sensitive in the response and expression in relation to the roots in the corn crop (Iqbal et al., 2020).
The coefficient of genetic determination or broad-sense heritability (fraction of phenotypic variance due to additive and dominance genetic effects) (Falconer and Mackay, 1996) highlights the importance of genotypes in relation to phenotypic differences for a trait of interest in the selection process. In this study, the coefficient of broad-sense heritability was estimated, obtaining values of 0.6 and 0.62 for the traits dry root weight (DRW) and dry stem weight (DSW), respectively.
In the case of chlorophyll (CLO) content, most of the variation was due to environmental effects in relation to genetic effects, so this trait, under the conditions of the present study, is not useful for selection purposes at the early stage of development. In a study of hybrid vigor for drought tolerance, Ali et al. (2013) report heritability values of 0.9 for dry root weight and 0.76 for dry stem weight. Also, in the evaluation of four corn genotypes for drought tolerance, Haseeb et al. (2020) report heritabilities of 0.89 and 0.9 for dry root weight and dry stem weight, respectively. However, in the evaluation of inbred lines under water stress conditions, Masood et al. (2020) report heritability values for DRW and DSW of 0.49 and 0.47, and 0.34 and 0.46 for normal and stress environment conditions, respectively.
In the evaluation of inbred corn lines under different nitrogen levels, Abdel-Ghani et al. (2013) report estimated heritability values of 89.6 and 0.83 for dry root weight and dry stem weight, respectively. Analysis of the results in the present study indicates the importance of the traits of DRW and DSW in the selection of corn genotypes at early stages of development. Due to the absence of genotype × environment interaction, the mean value of total dry weight (TDW) was computed with the fractions of dry root weight (DRW) and dry stem weight (DSW). With the mean values of DRW, DSW and chlorophyll content (CLO) in the evaluation environments, a Pearson simple correlation analysis was performed. The TDW correlated positively and significantly (p≤ 0.01) with the fractions DRW and DSW in the contrasting environmental conditions (salinity stress and control).
However, no association was found between the traits of dry weight with CLO in the two evaluation environments. The associations between the traits under study are shown graphically later in Figure 1. Table 3 presents the means of dry weight of the 25 superior genotypes identified based on the dry weight of the plant in the trials in greenhouse in 2021.
Table 3 Means of the 25 superior corn genotypes based on dry plant weight in trials in greenhouse, 2021.
| Genotypes | Groups‡ | TDW | DRW-S | DSW-S | DRW-C | DSW-C | |||||
| Populations† | |||||||||||
| C-25 | C | 762.06 | ** | 147.13 | * | 440.13 | ** | 190.63 | 746.25 | ** | |
| C-14 | A | 739.94 | ** | 113.75 | 297.88 | 265.63 | ** | 802.63 | ** | ||
| C-77 | A | 726.44 | ** | 105.88 | 374 | * | 220 | * | 753 | ** | |
| C-79 | A | 726.06 | ** | 152 | * | 324.5 | 203.38 | * | 772.25 | ** | |
| C-55 | A | 724.5 | ** | 117.75 | 308.75 | 202.88 | * | 819.63 | ** | ||
| C-8 | B | 704.94 | ** | 180 | ** | 417.75 | ** | 182.13 | 630 | ||
| C-23 | C | 703.81 | ** | 96.5 | 307 | 239.38 | ** | 764.75 | ** | ||
| T-106 | C | 698.19 | ** | 153.5 | * | 401.13 | * | 170 | 671.75 | * | |
| C-17 | A | 696.75 | ** | 143.25 | 341.13 | 166 | 743.13 | ** | |||
| C-19 | B | 696.25 | ** | 165.88 | ** | 386.5 | * | 199.5 | * | 640.63 | |
| N-36 | A | 695.94 | ** | 111.38 | 346 | 207.13 | * | 727.38 | * | ||
| C-24 | B | 692.31 | * | 167.5 | ** | 477.5 | ** | 172.75 | 566.88 | ||
| N-50 | A | 692.19 | * | 156 | * | 302.38 | 183.75 | 742.25 | ** | ||
| T-103 | A | 691 | * | 162.63 | * | 403.38 | * | 234.5 | ** | 581.5 | |
| T-104 | B | 686.13 | * | 194 | ** | 363.13 | * | 182.88 | 632.25 | ||
| C-4 | C | 679.56 | * | 152.75 | * | 376.75 | * | 185.38 | 644.25 | ||
| C-11 | A | 678.94 | * | 123.63 | 300.88 | 178.13 | 755.25 | ** | |||
| T-99 | C | 677.19 | * | 170.38 | ** | 360.13 | * | 228.88 | ** | 595 | |
| N-42 | C | 676.88 | * | 114.13 | 364.13 | * | 185.25 | 690.25 | * | ||
| C-16 | C | 676.75 | * | 126.38 | 405.75 | ** | 180 | 641.38 | |||
| C-30 | C | 676.5 | * | 123.25 | 360.38 | * | 196.13 | * | 673.25 | * | |
| C-21 | B | 674.19 | * | 145.63 | * | 368.13 | * | 187.38 | 647.25 | ||
| C-31 | C | 671.06 | * | 144.63 | * | 381.5 | * | 190.13 | 625.88 | ||
| T-109 | B | 669.75 | * | 136.5 | 387.5 | * | 180.25 | 635.25 | |||
| C-29 | A | 669.38 | * | 119.25 | 292 | 241.13 | ** | 686.38 | * | ||
| Controls | |||||||||||
| 6818 | 549.31 | 131.13 | 288.25 | 157.5 | 521.75 | ||||||
| Rx715 | 296.25 | 54.25 | 112.63 | 95.88 | 329.75 | ||||||
| Means | 581.92 | 122.49 | 301.29 | 165.6 | 574.66 | ||||||
| EE | 55.9 | 21.64 | 52.12 | 28.92 | 78.19 | ||||||
*, **= selection based on μ+SE and μ+2SE, respectively; TDW, DRW and DSW= total dry weight, dry root weight and dry stem weight in mg plant-1; CLO= chlorophyll content; S and C, salinity stress and control (without salt); † the first digit indicates the origin: C= Coahuila, N= Nuevo León, T= Tamaulipas, followed by the entry number; ‡groups: A= selection in a favorable environment; B= selection under stress conditions; C= average selection; SE= standard error of the mean.
In the total average production of dry matter (TDW), variation was found between the genotypes evaluated, with an amplitude of 296.25 to 762.06, with a mean of 581.92 mg plant-1, so it is feasible to perform selection (Table 3). Table 3 only presents the mean values of the 25 superior genotypes; where in particular, the variation of these can be elucidated, based on the fractions of dry weight of root (DRW) and stem (DSW) in the evaluation environments (conditions of saline stress and control).
It is important to highlight that, of the 120 genotypes used, only the populations of the Ratón race stand out for their behavior in DRW and DSW; that is, none of the controls (hybrids) used showed significant dry matter production in TDW or expression under contrasting environmental conditions. The analysis of the behavior of genotypes in the evaluation environments and the association of the traits is presented graphically (Figure 1), to explore the interaction of genotypes × traits in environments, obtained from the principal component analysis using the GGEbiplot model (Yan, 2014).
Figure 1 considers the first two principal components (PC1 and PC2), which together explain 66.6% of the total accumulated variation in the mean values of the genotypes and the traits × evaluation environments. In the graphic dispersion model GGEbiplot, the interaction of factors is analyzed, in this case, the traits in the evaluation environments are used as testers of the genotypes under study, therefore, the interaction of genotypes × traits in environments is analyzed.
In Figure 1, the cosine of the angle formed by the vectors of the combination of traits in environments that are produced from the origin approximates the correlation coefficient between them, an angle less than 30º indicates a very close relationship, while an angle of approximately 90º, an independent relationship, an angle of 180º will be representing a negative association (Yan, 2014). Similarly, each genotype projects a vector from the origin and, therefore, the relationship with the traits will depend on the location in the quadrant.
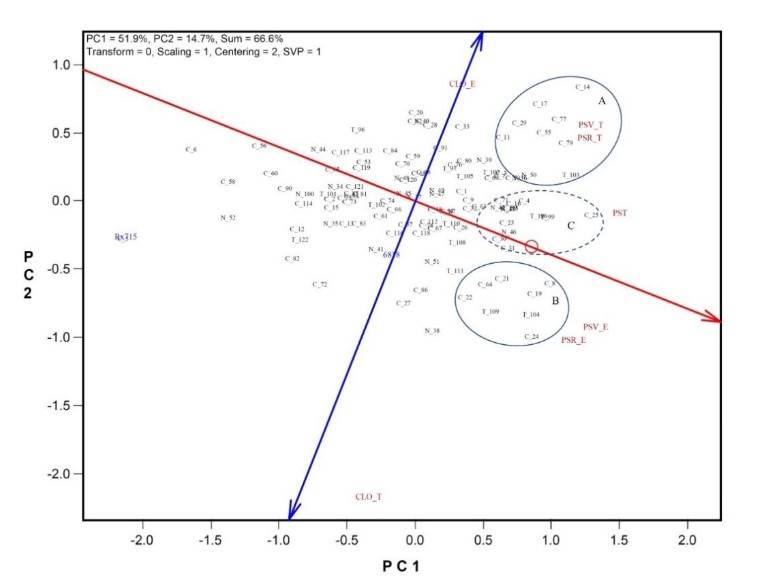
Figure 1 Graphic dispersion of the interaction of genotypes × traits in environments. PSR= dry root weight (DRW); PSV= dry stem weight (DSW); CLO= chlorophyll content; PST= total dry weight (TDW) of plant; E and T, stress conditions and control, respectively; PC1, PC2 = first and second principal component; in genotypes, the first digit indicates the origin: C= Coahuila, N= Nuevo León, T= Tamaulipas, followed by the entry number; groups: A= selection in a favorable environment, B= selection under stress conditions; C= average selection.
According to the projection and angles of the vectors, the traits of dry weight are positively correlated (DRW and DSW), with a very close association within each of the environments. In this sense, the relationship of chlorophyll content (CLO) with DRW and DSW in environments is relatively low, and with TDW, an independent correlation. On the abscissa axis (PC1) of Figure 1, the means of the dry weight of the genotypes are graphically projected with the amplitude indicated in (Table 3), where Rx715 obtained the minimum value of 296.25 mg plant-1 and the genotype C-25 the maximum value of 762.06 mg plant-1.
In the case of the ordinate axis (PC2), it represents the interaction of genotypes with traits in environments, which, according to the GGEbiplot interaction model, experiences an inclination for interpretation purposes. The wide dispersion of genotypes can be elucidated in Figure 1, as an interpretation of their genetic variation with dry matter production represented by the traits of this study. Likewise, Figure 1 is useful since it is possible to identify genotypes with particular characteristics according to the patterns of variation in the study.
In this way, it is possible to identify the genotypes outstanding in the favorable environment (control) identified as group A, those outstanding in the environment of salinity stress (group B), and the genotypes with an average behavior across environments, identified with group C. Therefore, of the 25 superior genotypes (Table 3), 10 were identified in the favorable environment (control), six in the stress environment (salinity tolerant) and nine with average behavior across the evaluation environments.
Dry root weight (DRW) and dry stem weight (DSW) with and without salinity stress were considered in the early evaluation to determine differences in physiological potential and as an alternative as a selection criterion in the corn crop with salinity tolerance, as has been pointed out by several authors (Giaveno et al., 2007; Marcos-Filho, 2015). These traits have been studied to identify genotypes under drought stress conditions (Li et al., 2015) and with salinity tolerance (Khan et al., 2003; Farooq et al., 2015), which have been suggested to be used as selection criteria in early stages of development in corn.
Conclusions
It is determined that there is genetic variation in the studied populations of the Ratón race for the dry weight of root and stem, with an estimate of broad-sense heritability of 0.6 and 0.62, respectively, which allows selection of genotypes in the early stage of development. Of the 25 superior genotypes, 10 were identified in the favorable environment (control), six in the stress environment (salinity tolerant) and nine with an average behavior across environments.
Literatura citada
Abdel-Ghani, A. H.; Kumar, B.; Reyes-Matamoros, J.; González-Portilla, P. J.; Jansen, C.; San Martin, J. P.; Lee, M. and Lübberstedt, T. 2013. Genotypic variation and relationships between seedling and adult plant traits in maize (Zea mays L.) inbred lines grown under contrasting nitrogen levels. Euphytica. 189(1):123-133. [ Links ]
Ali, Q.; Muhammad, A.; Ali, F.; Muhammad, S.; Manzoor, M.; Khan, N. H.; Basra, S. M. A. and Mustafa, H. S. B. 2013. Genetic advance, heritability, correlation, heterosis and heterobeltiosis for morphological traits of maize (Zea mays L). Albanian J. Agric. Sci. 12(4):689-698. [ Links ]
Arce-Romero, A. R.; Monterroso-Rivas, A. I.; Gómez-Diaz, J. D. and Palacios-Mendoza, M. A. 2018. Potential yields of maize and barley with climate change scenarios and adaptive actions in two sites in Mexico. In: advances in information and communication technologies for adapting agriculture to climate change. Angelov, P.; Iglesia, J. A. and Corrales, J. C. Ed. Advances in Intelligent Systems and Computing. 687(1):197-208. Doi.org/10.1007/978-3-319-70187-5-15. [ Links ]
Bänziger, M.; Edmeades, G. O.; Beck, D. L. y Bellon, M. R. 2012. Mejoramiento para aumentar la tolerancia a sequía y a deficiencia de nitrógeno en el maíz: de la teoría a la práctica. Centro Internacional de Maíz y Trigo (CIMMYT) . El Batán, Estado de México, DF. 61 p. [ Links ]
Correndo, A. A. y García, F. O. 2012. Concentración de nutrientes en planta como herramienta de diagnóstico: cultivos extensivos. Archivo Agronómico. 14(1):1-8. [ Links ]
Falconer, D. S. and Mackay, T. F. C. 1996. Introduction to Quantitative Genetics. 4th . Ed. Longman, Harlow, England. 464 p. [ Links ]
Farooq, M.; Hussain, M.; Wakeel, A. and Siddique, K. H. M. 2015. Salt stress in maize: effects, resistance mechanisms, and management. A review. Agron. Sustain. Dev. 35(2):461-481. Doi: 10.1007/s13593-015-0287-0. [ Links ]
Giaveno, C. D. R.; Vasconcelos, R. G.; Maia, S. and Ferraz, O. R. 2007. Screening of tropical maize for salt stress tolerance. Crop Breed. Appl. Biotechnol. 7(3):304-313. Doi: 10.12702/1984-7033.v07n03a10. [ Links ]
González-Martínez, J.; Rocandio-Rodríguez, M.; Contreras-Toledo, A. R.; Joaquín-Cancino, S.; Vanoye-Eligio, V.; Chacón-Hernández, J. C. y Hernández-Bautista, A. 2020. Diversidad morfológica y agronómica de maíces nativos del altiplano de Tamaulipas, México. Rev. Fitotec. Mex. 43(4):361-370. [ Links ]
Hallauer, A. R.; Carena, M. J. and Miranda, F. J. B. 2010. Quantitative genetics in maize breeding. Handbook of Plant Breeding Vol. 6. Third edition. 89 p. Springer Science and Business Media, LLC . New York. Doi:10.1007/978-1-4419-0766-0. [ Links ]
Haseeb, A.; Nawaz, A.; Rao, M. Q. A.; Ali, Q. and Malik, A. 2020. Genetic variability and association among seedling traits of Zea mays under drought stress conditions. Biol. Clin. Sci. Res. J. 20(1):1-5. Doi: https://doi.org/10.54112/bcsrj.v2020i1.20. [ Links ]
Iqbal, S.; Hussain, S.; Abdul, Q. M.; Ashraf, M. and Saifullah, S. 2020. The response of maize physiology under salinity stress and its coping strategies. In: Plant Stress Physiology. Hossain, A. Ed. IntechOpen. 1-25 pp. Doi: http://dx.doi.org/10.5772/intechopen.92213. [ Links ]
Khan, A. A.; Ali, R. S. and McNeilly, T. 2003. Assessment of salinity tolerance based upon seedling root growth response functions in maize (Zea mays L.). Euphytica . 131(3):81-89. Doi:10.1023/A:1023054706489. [ Links ]
Konica Minolta Inc. 2009. A lightweight handheld meter for measuring the chlorophyll content of leaves without causing damage to plants. Chlorophyll meter Spad-502plus. https://www.konicaminolta.com/instruments/download/catalog/color/pdf/spad502plus-catalog-eng.pdf . [ Links ]
Leach, K. A.; Hejlek, L. G.; Hearne, L. B.; Nguyen, H. T.; Sharp, R. E. and Davis, G. L. 2011. Primary root elongation rate and abscisic acid levels of maize in response to water stress. Crop Sci. 51(1):157-172. Doi: 10.2135/cropsci2009.12.0708. [ Links ]
Leland, E. F. and Maas, V. E. 1999. Crop response and management of salt-affected soils. In: handbook of plant and crop stress, second edition. M. Pessarakli. 169-201 pp. [ Links ]
Li, R.; Zeng, Y.; Xu, J.; Wang, Q.; Wu, F.; Cao, M.; Lan, H.; Lui, Y. and Lu, Y. 2015. Genetic variation for maize root architecture in response to drought stress at the seedling stage. Breed. Sci. 65(4):298-307. Doi:10.1270/jsbbs.65.298. [ Links ]
Marcos-Filho, J. 2015. Seed vigor testing: an overview of the past, present and future perspective. Scientia Agríc. 72(4):363-374. http://dx.doi.org/10.1590/0103-9016-2015-0007. [ Links ]
Masood, M.; Ahsan, M.; Sadaqat, H. A. and Awan, F. 2020. Screening of maize (Zea mays L.) inbred lines under water deficit conditions. Biol. Clin. Sci. Res. J. 7(1):1-6. Doi: https://doi.org/10.54112/bcsrj.v2020i1.7. [ Links ]
Rincon-Sanchez, F. and Ruiz-Torres, N. A. 2017. Genetic potential and usefulness of native maize populations in developing novel germplasm for current and upcoming goals. In: rediscovery of Landraces as a Resource for the Future. Grillo, O. Ed. IntechOpen. 97-111 pp. Doi: 10.5772/intechopen.71360. [ Links ]
SAS Institute Inc. 2018. SAS/STAT® 15.1 User’s Guide. Cary, NC. SAS Institute Inc., Cary, NC, USA. 4141 p. [ Links ]
Yan, W. 2014. Crop variety trials. Data management and analysis. John Wiley and Sons Inc., MA, USA. 351 p. [ Links ]
Received: February 01, 2023; Accepted: May 01, 2023
 Este es un artículo publicado en acceso abierto bajo una licencia Creative Commons
