


Serviços Personalizados
Journal
Artigo
 texto em
  Inglês (pdf)
 Artigo em XML
 Referências do artigo
 Enviar este artigo por email
Indicadores
-
 Citado por SciELO
 -
 Acessos
Links relacionados
-
 Similares em
SciELO
Similares em
SciELO
Compartilhar

 Permalink
Revista mexicana de ciencias agrícolas
versão impressa ISSN 2007-0934
Rev. Mex. Cienc. Agríc vol.14 no.1 Texcoco Jan./Fev. 2023 Epub 19-Jun-2023
https://doi.org/10.29312/remexca.v14i1.2966
Essays
Epidemiological behavior of Salmonella sp. in plant-based foods by intercontinental region
1Maestría en Ciencias Agropecuarias-Universidad Autónoma Metropolitana-Unidad Xochimilco. Calzada del Hueso 1100, Coyoacán, Ciudad de México, México. CP. 04960. (amyet96@hotmail.com).
2Departamento de Producción Agrícola y Animal-Universidad Autónoma Metropolitana-Unidad Xochimilco. Calzada del Hueso 1100, Coyoacán, Ciudad de México, México. CP. 04960. Tel. 55 44626217. (olivares@correo.xoc.uam.mx; mgutierrez@correo.xoc.uam.mx).
The epidemiological behavior and specific serotypes of Salmonella sp. in plant-based foods are represented by state, country, and intercontinental region. Histograms show incidences of outbreaks in the population of Africa, Europe and North America, spatial distribution of serotypes and the cumulative relative frequency curve. The foodborne diseases were due to Salmonella Infantis, S. Derby, S. Enteritidis, S. 1,4,[5],12:i:-, S. Agona, S. Panama, S. Typhi, S. Braenderup, S. Typhimurium, S. Newport, S. Saintpaul, S. Poona, S. Abony, S. Urbana, S. Adelaide and S. Uganda. On the African continent, the epidemiological behavior of S. enterica showed significant statistical differences (p≤ 0.0001), with cumulative prevalence for North Africa (49.9%), East Africa (12%), South Africa (3%), and West and Central Africa (13%), in contrast to the incidence observed for non-typhoid S. In Europe, the epidemiological behavior of Salmonella sp. by year of study showed statistically significant differences (p≤ 0.0001) in the observed incidence among 28 countries, also, the Fi of outbreaks of Salmonella sp. was higher in the last year. Between the United States and Mexican states, significant differences (p≤ 0.0001) were also observed in the incidence of the number of epidemiological outbreaks by year. However, as of 2019, a decrease in the epidemiological curve was observed. Among the regions of Africa, Europe and North America, the epidemiological behavior of Salmonella sp. presented incidences of 4.08, 30.82 and 65.1% respectively, due to the consumption of contaminated plant-based foods.
Keywords: cross-contamination; enterobacteria; foodborne disease; risk analysis
Se representa el comportamiento epidemiológico y los serotipos específicos de Salmonella sp., en alimentos de origen vegetal por estado, país y región intercontinental. Los histogramas muestran incidencias de brotes en la población de África, Europa y América del Norte, distribución espacial de los serotipos y la curva de frecuencia relativa acumulada. Las enfermedades transmitidas por alimentos se debieron a Salmonella Infantis, S. Derby, S. Enteritidis, S. 1,4,[5],12:i:-, S. Agona, S. Panama, S. Typhi, S. Braenderup, S. Typhimurium, S. Newport, S. Saintpaul, S. Poona, S. Abony, S. Urbana, S. Adelaide y S. Uganda. En el continente africano, el comportamiento epidemiológico de S. enterica mostró diferencias estadísticas significativas (p≤ 0.0001), con prevalencia acumulada para África del Norte (49.9%), África Oriental (12%), Sudáfrica (3%) y África Occidental y Central (13%), en contraste con la incidencia observada para S. no tifoidea. En Europa, el comportamiento epidemiológico de Salmonella sp., por año de estudio mostró diferencias estadísticamente significativas (p≤ 0.0001) en la incidencia observada entre 28 países, así como la Fi de brotes de Salmonella sp., fue mayor en el último año. Entre las entidades federativas de EE. UU y México, también se observaron diferencias significativas (p≤ 0.0001) en la incidencia del número de brotes epidemiológicos por año. Sin embargo, a partir de 2019 se observó disminución en la curva epidemiológica. Entre las regiones de África, Europa y América del Norte, el comportamiento epidemiológico de Salmonella sp. presentó incidencias de 4.08, 30.82 y 65.1% respectivamente, debido al consumo de alimentos contaminados de origen vegetal.
Palabras clave: análisis del riesgo; contaminación cruzada; enfermedades transmitidas por los alimentos; enterobacterias
Contamination of plant foods of agricultural origin
In 2014, the World Health Organization (WHO) defined foodborne diseases (FBDs) as a major public health problem in the world and the main index of mortality in infants under five years of age (1.5 million per year) in developing countries. Epidemiological outbreaks caused by FBDs in humans can be due to consumption of plant-based foods, contaminated with pathogenic bacteria transmitted during primary production, until the harvest of food (Hernández et al., 2011), due to incorrect use of water for irrigation, cross-contamination during harvest practices, vegetable washing process after harvest and food handling in packaging, transport and shelf life (ICMSF, 2005; Jung et al., 2014).
Also, due to the interaction of pathogenic microorganisms of the families Enterobacteriaceae and Vibrionaceae, Gram-negative bacteria, Staphylococcus sp., Gram-positive bacteria (Soto et al., 2016). The main genera and species are Vibrio sp., Campylobacter sp., Yersinia enterocolitica, Shigella flexneri, Listeria monocytogenes, Escherichia coli and Salmonella sp., the latter is the main precursor of FBDs in animals and humans (50%) (OMS, 2005; Betancor et al., 2006; Barreto et al., 2016; Andrews et al., 2021), which presents epidemiological impact in the world due to the effects on public health (Alam, 2014; Anderson et al., 2016; Soodb et al., 2018).
Epidemiological behavior and spatial distribution of Salmonella sp. by region
In 2021, the US. Food & Drug Administration (FDA) recognizes that gastroenteritis and typhoid fever have an epidemiological effect of global distribution and are periodically expressed in developed and developing countries (Andrews et al., 2021). Annually there are 153 million epidemiological outbreaks caused by Salmonella, 91.28% is transmitted by food and 8.72% due to an unknown cause. Fifty-seven thousand cases end in deaths from non-typhoid Salmonella (NTS) (Majowicz et al., 2010; Healy and Bruce, 2018). The severity caused by Salmonella sp., with respect to human infections, varies depending on the serotype involved which affects children under five years of age, the elderly (Nair et al., 2015) and immunosuppressed patients (Majowicz et al., 2010).
Distribution of Salmonella sp. in the African continent
In Africa, Salmonella sp. affects the public health of inhabitants by region (Majowicz et al., 2010; Reddy et al., 2010). From 1984 to 2006, human epidemiological outbreaks caused by Salmonella species were monitored among the five regions of the continent (Table 1). The epidemiological behavior of S. enterica in the regions of the continent showed significant statistical differences (p≤ 0.0001) in the cumulative prevalence in North Africa (49.9%), East Africa (12%), South Africa (3%) and West and Central Africa (13%) (Reddy et al., 2010).
The increase in outbreaks of S. enterica contamination among regions of the continent may be due to population growth, who demands food products without safety and hygiene measures, availability of drinking water, application of good agricultural practices to produce safe foods and viability of international trade to offer healthy foods (Mtove et al., 2010; FAO, 2017). In Algeria, Egypt, Jordan, Lebanon, Libya, Morocco, Iraq, Pakistan, Palestine, Saudi Arabia, Sudan, Tunisia, Oman, Palestine and the United Arab Emirates, percentages of S. Enteritidis (29.8%), S. Typhimurium (23.6%), S. Kentucky (20.3%) and other salmonella (26.3%) were detected (Al-Rifai et al., 2019). The incidence of Salmonella sp. was due to the percentage in salads and sandwiches (25%), fresh fruits and vegetables (5.8%), meat products, dairy, egg and seafood (69.2%) (Al-Rifai et al., 2019).
Table 1 Incidence of Salmonella sp. due to consumption of contaminated plant-based foods in the African continent from 1984 to 2006.
| Region | Serotype | No. of cases | Infected population | Incidence (%) |
| North Africa | S. enterica | 10 230 | 5 105 | 49.9 ±0.75 a |
| East Africa | 21 317 | 2 558 | 12 ±0.55 c | |
| South Africa | 23 893 | 717 | 3 ±0.25 d | |
| West and Central Africa | 5 887 | 765 | 13 ±0.8 b | |
| North Africa | S. no typhoid | 10 230 | 5 125 | 50.1 ±0.15 c |
| East Africa | 21 317 | 18 759 | 88 ±0.5 b | |
| South Africa | 23 893 | 23 176 | 97 ±0.5 a | |
| West and Central Africa | 5 887 | 5 122 | 87 ±0.5 b |
Levels not connected by the same letter are significantly different. Data extracted and analyzed from Reddy et al. (2010).
Status of Salmonella sp. in Europe
In 2017, the European Food Safety Authority (EFSA) and the European Centre for Disease Prevention and Control (ECDC) reported cases of Salmonella sp. infection, in 28 countries from 2012 to 2016 (94 278, 87 753, 92 012, 94 597 and 94 530, respectively) (Table 2) (EFSA and ECDC, 2017). By year, the incidence on the epidemiological behavior of Salmonella sp. among the countries of the continent showed significant statistical differences (p≤ 0.0001).
Table 2 Epidemiological behavior of Salmonella sp. due to consumption of contaminated plant-based foods among regions of the European continent.
| Country | Year/Incidence (%) | ||||
| 2012 | 2013 | 2014 | 2015 | 2016 | |
| Austria | 1.88 ±0.01 m | 1.6 ±0.1 m | 1.8 ±0.1 k | 1.63 ±0.01 l | 1.5 ±0.1 h |
| Belgium | 3.29 ±0.01 j | 2.88 ±0.01 k | 2.93 ±0.01 i | 3.35 ±0.01 i | 2.97 ±0.01 g |
| Bulgaria | 0.89 ±0.01 o | 0.87 ±0.01 q | 0.79 ±0.01 p | 1.14 ±0.01 n | 0.76 ±0.01 ij |
| Croatia | 0 ±0 w | 0 ±0 w | 1.62 ±0.01 m | 1.68 ±0.01 kl | 1.31 ±0.01 hi |
| Cyprus | 0.1 ±0.01 v | 0.09 ±0.01 vw | 0.1 ±0.01 t | 0.07 ±0.01 t | 0.08 ±0.01 k |
| Czech Republic | 10.67 ±0.01 b | 11.16 ±0.01b | 14.41 ±0.01 b | 13.12 ±0.01 b | 12.28 ±0.01 b |
| Denmark | 1.28 ±0.01 n | 1.3 ±0.1 o | 1.22 ±0.01 n | 0.98 ±0.01 o | 1.14 ±0.01 hi |
| Estonia | 0.26 ±0.01 t | 0.21 ±0.01 t | 0.1 ±0.01 t | 0.12 ±0.01 t | 0.37 ±0 jk |
| Finland | 2.34 ±0.01 l | 2.26 ±0.01 l | 1.76 ±0.01 kl | 1.74 ±0.01 k | 1.6 ±0.1 h |
| France | 9.23 ±0.01 d | 10.17 ±0.01 c | 9.65 ±0.01 c | 10.89 ±0.01 c | 9.39 ±0.01 d |
| Germany | 21.74 ±0.01 a | 21.31 ±0.01 a | 17.39 ±0.01 a | 14.45 ±0.01 a | 13.6 ±0.1 a |
| Greece | 0.43 ±0.01 r | 0.47 ±0.01 r | 0.38 ±0.01 r | 0.49 ±0.01 p | 0.78 ±0.01 ij |
| Hungary | 5.79 ±0.01 f | 5.64 ±0.01 g | 5.7 ±0.1 f | 5.17 ±0.01 g | 5 ±0.1 e |
| Ireland | 0.33 ±0.01 s | 0.37 ±0.01 s | 0.28 ±0.01 r | 0.29 ±0.01 s | 0.32 ±0.01 jk |
| Italy | 5.12 ±0.01 g | 5.75 ±0.01 f | 4.85 ±0.01 g | 4.04 ±0.01 h | 4.37 ±0.01 f |
| Latvia | 0.58 ±0.01 q | 0.44 ±0.01 rs | 0.3 ±0.1 r | 0.4 ±0.1 qr | 0.48 ±0.01 jk |
| Lithuania | 1.87 ±0.01 m | 1.37 ±0.01 o | 1.24 ±0.01 n | 1.14 ±0.01 n | 1.14 ±0.01 hi |
| Luxembourg | 0.14 ±0.01 uv | 0.14 ±0.01 tuv | 0.12 ±0.01 t | 0.11 ±0.01 t | 0.11 ±0.01 k |
| Malta | 0.09 ±0.01 v | 0.1 ±0.01 v | 0.14 ±0.01 st | 0.13 ±0.01 t | 0.17 ±0.01 jk |
| Holland | 2.33 ±0.01 l | 1.12 ±0.01 p | 1.05 ±0.01 o | 1.03 ±0.01 u | 1.22 ±0.01 hi |
| Poland | 8.44 ±0.01 e | 8.34 ±0.01 e | 8.74 ±0.01 d | 8.72 ±0.01 f | 10.28 ±0.01 c |
| Portugal | 0.2 ±0.01 tu | 0.19 ±0.01 tu | 0.27 ±0.01 rs | 0.34 ±0.01 rs | 0.4 ±0.1 jk |
| Romania | 0.74 ±0.01 p | 1.48 ±0.01 n | 1.64 ±0.01 lm | 1.41 ±0.01 m | 1.56 ±0.01 h |
| Slovakia | 4.91 ±0.01 h | 4.34 ±0.01 i | 4.43 ±0.01 h | 5.12 ±0.01 g | 5.61 ±0.01 e |
| Slovenia | 0.42 ±0.01 r | 0.36 ±0.01 s | 0.65 ±0.01 q | 0.42 ±0.01 q | 0.33 ±0.01 jk |
| Spain | 4.48 ±0.01 i | 5.17 ±0.01 h | 7.21 ±0.01 e | 9.53 ±0.01 e | 10.39 ±0.01 c |
| Sweden | 3.1 ±0.1 k | 3.24 ±0.01 j | 2.4 ±0.1 j | 2.44 ±0.01 j | 2.38 ±0.01 g |
| United Kingdom | 9.35 ±0.01 c | 9.65 ±0.01 d | 8.8 ±0.1 d | 10.03 ±0.01 d | 10.47 ±0.01 c |
Levels not connected by the same letter are significantly different. Data extracted and analyzed from EFSA-ECDC (EFSA and ECDC, 2017).
Figure 1 shows the epidemiological behavior of Salmonella sp. in a histogram with incidence of outbreaks in the population of 28 countries in Europe from 2012 to 2016. The cumulative relative frequency (Fi) curve is presented, which was obtained based on the following formula:
Where: Fi= cumulative relative frequency; Ni= cumulative absolute frequency; and n= absolute frequency. The arithmetic mean was calculated with the average number of epidemiological outbreaks obtained from data extracted and analyzed from EFSA-ECDC (2017).
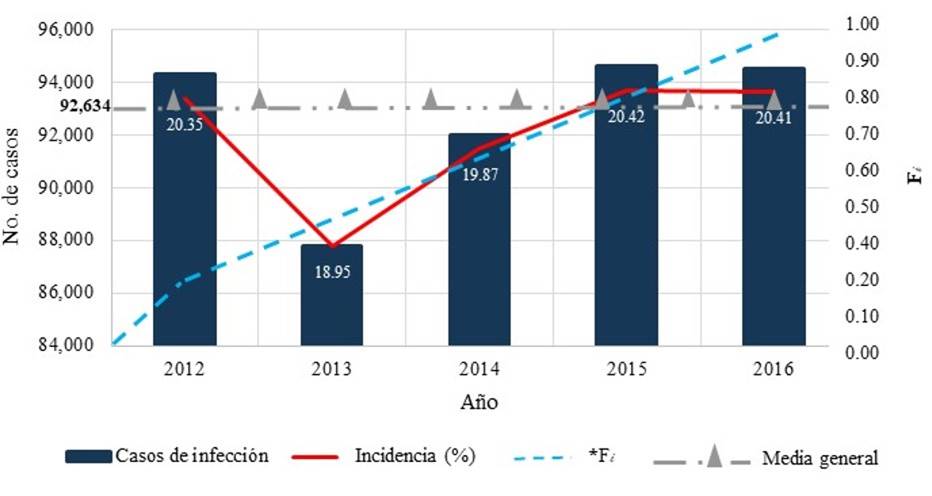
Figure 1 Histogram of incidence of Salmonella sp. in 28 countries in Europe due to consumption of contaminated plant-based foods. Data extracted and analyzed from EFSA-ECDC (2017).
The histogram showed that the Fi of outbreaks of Salmonella sp. was higher in the last year. In the same period, the epidemiological behavior of Salmonella sp. present in fresh fruits and vegetables was 28 512, 10 684, 10 652, 7 370 and 8 013 cases respectively, with serotypes S. Enteritidis, S. Typhimurium monophasic, S. Typhimurium, S. Infantis and S. Derby (EFSA and ECDC, 2016; EFSA and ECDC, 2017).
Situation of Salmonella sp. in North America
The US. Centers for Disease Control and Prevention (CDC) reported 1.35 million Salmonella sp. infections per year in humans due to consuming contaminated foods, of the total cases 420 end in death (CDC, 2021). From 2010 to April 2021, the epidemiological behavior of salmonellosis in the population of the United States of America (USA), 3 246 reported cases due to the consumption of fresh plant-based foods contaminated with Salmonella sp. were studied. By year, the epidemiological behavior of Salmonella sp. serotypes among the states showed significant statistical differences (p≤ 0.0001) in incidence (Table 3).
Table 3 Incidence and spatial distribution of Salmonella serotypes due to consumption of contaminated plant-based foods by US. state from 2010 to April 2021.
| Year | State | Food | Serotype | Incidence (%) |
| 2010 | CA y NV | Mamey pulp | S. Typhi | 0.28 ±0.01 o |
| IL, MO, IN, PA, WI, MA, NY, TN, VA, CT, AR, CA, CO, DC, GA, HI, IA, KY, LA, MD, NE, NV, NJ, NC, OR, SC y SD | Alfalfa sprouts | S. 1,4, [5], 12 i: | 4.31 ±0.01 d | |
| 2011 | NY | Turkish pine nuts | S. Enteritidis | 1.32 ±0.01 l |
| TX, IL, NY, CA, GA, WA, AZ, MN, MO, NM, NE, VA, WI, LA, PA, AR, CO, IN, KY, MA, NV, NJ, OH, OK, y TN | Papaya | S. Agona | 3.27 ±0.01 g | |
| OR, WA, CA, AZ, CO, MD, MT, NV, UT y PA | Melon | S. Panama | 0.62 ±0.01 n | |
| 2012 | WA, HI, NY, TX, IL, DE, ID, ME, MI, MT, NE, NJ, OR y WI | Daniela mango | S. Braenderup | 3.91 ±0.01 e |
| KY, IL, IN, AL, MO, GA, IA, WI, MI, TN, MS, AR, OH, NC, SC, MN, NJ, PA, TX, FL, MD, MT, OK y VA. | Melon | S. Typhimurium y S. Newport | 8.04 ±0.01 c | |
| 2013 | CA, AZ, MN, TX, IL, NC, VA, OH, CO, ID, NM, SD, WI, OR, LA, MD, MA y NV | Cucumbers | S. Saintpaul | 2.59 ±0.01 i |
| 2014 | MA, NY, PA, CT, RI, MD, NH, ME, OH, VT, MT y VA | Soybean sprouts | S. Enteritidis | 3.54 ±0.01 f |
| 2015 | Without registration | Cucumbers | S. Poona | 27.94 ±0.01 b |
| 2016 | CO, KS, NE, WY, MN, MO, NY, OR y TX | Alfalfa sprouts | S. Abony | 1.11 ±0.01 m |
| 2017 | NJ, NY y PA | Maradol papaya | S. Urbana | 0.22 ±0.01 p |
| 2018 | MI, IN, MO, IL, OH, AR, FL, KY y TN | Melon | S. Adelaide | 2.37 ±0.01 k |
| 2019 | NY, NJ, CT, MA, PA, FL, DE, RI y TX | Papaya | S. Uganda | 2.5 ±0.01 j |
| 2020 | WA, CA, UT, OR, MT, IL, MI, ID, AZ, CO, IA, WY, PA, AK, SD, MN, NY, NV, GA, MO, OH, WI, NJ, NE, VA, ND, FL, MD, TN, ME, NC, MS, IN, HI, KS, KY, NM, RI, WV, AL, AR, CT, DE, MA, TX, NH, OK y SC | Onion | S. Newport | 34.72 ±0.01 a |
| MN, MI, NY, IA, NJ, WI, PA, VA, MO, CA, CT, IL, KS, KY, MD, OH y VT | Peaches | S. Enteritidis | 3.11 ±0.01 h | |
| 2021 | FL, CA y TN | Plant-based products | S. Duisburg | 0.15 ±0.01 q |
AL= Alabama; AK= Alaska; AZ= Arizona; AR= Arkansas; CA= California; NC= North Carolina; SC= South Carolina; CO= Colorado; CT= Connecticut; ND= North Dakota; SD= South Dakota; DE= Delaware; DC= District of Columbia; FL= Florida; GA= Georgia; HI= Hawaii; ID= Idaho; IL= Illinois; IN= Indiana; IA= Iowa; KS= Kansas; KY= Kentucky; LA= Louisiana; ME= Maine; MD= Maryland; MA= Massachusetts; MI= Michigan; MN= Minnesota; MS= Mississippi; MO= Missouri; MT= Montana; NE= Nebraska; NV= Nevada; NH= New Hampshire; NJ= New Jersey; NY= New York; NM= New Mexico; OH= Ohio; OK= Oklahoma; OR= Oregon; PA= Pennsylvania; RI= Rhode Island; TN= Tennessee; TX= Texas; UT= Utah; VT= Vermont; VA= Virginia; WV= West Virginia; WA= Washington; WI= Wisconsin; WY= Wyoming. Levels not connected by the same letter are significantly different. Data extracted and analyzed from CDC and FDA (2010; 2011a; 2011b; 2011c; 2011d; 2012a; 2012b; 2013; 2014; 2015; 2016; 2017; 2018; 2019; 2020a; 2020b; 2021).
Figure 2 shows the epidemiological behavior of Salmonella sp. in a histogram with the incidence of serotypes and the Fi curve present in the USA from 2010 to April 2021. In this country, the epidemiological impact of Salmonella sp. that occurs throughout history is due to the diversity of serotypes, in addition to the expression and typing of virulence genes by serotype. In 2015 and 2020, the highest peak of epidemiological outbreaks due to Salmonella sp. was observed, it was also observed that, due to health management measures, the disease was flattened and controlled. However, in recent years the incidence and the Fi curve may be indicators of the epidemiological behavior of Salmonella serotypes, which interact with the population due to the consumption of contaminated foods.
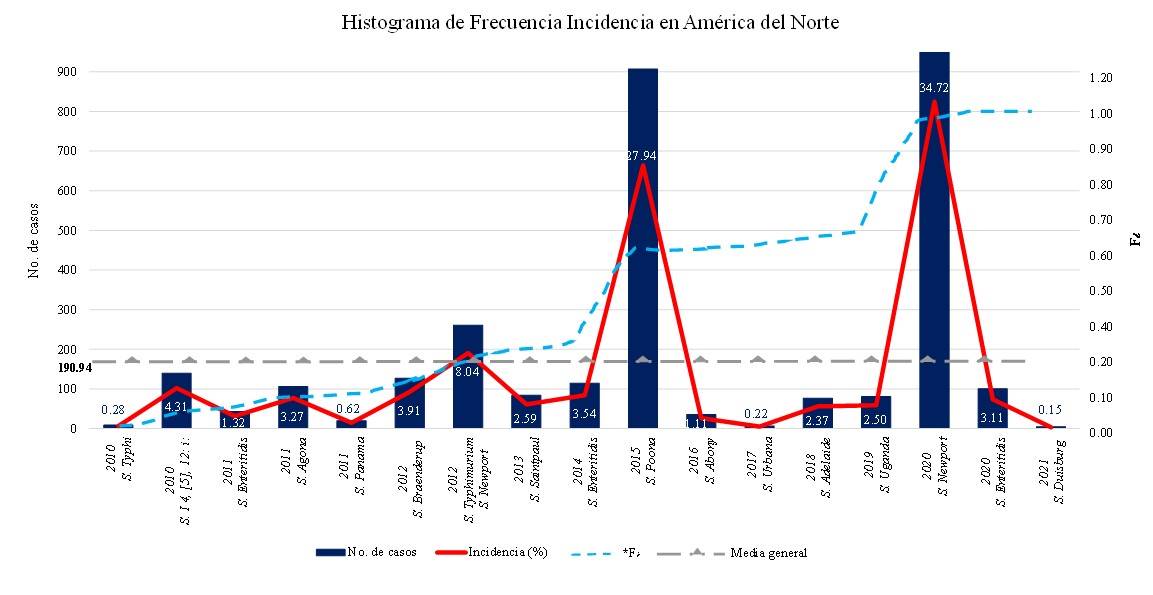
Figure 2 Histogram of Incidence of Salmonella sp. serotypes in the United States of North America due to consumption of contaminated plant-based foods. Data extracted and analyzed from CDC and FDA (2010-2021).
Epidemiological behavior of Salmonella sp. in Mexico
The National Epidemiological Surveillance System of the General Directorate of Epidemiology (SINAVE-DGE), for their acronyms in Spanish of the Secretariat of Health of Mexico, from 2010 to April 202, reported 975 321 infections by Salmonella sp. in humans for consuming contaminated plant-based foods (SINAVE-DGE-SSM, 2021a and 2021b). Table 4 shows by state the epidemiological behavior of Salmonella sp. present in plant-based foods. By year, the incidence of epidemiological behavior of Salmonella sp. showed significant statistical differences (p≤ 0.0001) between states.
Table 4 Epidemiological behavior of Salmonella sp. due to consumption of contaminated plant-based foods by state in Mexico from 2010 to April 2021.
| State | Year/incidence (%) | |||||||||||
| 2010 | 2011 | 2012 | 2013 | 2014 | 2015 | 2016 | 2017 | 2018 | 2019 | 2020 | 2021 | |
| Aguascalientes | 2.35 ±0.01n | 2.19 ±0.01k | 2.25 ±0.01j | 2.11 ±0.01m | 0.93 ±0.01r | 1.48 ±0.01q | 1.88 ±0.01m | 1.25 ±0.01o | 0.62 ±0.01r | 0.7 ±0.01q | 0.44 ±0.01t | 0.48 ±0.01s |
| Baja California | 1.68 ±0.01p | 1.49 ±0.01n | 1.52 ±0.01o | 1.47 ±0.01q | 2.06 ±0.01l | 2.66 ±0.01j | 2.26 ±0.01k | 1.36 ±0.01n | 1.24 ±0.01n | 0.84 ±0.01p | 0.8 ±0.01q | 0.33 ±0.01t |
| Baja California Sur | 0.35 ±0.01z | 0.29 ±0.01w | 0.25 ±0.01x | 0.27 ±0.01x | 0.18 ±0.01y | 0.21 ±0.01y | 0.23 ±0.01z | 0.24 ±0.01w | 0.21 ±0.01w | 0.16 ±0.01v | 0.16 ±0.01yz | 0.25 ±0.01u |
| Campeche | 1.28 ±0.01r | 1.25 ±0.01q | 1.11 ±0.01p | 1.65 ±0.01o | 1.38 ±0.01o | 1.8 ±0.01n | 1.55 ±0.01q | 0.71 ±0.01r | 0.42 ±0.01t | 0.09 ±0.01wx | 0.15 ±0.01z | 0.23 ±0.01u |
| Coahuila | 9.22 ±0.01d | 7.74 ±0.01d | 8.43 ±0.01d | 8.57 ±0.01d | 7.86 ±0.01d | 4.12 ±0.01f | 1.67 ±0.01p | 6.14 ±0.01e | 2.34 ±0.01i | 3.35 ±0.01g | 2.2 ±0.01k | 1.68 ±0.01k |
| Colima | 0.26 ±0.01 ∞ | 0.12 ±0.01x | 0.11 ±0.01y | 0.13 ±0.01z | 0.19 ±0.01y | 0.22 ±0.01y | 0.18 ±0.01 ∞ | 0.16 ±0.01x | 0.19 ±0.01w | 0.11 ±0.01w | 0.2 ±0.01x | 0.33 ±0.01t |
| Chiapas | 18.16 ±0.01a | 20.35 ±0.01a | 21.21 ±0.01a | 23.06 ±0.01a | 28.55 ±0.01a | 26.17 ±0.01a | 27.03 ±0.01a | 24.31 ±0.01a | 25.73 ±0.01a | 25.54 ±0.01a | 29.99 ±0.01a | 32.07 ±0.01a |
| Chihuahua | 5.1 ±0.01e | 4.74 ±0.01e | 4.17 ±0.01e | 4.44 ±0.01e | 2.66 ±0.01j | 3.27 ±0.01g | 3.55 ±0.01f | 4.04 ±0.01f | 4.18 ±0.01e | 4.2 ±0.01f | 2.98 ±0.01h | 3.11 ±0.01f |
| Mexico City | 0.91 ±0.01v | 1.43 ±0.01o | 0.64 ±0.01t | 0.91 ±0.01s | 0.55 ±0.01w | 0.55 ±0.01u | 0.62 ±0.01w | 0.44 ±0.01u | 0.98 ±0.01p | 1 ±0.01o | 0.71 ±0.01r | 0.85 ±0.01p |
| Durango | 0.02 ±0.01 δ | 0.03 ±0.01y | 0.03 ±0.01z | 0.04 ±0.01 ∞ | 0.12 ±0.01z | 0.01 ±0.01z | 0.04 ±0.01 β | 0.02 ±0.01y | 0.03 ±0.01x | 0.01 ±0.01y | 0.03 ±0.01 ∞ | 0.05 ±0.01w |
| Guanajuato | 0.51 ±0.01y | 0.53 ±0.01v | 0.53 ±0.01u | 0.87 ±0.01t | 0.66 ±0.01u | 0.56 ±0.01u | 1.09 ±0.01r | 1.15 ±0.01p | 0.95 ±0.01p | 1.35 ±0.01n | 1.25 ±0.01p | 1.32 ±0.01n |
| Guerrero | 3.47 ±0.01i | 3.04 ±0.01i | 3.49 ±0.01h | 3.73 ±0.01g | 0.87 ±0.01s | 1.64 ±0.01p | 2.2 ±0.01l | 1.8 ±0.01m | 1.81 ±0.01l | 1.76 ±0.01m | 1.96 ±0.01m | 1.55 ±0.01m |
| Hidalgo | 0.11 ±0.01 β | 0.14 ±0.01x | 0.11 ±0.01y | 0.23 ±0.01y | 0.3 ±0.01x | 0.26 ±0.01x | 0.27 ±0.01y | 0.26 ±0.01vw | 0.32 ±0.01u | 0.34 ±0.01t| | 0.19 ±0.01xy | 0.23 ±0.01u |
| Jalisco | 4.51 ±0.01f | 4.42 ±0.01f | 3.76 ±0.01g | 3.47 ±0.01h | 1.88 ±0.01n | 3.1 ±0.01h | 3.04 ±0.01g | 2.98 ±0.01i | 2.37 ±0.01i | 2.17 ±0.01k | 3.28 ±0.01g | 2.82 ±0.01g |
| State of México | 2.75 ±0.01l | 2.41 ±0.01j | 2.09 ±0.01k | 1.94 ±0.01n | 2.49 ±0.01k | 2.53 ±0.01k | 2.29 ±0.01k | 1.89 ±0.01l | 1.91 ±0.01k | 2.25 ±0.01j | 2.37 ±0.01i | 2.02 ±0.01i |
| Michoacán | 2.55 ±0.01m | 2.18 ±0.01k | 1.94 ±0.01l | 1.55 ±0.01p | 1.96 ±0.01m | 2.27 ±0.01m | 2.61 ±0.01j | 2.18 ±0.01j | 2.36 ±0.01i | 2.47 ±0.01i | 2.26 ±0.01j | 1.86 ±0.01j |
| Morelos | 0.51 ±0.01y | 0.75 ±0.01t | 0.46 ±0.01v | 0.33 ±0.01w | 0.63 ±0.01uv | 0.49 ±0.01v | 0.28 ±0.01y | 0.24 ±0.01w | 0.25 ±0.01v | 0.21 ±0.01u | 0.19 ±0.01xy | 0.01 ±0.01x |
| Nayarit | 1.06 ±0.01u | 1.04 ±0.01r | 1.71 ±0.01m | 2.35 ±0.01l | 4.35 ±0.01f | 4.7 ±0.01e | 2.94 ±0.01h | 2.02 ±0.01k | 3.3 ±0.01f | 5.01 ±0.01e | 5.02 ±0.01e | 2.55 ±0.01h |
| Nuevo León | 1.1 ±0.01t | 1.3 ±0.01p | 1.13 ±0.01p | 0.65 ±0.01v | 1.05 ±0.01q | 0.4 ±0.01w | 0.61 ±0.01w | 0.5 ±0.01t | 0.49 ±0.01s | 0.42 ±0.01s | 0.29 ±0.01w | 0.16 ±0.01v |
| Oaxaca | 2 ±0.01o | 1.99 ±0.01l | 2.06 ±0.01k | 2.08 ±0.01m | 1.99 ±0.01m | 1.71 ±0.01o | 1.78 ±0.01o | 1.35 ±0.01n | 2.06 ±0.01j | 2.14 ±0.01k | 2.04 ±0.01l | 1.63 ±0.01l |
| Puebla | 4.43 ±0.01h | 4.39 ±0.01f | 4.05 ±0.01f | 4.24 ±0.01f | 6.57 ±0.01e | 7.29 ±0.01d | 6.55 ±0.01d | 6.27 ±0.01d | 6.17 ±0.01d | 5.46 ±0.01d | 5.45 ±0.01d | 5.78 ±0.01d |
| Querétaro | 0.68 ±0.01x | 0.66 ±0.01u | 0.42 ±0.01w | 0.24 ±0.01xy | 0.12 ±0.01z | 0.29 ±0.01x | 0.4 ±0.01x | 0.28 ±0.01v | 0.19 ±0.01w | 0.06 ±0.01x | 0.03 ±0.01 ∞ | 0.03 ±0.01wx |
| Quintana Roo | 3.16 ±0.01j | 3.46 ±0.01h | 3.43 ±0.01i | 2.9 ±0.01j | 2.86 ±0.01i | 2.44 ±0.01l | 2.94 ±0.01h | 3.61 ±0.01g | 3.14 ±0.01g | 1.97 ±0.01l | 1.52 ±0.01o | 1.86 ±0.01j |
| San Luis Potosí | 0.69 ±0.01x | 0.83 ±0.01s | 0.71 ±0.01s | 0.88 ±0.01st | 1.11 ±0.01p | 1.29 ±0.01r | 0.86 ±0.01t | 1.15 ±0.01p | 1.34 ±0.01m | 1.02 ±0.01o | 0.69 ±0.01r | 0.46 ±0.01s |
| Sinaloa | 4.47 ±0.01g | 4.25 ±0.01g | 4.04 ±0.01f | 2.61 ±0.01k | 3.71 ±0.01g | 2.94 ±0.01i | 2.78 ±0.01i | 3.38 ±0.01h | 2.95 ±0.01h | 2.98 ±0.01h | 4.07 ±0.01f | 4.4 ±0.01e |
| Sonora | 1.19 ±0.01s | 1.25 ±0.01q | 1.06 ±0.01q | 0.62 ±0.01v | 0.76 ±0.01t | 0.97 ±0.01s | 1 ±0.01s | 0.81 ±0.01q | 0.65 ±0.01r | 0.36 ±0.01t | 0.37 ±0.01v | 0.65 ±0.01q |
| Tabasco | 9.8 ±0.01c | 10.88 ±0.01c | 10.21 ±0.01c | 11.34 ±0.01b | 8.6 ±0.01c | 10.17 ±0.01c | 10.53 ±0.01c | 9.64 ±0.01c | 9.89 ±0.01c | 9 ±0.01c | 7.22 ±0.01c | 6.85 ±0.01c |
| Tamaulipas | 2.86 ±0.01k | 3.04 ±0.01i | 3.74 ±0.01g | 3.11 ±0.01i | 3.55 ±0.01h | 2.94 ±0.01i | 3.99 ±0.01e | 3.58 ±0.01g | 3.14 ±0.01g | 2 ±0.01l | 1.63 ±0.01n | 1.85 ±0.01j |
| Tlaxcala | 0.77 ±0.01w | 0.68 ±0.01u | 0.84 ±0.01r | 0.79 ±0.01u | 0.62 ±0.01v | 0.79 ±0.01t | 0.71 ±0.01u | 0.65 ±0.01s | 0.82 ±0.01q | 0.62 ±0.01r | 0.4 ±0.01uv | 0.55 ±0.01r |
| Veracruz | 12.01 ±0.01b | 11.03 ±0.01b | 12.35 ±0.01b | 10.24 ±0.01c | 9.8 ±0.01b | 10.73 ±0.01b | 11.62 ±0.01b | 15.07 ±0.01b | 17.55 ±0.01b | 20.34 ±0.01b | 21.04 ±0.01b | 22.73 ±0.01b |
| Yucatán | 0.5 ±0.01y | 0.5 ±0.01v | 0.56 ±0.01u | 1.06 ±0.01r | 0.52 ±0.01w | 0.56 ±0.01u | 0.67 ±0.01v | 1.23 ±0.01o | 1.24 ±0.01n | 1.35 ±0.01n | 0.43 ±0.01tu | 0.3 ±0.01t |
| Zacatecas | 1.54 ±0.01q | 1.61 ±0.01m | 1.61 ±0.01n | 2.09 ±0.01m | 1.14 ±0.01p | 1.46 ±0.01q | 1.82 ±0.01n | 1.26 ±0.01o | 1.14 ±0.01o | 0.71 ±0.01q | 0.59 ±0.01s | 1.03 ±0.01o |
Levels not connected by the same letter are significantly different. Data extracted and analyzed from SINAVE-DGE-SSM (2021a and 2021b).
Figure 3 shows the epidemiological behavior of Salmonella sp. in a histogram with incidence of salmonellosis and the Fi curve present in Mexico from 2010 to 2021. In the histogram, the Fi of Salmonella sp. outbreaks declined 43.75% in 2020 with respect to 2019. The epidemiological behavior in the first four-month period of 2021, the percentage of cases presented a trend of 13.24% in contrast to 2019, Chiapas, Veracruz, Tabasco, Durango, Puebla and Coahuila were the states with the highest incidence.

Figure 3 Histogram of Incidence of Salmonella sp. in Mexico due to consumption of contaminated plant-based foods. Data extracted and analyzed from SINAVE-DGE-SSM (2021a and 2021b).
The epidemiological behavior of Salmonella sp. among regions of Africa, Europe and North America presented incidences of 4.08, 30.82 and 65.1%, respectively. Figure 4 shows the histogram of salmonellosis incidence in the population by region, due to the consumption of contaminated plant-based foods, plus the Fi curve (Reddy et al., 2010; CDC-FDA, 2011c; EFSA-ECDC, 2017; SINAVE-DGE-SSM, 2021a and 2021b).
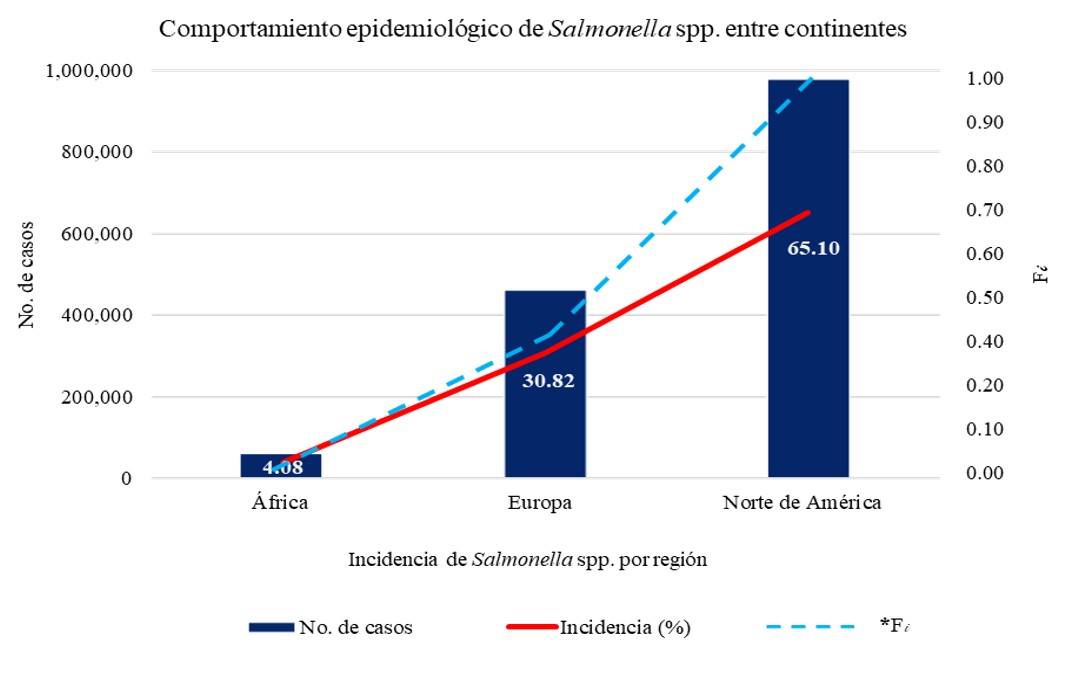
Figure 4 Histogram of Incidence of Salmonella spp. among the population of the regions of Africa, Europe and North America, due to consumption of contaminated plant-based foods. Data extracted and analyzed from Reddy et al. (2010), CDC-FDA (2011c), EFSA-ECDC (2017), SINAVE-DGE-SSM (2021a and 2021b).
Conclusions
The epidemiological behavior of Salmonella enterica in plant-based foods showed the highest prevalence (49.9%) in the North African region. On the European continent, the epidemiological status of Salmonella sp. increased in 2015. In 2021, the states of the United States and Mexico showed a radical decrease in the epidemiological curve. Among the regions of Africa, Europe and North America, the epidemiological behavior of Salmonella sp. in plant-based foods presented incidences of 4.08, 30.82 and 65.1% respectively, due to the consumption of contaminated plant-based foods.
Acknowledgements
To the National Council of Science and Technology (CONACYT), for its acronym in Spanish for the granting of a national scholarship.
REFERENCES
Alam, M. 2014. Microbial status of irrigation water for vegetables as affected by cultural practices. Department of biosystems and technology alnarp. Doctoral Thesis. Swedish University of Agricultural Sciences Alnarp. Sweden. 13-44 pp. https://pub.epsilon.slu.se/10986/1/alam-m-140124.pdf. [ Links ]
Al-Rifai, R. H.; Chaabna, K.; Denagamage, T. and Alali, W. Q. 2019. Prevalence of enteric non-typhoidal Salmonella in humans in the Middle East and North Africa: A systematic review and meta-analysis. Zoonoses Public Health. 66(7):701-728. Doi: https://doi.org/10.1111/zph.12631. [ Links ]
Anderson, M.; Sansonetti, P. J. and Marteyn, B. S. 2016. Shigella diversity and changing landscape: insights for the Twenty-first century. Front. Cell. Infect. Microbiol. 6(45):1-9. https://doi.org/10.3389/fcimb.2016.00045. [ Links ]
Andrews, W. H.; Wang, H.; Jacobson, A.; Ge, B.; Zhang, G. and Hammack, T. 2021. Chapter 5: Salmonella. In: bacteriological analytical manual. U.S. Food & Drug Administration. USA. https://www.fda.gov/food/laboratory-methods-food/bam-chapter-5-salmonella. [ Links ]
Barreto, M.; Castillo, R. M. y Retamal, P. 2016. Salmonella enterica: una revisión de la trilogía agente, hospedero y ambiente y su trascendencia en Chile. Rev. Chil. Infectol. 33(5):547-557. http://dx.doi.org/10.4067/S0716-10182016000500010 [ Links ]
Betancor, L.; Gadea, M. P. y Flores, K. 2006. Genética bacteriana, In: temas de bacteriología y virología médica, 2da . Ed. Universidad de la República, Uruguay: Instituto de higiene, Departamento de Bacteriología y Virología. Uruguay. 59-80 pp. http://www.higiene.edu.uy/cefa/cefaed2006.htm. [ Links ]
CDC. 2021. Center for Disease Control and Prevention. Salmonella. U.S.A. https://www.cdc.gov/salmonella/index.html. [ Links ]
CDC-FDA. 2010. Center for disease control and prevention - Food and drug administration. Salmonella. Multistate outbreak of human typhoid fever infections associated with frozen mamey fruit pulp. USA. https://www.cdc.gov/salmonella/2010/frozen-fruit-pulp-8-25-10.html. [ Links ]
CDC-FDA. 2011a. Center for disease control and prevention - Food and drug administration. Salmonella. Multistate Outbreak of human Salmonella . Infections linked to alfalfa sprouts. https://www.cdc.gov/salmonella/2010/alfalfa-sprouts-2-10-11.html. [ Links ]
CDC-FDA. 2011b. Center for disease control and prevention. Food and drug administration. Salmonella. Multistate outbreak of human Salmonella. Enteritidis infections linked to Turkish Pine Nuts. USA. https://www.cdc.gov/salmonella/2011/pine-nuts-11-17-2011.html. [ Links ]
CDC-FDA. 2011c. Center for disease control and prevention. Food and drug administration. Salmonella. Multistate outbreak of human Salmonella agona infections linked to whole, fresh imported papayas. USA. https://www.cdc.gov/salmonella/2011/papayas-8-29-2011.html. [ Links ]
CDC-FDA. 2011d. Center for disease control and prevention. Food and drug administration. Salmonella. Multistate outbreak of Salmonella Panama infections linked to cantaloupe. USA. https://www.cdc.gov/salmonella/2011/cantaloupes-6-23-2011.html. [ Links ]
CDC-FDA. 2012a. Center for disease control and prevention. Food and drug administration. Salmonella. Multistate outbreak of Salmonella Braenderup infections associated with Mangoes. USA. https://www.cdc.gov/salmonella/braenderup-08-12/index.html. [ Links ]
CDC-FDA. 2012b. Center for disease control and prevention. Food and drug administration. Salmonella. Multistate outbreak of Salmonella Typhimurium and Salmonella newport infections Linked to Cantaloupe. USA. https://www.cdc.gov/salmonella/typhimurium-cantaloupe-08-12/index.html. [ Links ]
CDC-FDA. 2013. Center for disease control and prevention. Food and drug administration. Salmonella. Multistate outbreak of Salmonella Saintpaul infections linked to imported cucumbers. USA. https://www.cdc.gov/salmonella/saintpaul-04-13/index.html. [ Links ]
CDC-FDA. 2014. Center for disease control and prevention. Food and drug administration. Salmonella. Multistate outbreak of Salmonella enteritidis infections linked to bean sprouts. USA. https://www.cdc.gov/salmonella/enteritidis-11-14/index.html. [ Links ]
CDC-FDA. 2015. Center for disease control and prevention. Food and drug administration. Salmonella. Multistate outbreak of Salmonella poona infections linked to imported cucumbers. USA. https://www.cdc.gov/salmonella/poona-09-15/index.html. [ Links ]
CDC-FDA. 2016. Center for disease control and prevention. Food and drug administration. Salmonella. Multistate outbreak of Salmonella reading and Salmonella abony infections linked to alfalfa sprouts. USA. https://www.cdc.gov/salmonella/reading-08-16/index.html. [ Links ]
CDC-FDA. 2017. Center for disease control and prevention. Food and drug administration. Salmonella. Multistate outbreak of Salmonella urbana infections linked to imported maradol papayas. USA. https://www.cdc.gov/salmonella/urbana-09-17/index.html. [ Links ]
CDC-FDA. 2018. Center for disease control and prevention. Food and drug administration. Salmonella. Multistate outbreak of Salmonella Adelaide infections linked to pre-cut melon. USA. https://www.cdc.gov/salmonella/adelaide-06-18/index.html. [ Links ]
CDC-FDA. 2019. Center for disease control and prevention. Food and drug administration. Salmonella. Outbreak of Salmonella infections linked to cavi brand whole, fresh papayas. USA. https://www.cdc.gov/salmonella/uganda-06-19/index.html. [ Links ]
CDC-FDA. 2020a. Center for disease control and prevention. Food and drug administration. Salmonella. Outbreak of Salmonella newport infections linked to onions. USA. https://www.cdc.gov/salmonella/newport-07-20/index.html. [ Links ]
CDC-FDA. 2020b. Center for disease control and prevention. Food and drug administration. Salmonella. Outbreak of Salmonella enteritidis infections linked to peaches. USA. https://www.cdc.gov/salmonella/enteritidis-08-20/index.html. [ Links ]
CDC-FDA. 2021. Center for disease control and prevention. Food and drug administration. Salmonella. Salmonella outbreak linked to Jule’s Cashew Brie. USA. https://www.cdc.gov/salmonella/duisburg-04-21/index.html. [ Links ]
EFSA-ECDC. 2017. European food safety authority European center for disease prevention and control. The European Union summary report on trends and sources of zoonoses, zoonotic agents and food-borne outbreaks in 2016. EFSA Journal. 15(12):5077. https://doi.org/10.2903/j.efsa.2017.5077. [ Links ]
FAO. 2017. Food and Agriculture Organization of the United Nations. The future of food and agriculture. Trends and challenges. http://www.fao.org/3/a-i6583e.pdf. [ Links ]
Healy, J. M. and Bruce, B. B. 2018. Salmonellosis Nontyphoidal. In Travel-related infectious diseases. Ed. National center for emerging and zoonotic infectious diseases (NCEZID), Center for disease control and prevention (CDC). U.S.A. 78 p. https://wwwnc.cdc.gov/travel/yellowbook/2020/travel-related-infectious-diseases/salmonellosis-nontyphoidal. [ Links ]
Hernández, C. C.; Aguilera, M. Ma. G. y Castro, E. G. 2011. Situación de las enfermedades gastrointestinales en México. Enf. Inf. Microbiol. 31(4):137-151. [ Links ]
ICMSF. 2005. International Commission on Microbiological Specifications for Foods. Microorganisms in food. Microbial ecology of food commodities. 2 Ed. Kluwer Academic/Plenum Publishers New York. USA. 146-152 pp. [ Links ]
Jung, Y.; Jang, H. and Matthews, K. R. 2014. Effect of the food production chain from farm practices to vegetable processing on outbreak incidence. Microb. Biotechnol. 7(6):517-527.https://doi.org/10.1111/1751-7915.12178. [ Links ]
Majowicz, S. E.; Musto, J.; Scallan, E.; Angulo, F. J.; Kirk, M.; O’Brien, S. J.; Jones, T. F.; Frazil, A. and Hoekstra, M. 2010. The global burden of nontyphoidal Salmonella gastroenteritis. Clin. Infect. Dis. 50(6):882-889.https://doi.org/10.1086/650733. [ Links ]
Mtove, G.; Amos, B.; VonSeidlein, L.; Hendriksen, I.; Mwambuli, A. and Kimera, J. 2010. Invasive salmonellosis among children admitted to a rural Tanzanian Hospital and a comparison with previous studies. PLOS ONE. 5(2):9244. https://doi.org/10.1371/ journal.pone.0009244. [ Links ]
Nair, A.; Balasaravanan, T.; Malik, S. V. S.; Mohan, V.; Kumar, M.; Vergis, J. and Rawool, D. B. 2015. Isolation and identification of Salmonella from diarrhoeagenic infants and young animals, sewage waste and fresh vegetables. Vet. World. 8(5):669-673. [ Links ]
OMS. 2005. Organización Mundial de la Salud. International Health Regulations (RSI) Ginebra, Suiza. https://www.who.int/publications/i/item/9789241580496. [ Links ]
OMS. 2014. Organización Mundial de la Salud. Agua, saneamiento e higiene: Enfermedades y riesgos asociados a las deficiencias en los servicios de agua y saneamiento. https://www.who.int/water-sanitation-health/diseases-risks/es/. [ Links ]
Reddy, E. A.; Shaw, A. V. and Crump, J. A. 2010. Community-acquired bloodstream infections in Africa: a systematic review and meta-analysis. Lancet. Infect. Dis. 10(6):417-432. https://doi.org/10.1016/S1473-3099(10)70072-4. [ Links ]
SINAVE-DGE-SSM. 2021a. Sistema Nacional de Vigilancia Epidemiológica de la Dirección General de Epidemiología-Secretaría de Salud de México. Histórico Boletín Epidemiológico de 1985-2020. https://www.gob.mx/salud/acciones-y-programas/histori co-boletin-epidemiologico. [ Links ]
SINAVE-DGE-SSM. 2021b. Sistema Nacional de Vigilancia Epidemiológica de la Dirección General de Epidemiología-Secretaría de Salud de México. Boletín Epidemiológico. Semana Epidemiológica. https://www.gob.mx/salud/documentos/boletinepidemiologico-sistema-nacional-de-vigilancia-epidemiologica-sistema-unico-de-informacion-261547. [ Links ]
Soodb; S. and Hunjanm. 2018. Contaminated irrigation water: a source of human pathogens on growing vegetables. Int. J. Cell. Sci. & Mol. Biol. 3(5):0086-0088. [ Links ]
Soto, V. Z.; Pérez, L. L. y Estrada, A. D. 2016. Bacterias causantes de enfermedades transmitidas por alimentos: una mirada en Colombia. Salud Uninorte. 32(1):105-122. https://rcientificas.uninorte.edu.co/index.php/salud/article/view/7333. [ Links ]
Received: January 01, 2023; Accepted: January 27, 2023
 Este es un artículo publicado en acceso abierto bajo una licencia Creative Commons
