


Serviços Personalizados
Journal
Artigo
 texto em
  Inglês (pdf)
 Artigo em XML
 Referências do artigo
 Enviar este artigo por email
Indicadores
-
 Citado por SciELO
 -
 Acessos
Links relacionados
-
 Similares em
SciELO
Similares em
SciELO
Compartilhar

 Permalink
Revista mexicana de ciencias agrícolas
versão impressa ISSN 2007-0934
Rev. Mex. Cienc. Agríc vol.14 no.1 Texcoco Jan./Fev. 2023 Epub 19-Jun-2023
https://doi.org/10.29312/remexca.v14i1.2992
Articles
Ecophysiological and numerical traits of broad bean yield affected by cultivar, population density and sowing system
1Maestría en Ciencias Agropecuarias y Recursos Naturales-Universidad Autónoma del Estado de México. (wardndc@hotmail.com; koetesfwck@hotmail.com).
2Facultad de Ciencias Agrícolas-Universidad Autónoma del Estado de México. (cgmartinezr@uaemex.mx; adominguezl@uaemex.mx).
A field experiment was established with the objective of evaluating the effect of two sowing systems, three densities and three cultivars on the ecophysiological and numerical traits of the seed yield of broad bean var. Major. The three broad bean cultivars (amarilla, diamante, monarca) were sown in plots of three furrows 3 m long and separated at 0.8 m (traditional system: TS) and 0.4 m (alternative system: AS) and in three population densities (5, 10 and 15 seeds m-2). To achieve the desired density, two seeds were deposited every 25, 12.5 and 8 cm (TS) and every 50, 25 and 16 cm (AS). The experimental design was a randomized complete block design with four serial repetitions. The results showed significant effects for sowing systems, density and cultivar. The AS obtained the highest biomass production and grain yield relative to the TS. Increasing population density increased seed yield due to a higher number of seeds per unit area and a higher number of pods m-2. Showing that the greatest variability in this experiment was due to the increase in sowing densities, followed by the distances between rows (AS 40 cm) and (TS 80 cm). The Monarca genotype obtained the highest seed yield, while Amarilla presented an increase in weight of 100 seeds. It was observed that each cultivar presented a different behavior for the generation of yield.
Keywords: Vicia faba L. var. Major; biomass; grain yield; harvest index.
Se estableció un experimento en campo con el objetivo de evaluar el efecto de dos sistemas de siembra, tres densidades y tres cultivares, sobre los caracteres ecofisiológicos y numéricos del rendimiento de semilla de haba var. Mayor. Los tres cultivares de haba (Amarilla, Diamante y Monarca) fueron sembrados en parcelas de tres surcos de 3 m de largo y separados a 0.8 m (sistema tradicional: ST) y a 0.4 m (sistema alternativo: SA) y en tres densidades de población (5, 10 y 15 semillas m-2). Para lograr la densidad deseada se depositaron dos semillas cada 25, 12.5 y 8 cm (ST) y cada 50, 25 y 16 cm (SA). El diseño experimental fue un diseño de bloques completos al azar con cuatro repeticiones en serie. Los resultados mostraron efectos significativos para sistemas de siembra, densidad y cultivares. El SA obtuvo la mayor producción de biomasa y rendimiento de grano respecto del ST. Aumentar la densidad de población incremento el rendimiento de semilla debido a un mayor número de semillas por unidad de superficie y a un mayor número de vainas por m2. Mostrando que la variabilidad mayor en este experimento se debió al incremento en las densidades de siembra, seguido por las distancias entre hileras (SA 40 cm) y (ST 80 cm). El genotipo Monarca obtuvo el mayor rendimiento de semilla, mientras que Amarilla presentó un incremento en peso de 100 semillas. Se observó que cada cultivar presentó un comportamiento distinto para la generación del rendimiento.
Palabras clave: Vicia faba L. var. Mayor; biomasa; índice de cosecha; rendimiento de grano.
Introduction
Broad bean (Vicia faba L.) is a very important legume due to its high protein content in the grain and its great diversity of uses (Tamrat et al., 2019). Around 2.5 million ha are currently sown in the world, with a production of 5.4 million tonnes with an average grain yield of 2.1 t ha-1. Among the five main producers of broad beans in the world, China stands out with 1.7 million tonnes, followed by Ethiopia with one million tonnes, while the United Kingdom and Australia produce 547 and 327 thousand tonnes, respectively (FAOSTAT, 2019). In Mexico, around 20 thousand ha are sown with a production of 30 thousand tonnes with an average yield of 1.48 t ha-1 (SIAP, 2019).
In grain crops, yield is closely related to biomass production and harvest index (proportion of total biomass representing grain) (Al-Suhaibani et al., 2013; Cárcova et al., 2015). The biomass produced by a crop is the result of the genotype (G), the effect of environmental (E) conditions and those related to production technology, such as mineral nutrition, water availability, population density and the genotype-environment (GxE) interaction (Kruk et al., 2015). Population density (PD) as a result of distance between rows and between plants within rows is one of the main management factors determining biomass production and yield in grain crops (Matthews et al., 2001; Ciampitti and Vyn, 2011; Zhang et al., 2014).
In broad bean, higher PD reduces biomass production, seed yield and its components (Bakry et al., 2011; Khalil et al., 2011; Al-Suhaibani et al., 2013). Due to the levels of competition between plants even under favorable environmental conditions (Tamrat et al., 2019). It also depends on the botanical variety used (Minor, Equina or Major) (López-Bellido et al., 2005; Thalji, 2010; Khalil et al., 2011).
Reductions in the spacing between rows negatively affect the number of productive branches and number of pods per plant, when the distance between rows is shorter, the plant height increases (Bakry et al., 2011; Al-Suhaibani et al., 2013). Authors such as Marcelos and Consable (1986), when evaluating densities between 10 and 60 plants m-2 with distances between rows of 18 and 33 cm, observed increases in yield when reducing the distance between rows and increasing the number of plants m-2, concluding that densities of 30 to 35 plants m-2. Almeida et al. (1995) observed the highest yields with a density of 40 plants m-2, results similar to those obtained by Coelho (1987) with the (Minor) variety with densities of 10 to 50 plants m-2.
Studies such as those of Thalji (2010), when evaluating two, four and six plants per pot, in three broad bean cultivars, observed increases in seed yield, biomass production and plant height with the density of 34 plants m-2, while Al-Suhaibani et al. (2013), when evaluating two broad bean cultivars, in a drip irrigation system and placing 4, 6, 8, 10 and 12 plants per dripper, giving (15, 26, 34, 42, 52 plants m-2), found that seed yield was positively correlated with crop growth and also observed increases in seed yield up to eight plants per dripper.
Gezahegn et al. (2016) evaluated the effect of three spacings between rows (30, 40 and 50 cm) and three spacings between plants (8, 10 and 12 cm), they found that the 12 x 50 cm arrangement maximized seed yield, number of branches, number of pods per plant and number of seeds per pod, while Tamrat et al. (2019), when studying the effect of three broad bean varieties and six densities, found that seed yield increased with densities of 250 000 plants ha-1 in the three varieties.
In the High Valleys of Mexico there are few studies in which the behavior of cultivars in different spatial arrangements is analyzed, recently, Estrada et al. (2017) studied the effect of different management practices on broad bean forage production; nevertheless, seed yield was not analyzed in terms of its physiological and numerical components. Based on the above, the present work was established with the objective of studying the effect of cultivar, the separation between rows and the density of plants m-2 on the physiological and numerical components of seed yield in broad beans.
Materials and methods
The experiment was carried out in the winter-spring 2019-2020 cycle at the Faculty of Agricultural Sciences, dependent on the Autonomous University of the State of Mexico (UAEM, for its acronym in Spanish), located 18 km north of the city of Toluca, with geographical coordinates of 19° 15’ 33” north latitude, 99° 39’ 38” west longitude and at an altitude of 2 640 masl. The predominant climate is temperate subhumid, the most humid of the subhumids, with rains in summer and little rainfall in winter (5%), little thermal oscillation, average annual temperature of 12.8 °C and average annual rainfall of 900 mm (González et al., 2009).
The experiment was established in a pelic vertisol soil of volcanic origin, which has a low content of organic matter (1.01 to 2.36%). The color of the dry surface horizon is dark grayish brown or dark gray with clay contents of 20 to 36.4%. In the soil profile it is possible to distinguish a horizon with tillage disturbances, presenting compaction due to plow floor (Gil et al., 2014).
Study factors and experimental design
The experiment was established, with two distances between rows of 80 cm and the other with distance between rows of 40 cm. Three genotypes provided by the Institute of Agricultural, Aquaculture and Forestry Research and Training (ICAMEX, for its acronym in Spanish): (Amarilla, Diamante and Monarca) and three densities (5, 10 and 15 plants m-2) were evaluated. The treatments derived from the factorial arrangement of the three cultivars and 3 densities were established under a randomized complete block design with 4 repetitions.
General conditions of the experiment
The sowing was carried out during the first week of December 2019 in two sowing arrangements, the first consisting of three beds separated at 80 cm and 3 m in length (7.2 m2) designated as traditional system (TS), while the second had plots of 3 rows of 3 m in length and separated from each other at 0.4 m (4.8 m2 ) alternative system (AS). Three sowing densities were used for each arrangement, 5, 10 and 15 seeds m-2. To guarantee the desired density, the distance between plants in the traditional system was 8, 12.5 and 25 cm between plants, while in the alternative system, the separation was 16, 25 and 50 cm for densities of 5, 10 and 15 plants m-2, respectively.
The experiment was established under a drip irrigation system
The soil was fertilized with the treatment 150N-60P-30K, using urea, calcium triple superphosphate and potassium chloride as sources of these elements. Phosphorus, potassium and half of the nitrogen were applied at sowing, while the second half of the nitrogen was applied a week before flowering. Weed control was performed manually throughout the cultivation cycle. Atmospheric conditions were monitored throughout the cycle by an automated weather station (DavisTM, weather monitor II, USA).
Biomass production, yield and its components
At physiological maturity, the plants in a linear meter of the central furrow of each plot were cut and they were separated into branches and main stem, removing the pods from each stratum. The dry matter (stems, leaves and pods) of the sample was determined after drying in a forced-air oven for 72 h at 60 °C. Those of the sample, the dry weight of the seed and as well as the yield per unit area were counted.
The harvest index was obtained as the quotient between seed yield and dry matter per unit area. The number of pods, the number of seeds per pod and the number of seeds per unit area were determined. The weight of 100 seeds was obtained from the average weight of four samples of 100 seeds from each plot.
Statistical analysis
Each of the variables measured in the experiment was performed an analysis of variance according to (Aldas and Jiménez, 2007). When the F test of the analyses of variance was significant, the mean comparison test was performed using the honest minimum significant difference (HMSD) test or Tukey’s test at a significance level of 5% (Palaniswamy and Palaniswamy, 2006). The computer program R was used to carry out the statistical analyses (Salas, 2008).
Results and discussion
The climatic conditions during the development of the experiment did not limit the development and growth of the crop, the temperatures, despite being below 0 °C for some days, are not lethal for the first stages of development of the crop, with this temperature being the base temperature of growth (Confalone et al., 2011; Orozco et al., 2013). The emergence occurred 15 days after sowing, at 50 days 50% of the plants were in the anthesis stage. It is worth mentioning that both cultivars reached flowering simultaneously, finding favorable temperature and humidity conditions. At 90 days from the emergence, 50% fruiting or pod set was achieved. At 140 days, the crop reached physiological maturity with non-restrictive environmental conditions (Figure 1).

Figure 1 Agroclimatic conditions occurred during the conduct of experimental work. (S= sowing; Eme= emergence; BFV= visible flower bud; IF= beginning of flowering; IFr= beginning of fruiting; MF= physiological maturity) for the interaction between two sowing distances, three densities and three cultivars established in the winter-spring cycle in Cerrillo Piedras Blancas, Toluca, Mexico.
The analyses of variance showed significant effects of the sowing system in most of the variables evaluated, with the exception of biomass production at physiological maturity, weight of 100 seeds, number of productive branches per plant and number of total pods. Sowing density significantly affected all traits evaluated, with the exception of HI, SPP, PH, PNP. The analysis of variance also showed significant differences between varieties for biomass production at physiological maturity, grain yield, harvest index, number of grains m-2 and weight of 100 grains, while no significant effects were observed for the rest of the variables studied.
The interaction of system x density was significant (p< 0.05) for Yld, HI, NS, and SPP, while the interaction of system x variety was significant for Yld, HI, NS and SPP. On the other hand, the interaction of density by variety was significant (p< 0.05) for Biom, Yld, HI, NS and SPP. The interaction of system x density x variety was significant for Biom, HI, NS, W100S and SPP, was significant. The coefficients of variation ranged from 5.54 to 26.7%, corresponding to plant height and total number of pods (Table 1).
With the alternative system (distance between furrows 40 cm), the highest seed yield was obtained, compared to the traditional system (distance between furrows 80 cm), as well as the highest values of harvest index, number of seeds per unit area, number of pods m-2, number of seeds per pod, plant height and number of productive nodes per plant, in the rest of the variables both sowing systems were statistically equal.
On the other hand, the increase in sowing density positively affected biomass production (48%), seed yield (53.6%), number of seeds per unit area (47%), number of pods per unit area (47.7%) and number of branches per plant 5%, compared to the lowest density. Similar results were found by Khalil et al. (2011), who, when evaluating four sowing densities (150 000, 300 000, 450 000, 600 000) plants ha-1, found increases in seed yield with the density of 450 000 plants to be economically profitable. Tamrat et al. (2019), when evaluating densities in the range of 166 666 to 666 666 plants ha-1 in broad bean var. Minor, observed increases in grain yield and characteristics associated with growth, number of pods at the density of 250 000 plants ha-1.
Table 1 F values and their statistical significance for variables for three broad bean cultivars grown in two sowing systems and three population densities in Toluca, State of Mexico.
| Source of variation | df | Biom | Yld | HI | NS | W100S | NP | SPP | NBP | NPBP | PH | NPtot | PNP |
| System (sys) | 1 | 0.7ns | 302.2** | 59.4** | 92.1** | 2.9ns | 7.3* | 7.47* | 5.67* | 0.01ns | 31.6** | 4.7ns | 7.84* |
| Repetition (sys) | 6 | 2.9* | 0.1ns | 2.3* | 0.5ns | 0.9* | 1ns | 1.25ns | 1.37ns | 1.35ns | 6.4** | 1.5ns | 10.29** |
| Density (Den) | 2 | 172.6** | 57.7** | 1.7ns | 98.1** | 3** | 45.1** | 0.05ns | 3.23* | 4.81* | 0.4ns | 11.3** | 0.07ns |
| Variety (Var) | 2 | 60** | 10.3** | 8.7** | 7.1** | 8.1** | 0.2ns | 1.99ns | 1.08ns | 1.81ns | 2.2ns | 0.1ns | 0.1ns |
| Sys x Den | 2 | 0.8ns | 3.2* | 21.3** | 4.4* | 1ns | 0.1ns | 4.49** | 0.09ns | 1.15ns | 1.2ns | 0.3ns | 0.81ns |
| Sys x Var | 2 | 3* | 16.7** | 25.4** | 20.3** | 1ns | 1.4ns | 4.56** | 0.03ns | 0.01ns | 0.6ns | 0.9ns | 0.42ns |
| Den x Var | 4 | 8.6** | 4** | 9.6** | 6.3** | 0ns | 0.2ns | 3.61** | 1.74ns | 2.2ns | 0.3ns | 0.1ns | 1.12ns |
| Sys x Den x Var | 4 | 7.9** | 1.5ns | 4.8** | 4.8** | 5.4** | 0.5ns | 2.49* | 1.51ns | 1.87ns | 1.1ns | 0.1ns | 1.23ns |
| Error (MS) | 19 467.2 | 4 823.5 | 0.002 | 1 095.9 | 860.9 | 1 404.8 | 0.101 | 1.18 | 0.98 | 36.3 | 437.3 | 4.46 | |
| CV (%) | 12.9 | 19.4 | 13.77 | 17.66 | 15.1 | 25.4 | 24.4 | 18.52 | 19.01 | 5.5 | 26.7 | 16.45 |
Biomass at physiological maturity (Biom); seed yield (Yld); harvest index (HI); number of seeds m-2 (NS); weight of 100 seeds (W100S); pods m-2 (NP); seeds per pod (SPP); branches per plant (NBP); productive branches per plant (NPBP); plant height (PH); total pods (NPtot) and productive nodes per plant (PNP); *= significant at 0.05; **= significant at 0.01; ns= not significant.
Increases in population density modify the architecture of the plant, so high densities (16 plants m-2 to 42 plants m-2) reduce the number of productive branches per broad bean plant, impacting seed yield (Bakry et al., 2011; Repeal and Mojaddam, 2014; Gezahegn et al., 2016). The results of the experiment show that the number of productive branches per plant decreased by 15% compared to the lowest density (Table 2).
The genotypes Amarilla and Monarca had the highest seed yields (24% on average) with respect to the Diamante cultivar, with both genotypes showing a different strategy for yield generation, Amarilla achieved it through a higher seed weight, while Monarca did it through a higher number of seeds m-2 (Table 2). López-Bellido et al. (2005) mention that genotypes that have large seed size produce a lot of dry matter and achieve large leaf area index values, because they are taller and have larger leaves. It is worth mentioning that the seed weight in the Amarilla genotype differed from the rest of the genotypes and also achieved high biomass values at maturity.
Table 2 Average values for variables for three broad bean cultivars grown in two sowing systems and three population densities, in Toluca, State of Mexico.
| Source of variation | Biom (g m-2) | Yld (g m-2) | HI | NS | W100S (g) | NP | SPP | NBP | NPBP | PH (cm) | NPtot | PNP |
| System | ||||||||||||
| Alternative | 1100.8a | 419.8a | 0.4a | 215a | 200.1a | 159.2a | 1.4a | 5.5a | 5.2a | 118.9a | 85a | 15a |
| Traditional | 1052.1a | 294.6b | 0.27b | 159b | 188.3a | 135b | 1.2b | 6.2a | 5.2a | 98.6b | 71.5a | 10.5b |
| Density (plants m-2) | ||||||||||||
| 15 | 1461a | 464.3a | 0.32a | 253a | 185a | 196.3a | 1.3a | 5.6b | 4.9b | 108.2a | 65.4b | 12.9a |
| 10 | 1054.9b | 358.4b | 0.34a | 188b | 192a | 151.2b | 1.2a | 5.6a | 5ab | 108.4a | 75.6b | 12.8a |
| 5 | 713.5c | 248.9c | 0.35a | 120c | 205.6a | 93.7c | 1.3a | 5.3a | 5.7a | 109.7a | 93.7a | 12.7a |
| Cultivar | ||||||||||||
| Amarilla | 1323.3a | 395.9a | 0.31b | 188ab | 213.7a | 148.7a | 1.3a | 6.1a | 5.5a | 110.3a | 79.2a | 12.9a |
| Monarca | 1007.9b | 368.7a | 0.36a | 204a | 187b | 150.2a | 1.3a | 5.8a | 5.2a | 109.4a | 79.2a | 12.9a |
| Diamante | 898.18c | 307b | 0.33ab | 168b | 181.9b | 142.4a | 1.2a | 4.6a | 4.9a | 106.7a | 76.4a | 12.6a |
Biomass at physiological maturity (Biom), seed yield (Yld), harvest index (HI), number of seeds m-2 (NS), weight of 100 seeds (W100S), pods m-2 (NP), seeds per pod (SPP), branches per plant (NBP), productive branches per plant (NPBP), plant height (PH), total pods (NPtot) and productive nodes per plant (PNP). Means joined by the same letter do not differ significantly with Tukey’s test at 0.05 probability.
When analyzing the biomass production and harvest index, it was observed that the seed yield was positively related to the biomass accumulated at maturity (Figure 2a), in both sowing systems, when increasing the number of plants m-2, the biomass per unit area increased. Evidence in the literature reveals that, in grain crops, yield is mainly explained by changes in biomass production (Lesjak and Calderini, 2017; Woldeselassie and Admasu, 2018).
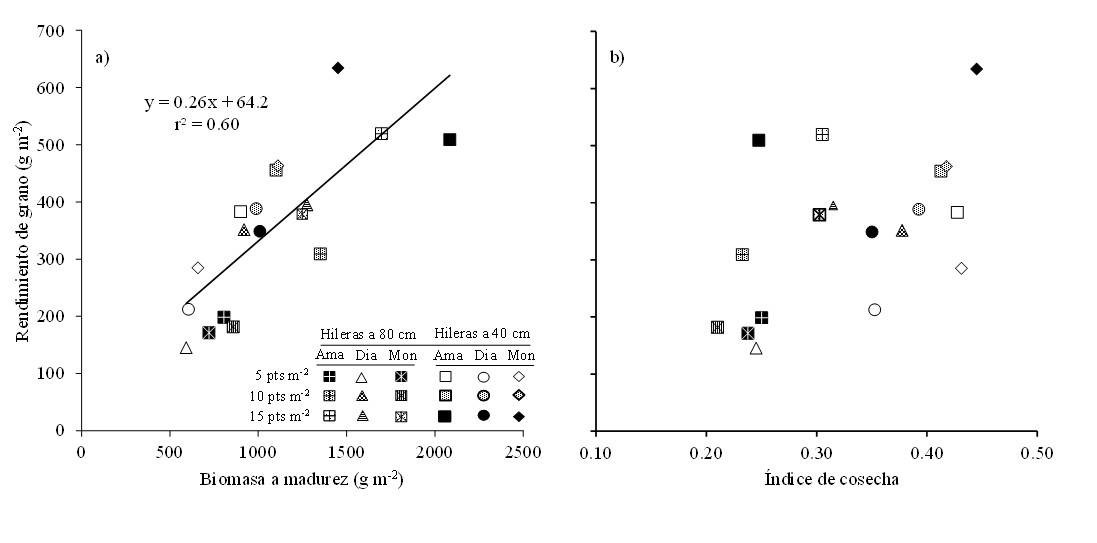
Figure 2a Relationships between grain yield with biomass at maturity (a) and with harvest index (b) for three broad bean genotypes, grown in two distances between rows and three sowing densities in Toluca, State of Mexico.
In most grain crops, yield is strongly related to the number of grains when management practices (genotype, density, fertilization, etc.) are modified (Echarte et al., 2000; Derogar and Mojaddam, 2014). When considering genotypes, densities and distance between rows, grain yield was mainly explained by changes in the number of seeds per unit area (r2= 0.9, p< 0.001) since there was no relationship between yield and individual seed weight.
Increases in plant density manifested themselves in higher seed yield and to a greater extent in the distance between rows of 40 cm. The Monarca cultivar achieved the highest number of seeds per unit area and the highest yield when the population density was 15 plants m-2 (Figure 3).
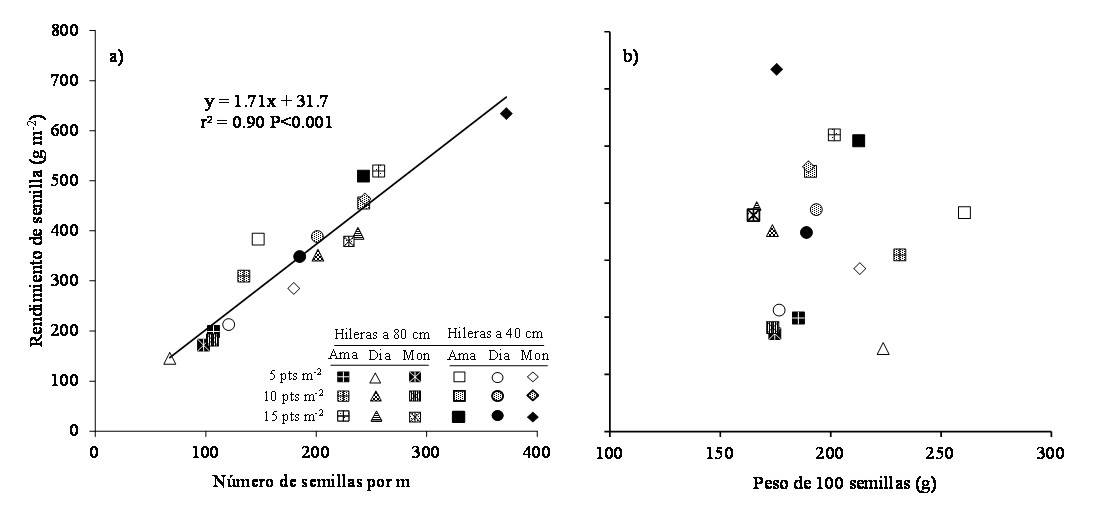
Figure 3 Relationships between seed yield with number of seeds per m2 (a) and with weight of 100 seeds (b) for three broad bean genotypes, grown in two distances between rows and three sowing densities in Toluca, State of Mexico.
The number of pods per unit area was more sensitive to changes in the distance between rows, population density and genotype, strongly explaining the changes observed in the number of seeds m-2 (r2= 0.78, p< 0.01), while the number of seeds per pod slightly explained the changes in the number of seeds m-2 (r2= 0.32, p< 0.05) (Figure 4). Results by researchers indicate that the number of pods is more strongly affected by changes in population density than the number of grains per pod (Derogar and Mojaddam, 2014; Gezahegn et al., 2016). The cultivar with the highest number of pods was Monarca when it was established at 40 cm between rows and with 15 plants m-2.
When jointly analyzing the main physiological and numerical components of yield, two principal components that group 78.4% of the variability of the data set were defined. In the plane formed by these two principal components, the variability of the data set corresponds to yield, number of seeds m-2 and biomass, where biomass correlates with both yield and the number of seeds per unit area, thus giving a variance of 54.3%. The HI was highly correlated with component 2, with a remaining variance of 24.1% (Figure 5).

Figure 4 Relationships between number of seeds m-2 with number of pods m-2 (a) and with number of seeds per pod (b) for three broad bean genotypes, grown in two distances between rows and three sowing densities, in Toluca, State of Mexico.

Figure 5 Multivariate analysis of the principal components for yield generation, for three broad bean genotypes, grown in two distances between rows and three sowing densities in Toluca, State of Mexico.
The weight of 100 seeds was correlated with the principal component 3; however, it did not represent a significant variance. It can also be observed that in quadrants 2 and 3 are the lowest densities (5 plants m-2), which corresponded to low values in the variables evaluated. In the middle part of the plane is the density of 10 plants m-2 and in quadrants 1 and 4 are the high densities (15 plants m-2), which present high values for the variables studied.
In the case of low densities, a higher seed weight is observed for both systems, the harvest index was more related to the reduction in the space between rows, yield and number of seeds is more related to high densities for both distances between rows, while the biomass correlated mostly with the traditional sowing system.
Conclusions
With the distance between rows of 40 cm, greater biomass production and seed yield were obtained, compared to the traditional system (80 cm between rows). Increases in population density showed positive effects on seed yield and its principal components in both distances between furrows. It is observed that the greatest variability in this experiment was due to densities, followed by distances between rows (AS 40 cm) and (TS 80 cm). Similarly, the genotypes showed a differential behavior, with Monarca being the one that showed high seed yield through densities and sowing systems. The best density-cultivar combination was obtained with Monarca and 15 plants m-2 under the traditional system, followed by the Amarilla cultivar in the same density and for the same system.
Acknowledgements
The author Rogelio Araujo Díaz thanks the National Council of Science and Technology (CONACYT) for its acronym in Spanish, for the scholarship that allowed him to finish his Master’s studies in Agricultural Sciences and Natural Resources. The present work was part of the project ‘Ecophysiological attributes of yield and biomass production in grain crops modified by population density and sowing system’ with registration code in UAEMex. 6350/2021SF
REFERENCES
Aldas, M. J. y Jiménez, E. U. 2007. Análisis multivariante aplicado con R. 2da . Ed. Madrid, España. Ediciones Paraninfo, SA. 679 p. [ Links ]
Almeida, F. A. C.; López, B. L.; Fuentes, M. and Castillo, J. E. 1995. Effect of plant density on growth and yield of faba bean (Vicia faba L.) in Mediterranean conditions. In: AEP. Ed. Proceeding of second European conference on grain legumes. 9-13 pp. [ Links ]
Al-Suhaibani, N.; El-Hendawy, S. and Schmidhalter, U. 2013. Influence of varied plant density on growth, yield and economic return of drip irrigate vein (Vicia faba L.). Turkish J. Field Crops. 18(2):185-197. [ Links ]
Bakry, B. A.; Elewa, T. A.; Karamany, M. F. and Tawfik, M. M. 2011. Effect of row spacing on yield and its components of some faba bean varieties under newly reclaimed sandy soil condition. World J. Agric. Sci. 7(1):68-72. [ Links ]
Cárcova, J.; Borrás, L. y Otegui, M. E. 2015. Análisis de la generación del rendimiento: crecimiento, partición y componentes. Producción de granos. Base para su manejo. Ed. Facultad de Agronomía UBA Buenos Aires. 75 p. [ Links ]
Ciampitti, I. A. and Vyn, T. J. 2011. A comprehensive study of plant density consequences on nitrogen uptake dynamics of maize plants from vegetative to reproductive stages. Field Crops Res. 121(1):2-18. [ Links ]
Coelho, J. C. 1987. Density studies on faba bean (Vicia faba). Fabis Newslett. 18(1):22-24. [ Links ]
Confalone, A.; Lizaso, J.; Ruíz, B. y Sau, F. 2011. Modelización de la fenología del haba cv Alameda. Rev. de la Facultad de Cienc. Agr. 43(1):75-84. [ Links ]
Derogar, N.; Mojaddam, M. and Nejad, T. S. 2014. The effect of plant population on growth parameters and seed yield of faba bean. Inter. J. Bios. 4(3):149-157. [ Links ]
Echarte L.; Luque S.; Andrade F. H.; Sadras V. O.; Cirilo A.; Otegui M. E. and Vega C. R. C. 2000. Response of maize kernel number to plant density in Argentinean hybrids released between 1965 and 1993. Field Crops Res. 68(1):1-8. [ Links ]
Estrada, C. R.; Jarillo, J.; Aragón, A. J.; Juárez, D. and Patrón, J. C. 2017. Productividad forrajera de haba bajo diferentes condiciones de manejo. Agron. Costarric. 41(1):95-103. [ Links ]
FAOSTAT. 2019. Food and Agriculture Organization of the United Nations, Rome, Italy. [ Links ]
Gezahegn, A. M.; Tesfaye, K.; Sharma, J. J. and Bele, M. D. 2016. Determination of optimum plant density for faba bean (Vicia faba L.) on Vertisols at Haramaya, Eastern Ethiopia. Cogent Food & Agriculture. 2(1):1-10. http://dx.doi.org/10.1080/23311932.2016.1224485. [ Links ]
Gil, G. H.; Martínez, R. C. G. y Estrada, C. G. 2014. Impacto del sistema de labranza y dosis de nitrógeno en el rendimiento y calidad nutricional de forraje de avena. Rev. Mex. Cienc. Agríc. 5(6):951-964. [ Links ]
González, H. A.; Sahagún, C. J.; Vázquez, L. M.; Rodríguez, J. E.; Pérez, D. J.; Domínguez, L. A; Franco, O. y Balbuena, M. A. 2009. Identificación de variedades de maíz sobresalientes considerando el modelo AMMI y los índices de Eskridge. Agric. Téc. Méx. 35(2):189-200. [ Links ]
Khalil, S. K.; Wahab, A. and Khan, A. Z. 2011. Variation in leaf traits, yield and yield components of faba bean in response to planting dates and densities. Egypt. Acad. J. Biolog. Sci. 2(1):35-43. [ Links ]
Kruk, B.; Satorre, E. H. L. y Otegui, M. E. 2015. Densidad y arreglo espacial del cultivo. Producción de granos. Base para su manejo. Ed. Facultad de Agronomía UBA Buenos Aires. 27 p. [ Links ]
Lesjak, J. and Calderini, D. F. 2017. Increased night temperature negatively affects grain yield, biomass and grain number in Chilean Quinoa. Front. Plant Sci. 8(1):3-52. [ Links ]
López-Bellido, F. J.; López-Bellido, L. and López-Bellido, R. J. 2005. Competition, growth and yield of faba bean (Vicia faba L.). Eur. J. Agron. 23(4)359-378. [ Links ]
Marcelos, H. and Constable, G. A. 1986. Effects of plant density and sowing date on grain yield of faba beans (Vicia faba L.) in Northern New South Wales. Aust. J. Exp. Agric. 26(4):493-496. [ Links ]
Matthews, P. W.; Carpenter, D. J.; Smith, A. and Fettell, N. 2001. Faba bean seeding rates for central and southern New South Wales. In Proceedings of the 10th Australian Agronomy Conference. Hobart: Australian Society of Agronomy. Icarus. 3(1):1-4. [ Links ]
Orozco, N. C.; Pérez, L. D. J.; González, H. A.; Franco, M. O.; Gutiérrez, R. F.; Rubí, A. M.; Castañeda, V. A. and Balbuena, M. A. 2013. Identificación de poblaciones sobresalientes de haba colectadas en el Estado de México. Rev. Mex. Cienc. Agríc. 4(6):921-932. [ Links ]
Palaniswamy, U. R. and Palaniswamy, K. M. 2006. Handbook of statistics for teaching and research in plant and crop science. The Harworth, Press, Inc., New York. 624 p. [ Links ]
Salas, C. 2008. ¿Por qué comprar un programa estadístico si existe? Ecología austral. 18(2):223-231. [ Links ]
SIAP. 2019. Anuario estadístico de la producción agrícola. http://infosiap.siap.gob.mx/aagricola-siap-gb/ientidad/index.jsp. [ Links ]
Tamrat, W.; Loha, G. and Habte, A. 2019. Effect of plant density on yield components and yield of Faba bean (Vicia Faba L.) varieties at Wolaita Sodo, Southern Ethiopia. J. Nat. Sci. Res. 9(5):47-55. [ Links ]
Thalji, T. 2010. Effect of plant density on seed yield and agronomic characters of faba bean (Vicia faba L.) under greenhouse conditions. Bio. Res. 7(1):22-25. [ Links ]
Woldeselassie, M. T. and Admasu, D. 2018. Effect of different sowing dates and varieties on growth and yield of lentil (Lens culinaris Medikus) in the highland vertisols of north Shewa, Ethiopia. Malaysian J. Med. Biol. Res. 5(2):117-122. [ Links ]
Zhang S.; Sadras, V.; Chen, X. and Zhang, F. 2014. Water use efficiency of dryland maize in the Loess Plateau of China in response to crop management. Field Crops Res. 163(1):55-63. [ Links ]
Received: November 01, 2022; Accepted: January 01, 2023
 Este es un artículo publicado en acceso abierto bajo una licencia Creative Commons
