


Serviços Personalizados
Journal
Artigo
 texto em
  Inglês (pdf)
 Artigo em XML
 Referências do artigo
 Enviar este artigo por email
Indicadores
-
 Citado por SciELO
 -
 Acessos
Links relacionados
-
 Similares em
SciELO
Similares em
SciELO
Compartilhar

 Permalink
Revista mexicana de ciencias agrícolas
versão impressa ISSN 2007-0934
Rev. Mex. Cienc. Agríc vol.12 no.7 Texcoco Set./Nov. 2021 Epub 22-Mar-2022
https://doi.org/10.29312/remexca.v12i7.2276
Research notes
Evaluation of two procedures for color measurement in pigmented maize grains
1Campo Experimental Centro Altos de Jalisco-INIFAP. Carretera Tepatitlán-Lagos de Moreno km 8, Tepatitlán de Morelos, Jalisco. México. CP. 47600. (salinas.yolanda@inifap.gob.mx; ramirez.joseluis@inifap.gob.mx; alemán.ivone@inifap.gob.mx; bautista.edgardo@inifap.gob.mx).
The maize grain with anthocyanin-type pigments does not present a homogeneous coloration on its surface, so the way the grain is presented to take the color reading affects the results. In this work, two ways of taking the color reading in samples of grain of different colors were compared. Grain samples of purple blue (PBL), cherry red (CR), brick red (BR), yellow (YE) and white (WHI), the latter as a control. The two procedures for measuring the coloration of the grain were: mounted on a base of plasticine, simulating the way it is on the cob (GMP) and grain in tray (GTR). The color was determined with a Hunter-Lab Mini Scan colorimeter. In the grain colors PBL, CR and BR, the procedure for taking the color reading affected the color variables. In PBL maize, the differences were present both in the luminosity and in hue and chroma, in the CR and BR, the hue variable was the most affected. In the YE and WHI maize grains, the values of luminosity, hue and chroma were numerically close between the two ways of taking the color reading in the grain. According to the results, in the maize PBL, CR and BR, the color should be taken in the GMP, to obtain values in the color variables, which are related to the visual appreciation of color, while in the maize with grain YE and WHI, the procedure for taking the reading, although it affects the color variables, the hue value corresponds to the visual appreciation of the color.
Keywords: color reading; colorimeter; hue and chroma; luminosity
El grano de maíz con pigmentos tipo antociano, no presenta una coloración homogénea en su superficie, por lo que la forma de presentar el grano para tomar la lectura de color afecta los resultados. En este trabajo se compararon dos formas de tomar la lectura de color en muestras de grano de colores diversos. Se emplearon muestras de grano de color azul morado (AZM), rojo cereza (RC), rojo ladrillo (RL), amarillo (AM) y blanco (BCO), este último como testigo. Los dos procedimientos para medir la coloración del grano fueron: montado sobre una base de plastilina, simulando como se encuentra en la mazorca (GMP) y grano en charola (GCH). El color se determinó con un colorímetro Hunter-Lab Mini Scan. En los colores de grano AZM, RC y RL el procedimiento para tomar la lectura de color afectó las variables de color. En los maíces AZM, las diferencias se presentaron tanto en la luminosidad, como en hue y croma, en los RC y RL fue la variable hue la más afectada. En los maíces de grano AM y BCO, los valores de luminosidad, hue y croma fueron numéricamente cercanos entre las dos formas de tomar la lectura de color en el grano. De acuerdo con los resultados, en los maíces AZM, RC y RL el color debería tomarse en el GMP, para obtener valores en las variables de color, que se relacionan con la apreciación visual de color, en tanto que en los maíces de grano AM y BCO el procedimiento para tomar la lectura, si bien afecta las variables de color, el valor de hue corresponde con la apreciación visual del color.
Palabras clave: colorímetro; hue y croma; lectura de color; luminosidad
Color is a physical attribute of food or products, which can be detected visually, as the human eye is able to differentiate millions of colors. However, this assessment lacks objectivity and may vary according to the individual’s perception. Therefore, the use of instruments suitable for measuring color based on objective variables is elementary to establish characterizations and comparisons between products.
The objective determination of the color of any solid or liquid product is carried out by means of a colorimeter, with which the variables are obtained: luminosity (L*, 0%= white, 100%= black), a* (green in negative values and red in positive values), and b* (yellow in positive values and blue in negative values). From a* and b*, the hue (h°) and the saturation index or chroma (C*) are calculated (McGuire, 1992). Visual color appreciation is highly related to objectively determined hue (Jha, 2010; Owens et al., 2019). The way in which the sample is presented to perform the reading influences the values of the color variables. In solid products, whether translucent or opaque, color uniformity on their surface is important. If this is irregular, the area in which the reading is taken will influence the color data obtained (Wrolstad and Smith, 2010).
The maize grain is integrated by the macrostructures of pericarp, endosperm, germ and pedicel. The pericarp surrounds the endosperm and the germ. In pigmented maize grains with the presence of polyphenols in the aleurone layer, it is common for the germ to lack pigment (Salinas et al., 1999), so this area is seen in a different tone from the rest of the grain.
This situation causes that when the color measurement is carried out on the surface of the grains, the hue values in red or purple-blue grain maize are similar to those associated with a yellow or greenish yellow tone (Espinosa-Trujillo et al., 2006).
Currently, there is a renewed interest in the use and exploitation of native maize, which presents wide diversity in color, that is necessary to characterize in an objective and reproducible way, so the objective of the work was to evaluate two procedures (grain in tray and grain on a base of plasticines) to take the color reading in the grain of maize with different grain colors, and based on the results, define the most appropriate way so that the hue values obtained correspond to the visual appreciation of the color in pigmented maize grain.
It was used 20 accessions of maize with purple/blue (PBL) grain of five races of maize in which this grain color is common, 14 accessions of maize with cherry red (CR) grain of four races in which this color is common, seven accessions of brick red (BR) grain of five races that present these colorations, seven improved yellow grain (YE) maize (commercial and experimental), and seven white grain maize (three commercial hybrids and four accessions of the Conical and Chalqueño races). Accessions were collected from different origins, but in all cases the color data was obtained in samples of recent harvest; the improved material came from INIFAP’s Centro Altos de Jalisco Experimental Field Maize Program.
The samples of white maize were incorporated into the study as controls, being the most predominant color and of greater uniformity of color in its surface. The moisture content of the samples at the time of measurement was between 11 and 12.5%. For the determination of the color, a Hunter Lab MiniScan colorimeter was used, in CIELab scale, with illuminant 65 and an observation angle of 10º. For grain color reading, the sample was presented in two forms: A) grain sample mounted on a gray plasticine base (GMP), simulating the way the grain is on the cob (Figure 1A), B) grain sample (30 g) contained in an aluminum tray (GTR) (Figure 1B).
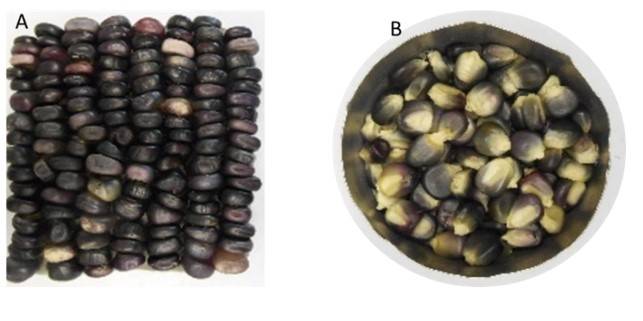
Figure 1 Way in which the maize grain sample was presented to take the color reading. A) grain mounted on a base of plasticine; and B) grain in tray.
In each case, six readings were made (this number was defined to have a standard error of the mean ≤5%) with the equipment, at different points on the sample surface. Luminosity values (L*), a* and b* were obtained. From the values of a* and b*, the variables of hue (h°) and color saturation index (Chroma) were calculated (McGuire, 1992). The data for each grain color were analyzed by comparison of means between the two procedures for taking the color reading, the number of samples analyzed for each grain color was considered as repetitions.
In PBL grain maize, the luminosity values (L*) were lower and of greater variability in the GMP, in relation to the GTR, which means that the colorimeter detected the GTR as lighter than the GMP. The average value of this variable was lower when the color was taken in the GMP in relation to the GTR (Table 1). In the variable a*, the GMP showed values from -0.63 to 6.28, while in the GTR, it showed only positive values (0.41 to 3.62). This means that, in the GMP, the colorimeter detected tones from green (-0.63) to red (6.28), while in the GTR, it only detected red tones when presenting positive values (Jha, 2010).
Table 1 Values of the color variables of maize grains obtained with two procedures for taking the reading.
| Grain color | Statistical criterion | Color variables | ||||||||
| L* (%) | a* | b* | ||||||||
| GMP | GTR | GMP | GTR | GMP | GTR | |||||
| Purple blue (n= 20) | Minimum value | 16.91 | 39.32 | -0.63 | 0.41 | -1.02 | 5.96 | |||
| Maximum value | 31.21 | 49.39 | 6.28 | 3.62 | 2.78 | 13.91 | ||||
| Mean | 25.18 b | 44.39 a | 2.81 a | 1.72 b | 0.73b | 10.19a | ||||
| CV (%) | 14.8 | 71.4 | 149.8 | 6.5 | 50.9 | 22.9 | ||||
| HSD | 2.13 | 1.01 | 1.17 | |||||||
| Cherry red (n= 14) | Minimum value | 26.59 | 31.42 | 11.57 | 7.0 | 5.32 | 9.3 | |||
| Maximum value | 46.52 | 55.94 | 20.03 | 17.32 | 13.37 | 16.18 | ||||
| Mean | 34.41 b | 42.66 a | 17.12 a | 11.26 b | 9.14 b | 12.97 a | ||||
| CV (%) | 19.9 | 14.3 | 27.0 | 15.8 | 29.6 | 17.1 | ||||
| HSD | 5.27 | 2.27 | 1.82 | |||||||
| Brick red (n= 7) | Minimum value | 18.5 | 27.34 | 14.24 | 13.14 | 7.04 | 11.69 | |||
| Maximum value | 26.61 | 40.71 | 23.01 | 23.43 | 18.93 | 22.15 | ||||
| Mean | 22.93 b | 35.23 a | 19.05 a | 16.98 a | 11.87 b | 17.5 a | ||||
| CV (%) | 18.2 | 17.6 | 33.3 | 13.7 | 21.1 | 20.8 | ||||
| HSD | 5.24 | 4.04 | 4.42 | |||||||
| Yellow (n= 7) | Minimum value | 57.3 | 60.24 | 7.65 | 11.02 | 41.04 | 36.2 | |||
| Maximum value | 70.81 | 63.5 | 19.6 | 16.4 | 55.7 | 46.6 | ||||
| Mean | 63.30 a | 61.94 a | 13.78 a | 13.33 a | 49.92 a | 40.71 b | ||||
| CV (%) | 8.4 | 39.6 | 10.3 | 2.2 | 12.6 | 10.3 | ||||
| HSD | 4.52 | 4.71 | 5.46 | |||||||
| White (n= 4) Native | Minimum value | 60.1 | 57.22 | 3.51 | 3.59 | 19.55 | 18.87 | |||
| Maximum value | 65.92 | 62.14 | 11.01 | 9.47 | 45.55 | 22.35 | ||||
| Mean | 63.02 a | 60.4 a | 6.64 a | 5.52 a | 33.05 a | 20.27 a | ||||
| CV (%) | 4.4 | 67.5 | 51.5 | 3.7 | 75.2 | 8.5 | ||||
| HSD | 4.34 | 5.4 | 14.2 | |||||||
| White (n= 3) Improved | Minimum value | 73.9 | 68.6 | 1.2 | 2.7 | 20.7 | 24.4 | |||
| Maximum value | 74.7 | 70.7 | 1.8 | 2.8 | 22.3 | 25.9 | ||||
| Stocking | 74.38 a | 69.65 b | 1.46 b | 2.75 a | 21.59 b | 25.24 a | ||||
| CV (%) | 0.6 | 18.6 | 3.6 | 1.5 | 3.1 | 3 | ||||
| HSD | 1.86 | 0.46 | 1.73 | |||||||
Means with equal letters in rows, for each color parameter, are not statistically different (MSD, 0.05). HSD= honestly significant difference (p≤ 0.05).
The native WHI-grain maize had equal values of the color variables between the GMP and GTR, so it is not possible to take the reading in GTR and avoid the work of putting it on plasticine. In improved WHI maize, which are of the dent type, the floury fraction of the endosperm is concentrated in the crown of the grain, so when taking the color reading in the GMP, the L* values are higher than when taken in the GTR. In a* and b*, on the other hand, the values were higher in the GTR in relation to the GMP.
With the variable b*, in the GMP the variability was from -1.02 (blue tone) to slightly yellow (2.78), while for the GTR, the variability was greater (5.96 to 13.91), but in the yellow tone. Statistical differences were present for a* and b* between the GMP and the GTR. In CR grain maize, something similar to that observed in PBL grain maize occurred. According to the color variables, the grain is darker (lower value of L*) and red (lower value of b*) (Wrolstad and Smith, 2010) when the reading is taken in the GMP than when taken in the GTR. In the three variables of color, there was a statistical difference (p< 0.05) between the two ways of presenting the grain to take the color reading.
In BR grain maize, L* and the value of b* were lower (p< 0.05) in the GMP in relation to the GTR, so they were seen as darker. In YE grain maize, the average values of the variables L* and a* were equal (p< 0.05) between the GMP and the GTR. The variable b* was higher in the GMP in relation to the GTR, which means greater yellow tone in the former.
Figure 2 presents the hue-chroma results, which represent the chromaticity (Jha, 2010) of the samples analyzed for each grain color, with the two procedures in which the reading was taken. In PBL maize, a clear difference in the hue values between the two procedures for taking the color was observed (Figure 2A). In the GMP, the values are related to purple-blue and purple-red tones, while, in the GTR, they are associated with yellow tones.
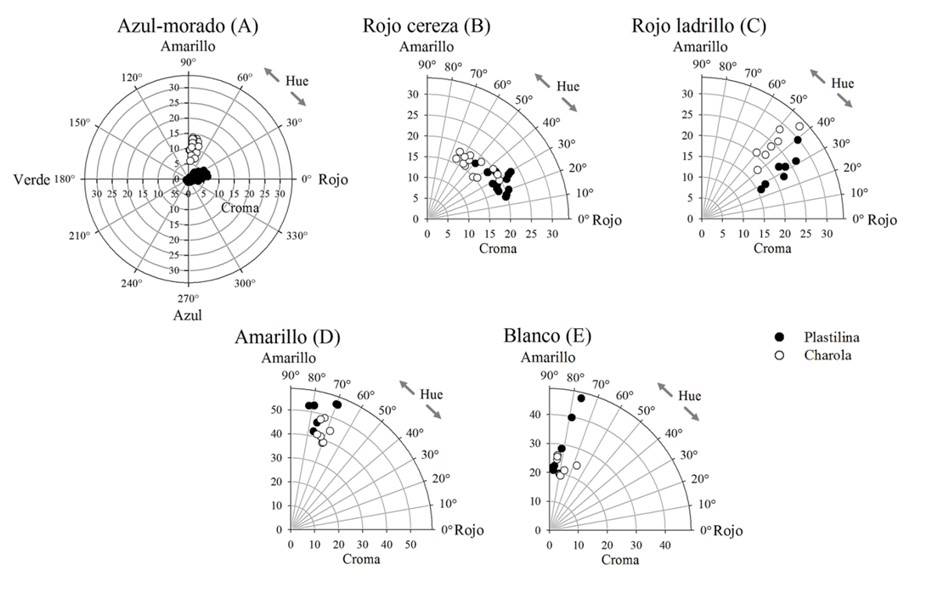
The chroma values in the GMP were less than 7, while in the GTR, they varied between 6 and 14. This means greater presence of gray tones in the GMP in relation to the GTR. Of the chromaticity variables, hue is the most associated with visual color perception (Jha, 2010; Wrolstand and Smith, 2010), so the results in this variable can serve as a guide to know if the color is determined in the right way. Espinosa-Trujillo et al. (2006) reported average hue and chroma values of 108.5 ±9.7º and 5.8 ±1.5, in that order, in 18 populations of maize with blue grain. These values correspond to a greenish-yellow tone, with a low color saturation index.
The authors took the color on a sample of grains contained in a tray. In purple-grained maize, with the pigment concentrated in the pericarp, the hue values in 20 outstanding lines varied between 10.2 and 73.5º, which according to the authors did not correspond to the observed visual color, which was intense purple to purple (Mendoza-Mendoza et al., 2017). This latest study does not mention the way the grain was presented to take the reading with the colorimeter.
In CR grain maize, the differences in the procedure for taking the reading appeared in the hue values. When taken in the GMP, hue was associated with a red tone, while when taken in the GTR, it was associated with a yellow orange tone (Figure 2B). In the chroma values, the data obtained between the two ways of taking the reading were close, being located between 15 and 20.
In BR grain maize, the hue values were slightly lower, and therefore associated with redder tones for the GMP than the GTR, whose hue values correspond to an orange tone (Figure 2C). The hue and chroma values reported by Espinosa-Trujillo et al. (2006) for red grain maize were 75.7 ± 7.1º and 5.7 ±1.1º, respectively. These values are similar to those obtained in CR maize with the GTR procedure and are associated with orange-yellow tones.
In YE grain maize, no clear difference in the chromaticity variables was observed between the two procedures for measuring the color of the grain (GMP and GTR). Hue values varied between 69.3 and 81.6º in the GMP, and between 68.3 and 74.8º in the GTR, which are similar to the average value of 70 ±0.75º reported by Vázquez-Carrillo et al. (2011) in six hybrids with this grain coloration. In WHI grain maize, where both native and hybrid were included, the hue value was similar between the two ways of taking the reading. The samples that soared in their chroma values, in the GMP, correspond to native maize, which presented among them wide variations in the values of a* and b*, and which are rather creamy in color (Table 1).
Conclusions
In the purple-blue, cherry-red, and brick-red grain colors, the procedure for taking the color reading on the grain affected the color parameters. The hue values obtained when the reading was taken in the grain on a base of plasticine corresponded to the visual color of the grain, so in this maize, it is recommended to take the color reading on the surface of grains mounted in plasticine, when the cob is no available. In yellow and white grain maize, the hue was similar between the two procedures for taking the color, so it can be performed with either procedure.
Literatura citada
Espinosa-Trujillo, E.; Mendoza-Castillo, M. C. y Castillo-González, F. 2006. Diversidad fenotípica entre poblaciones de maíz con diferentes grados de pigmentación. Rev. Fitotec. Mex. 29(2):19-23. [ Links ]
Jha, S. N. 2010. Colour measurements and modeling. In: nondestructive evaluation of food quality: theory and practice, Shyam N Jha.. Ed. Springer. 23-24 pp. [ Links ]
McGuire, R. G. 1992. Reporting of objective color measurements. HortScience. 27(12):1254-1255. [ Links ]
Mendoza-Mendoza, C. G.; Mendoza-Castillo, M. C.; Delgado-Alvarado, A.; Castillo-González, F.; Kato-Yamakake, T. A. y Cruz-Izquierdo, S. 2017. Antocianinas totales y parámetros de color en líneas de maíz morado. Rev. Fitotec. Mex. 40(4):471-479. [ Links ]
Owens, B. F.; Mathew, D.; Diepenbrock, C. H.; Tiede, T.; Wu, D.; Mateos-Hernandez, M.; Gore M. A. and Rocheford, T. 2019. Genome-Wide association study and pathway-level analysis of kernel color in maize. G3 Genes Genomes Genetics. 9(6):1945-1955. https://doi.org/ 10.1534/g3.119.400040. [ Links ]
Salinas, M. Y.; Soto, H. M.; Martínez, B. F.; González, H. V. y Ortega, P. R. 1999. Análisis de antocianinas en maíces de grano azul y rojo provenientes de cuatro razas. Rev. Fitotec. Mex. 22(2):161-174. [ Links ]
Vázquez-Carrillo, G.; García-Lara, S.; Salinas-Moreno, Y.; Bergvinson, D. J. and Palacios-Rojas, N. 2011. Grain and tortilla quality in landraces and improved maize grown in the highlands of Mexico. Plant Foods Human Nutr. 66(2):203-208. https://doi.org/10.1007/s11130-011-0231-7. [ Links ]
Wrolstad, E. R. and Smith, D. E. 2010. Color analysis. In: Food analysis. Nielsen, S. S. (Ed.). Fourth edition. Springer. 575-586 pp. http://dx.doi.org/10.1007/978-1-4419-1478-1. [ Links ]
Received: September 01, 2021; Accepted: October 01, 2021
 Este es un artículo publicado en acceso abierto bajo una licencia Creative Commons
