


Serviços Personalizados
Journal
Artigo
 texto em
  Inglês (pdf)
 Artigo em XML
 Referências do artigo
 Enviar este artigo por email
Indicadores
-
 Citado por SciELO
 -
 Acessos
Links relacionados
-
 Similares em
SciELO
Similares em
SciELO
Compartilhar

 Permalink
Revista mexicana de ciencias agrícolas
versão impressa ISSN 2007-0934
Rev. Mex. Cienc. Agríc vol.12 no.6 Texcoco Ago./Set. 2021 Epub 21-Mar-2022
https://doi.org/10.29312/remexca.v12i6.2582
Articles
Productivity of fifteen traditional cultivars of Phureja potato in eight different environments
1National Autonomous University of Chota. Jr. Los Andes 184, Barrio San Martín Cajamarca, Peru. CP. 054. (aseminarioc@unach.edu.pe).
2La Molina National Agrarian University. Street Madrid 116, Department 101, Lima, Peru. CP. 18. Tel. 51 971129290. (apablohuerta@gmail.com).
3National University of Cajamarca. Jr. Los Fresnos 139, Urb. El Ingenio, Cajamarca, Peru. (vvarce3@gmail.com).
4National University of Cajamarca. Jr. Rafael Olascoaga 141, Urb. Horacio Cevallos, Cajamarca, Peru. (jfseminario@yahoo.es).
5North Private University. Av. The Army num. 920, Trujillo, La Libertad, Peru. CP. 1309. Tel. 51 948673737. (mahonac@hotmail.com).
6University of Lleida. Square by Victor Siurana 1. Lleida, Spain. CP. 25003. (antoniohuerta2010@gmail.com).
The productivity of fresh tubers and dry matter of 15 traditional potato cultivars of the Phureja group from Cajamarca was evaluated, in eight different environments. Sowings were carried out in the valley of Cajamarca. The randomized complete block design was used, with 15 treatments and three repetitions. The sowing was carried out at 0.9 m between furrows and 0.4 m between plants. 5 t ha-1 of worm humus and a compound fertilizer (15-24 -14 of N, P and K) at the rate of 300 kg ha-1 were applied. Eight plants per treatment were taken at harvest and the variables related to yield were evaluated. Significant statistical differences were found between cultivars for the variables: total weight of tubers, weight of commercial tubers, total number of tubers, number of commercial tubers, plant height, number of stems and dry matter. The cultivars ‘Chachapoyana’, ‘Montañera’, ‘Blanca’ and ‘Shoga’ were the best in fresh tuber yield and the cultivars ‘Piña amarilla’, ‘Shoga’ and ‘Porpora’ the best in dry matter. The environments presented significant statistical differences for the variables NTT, NTC, AP and NT.
Keywords Andean; ecology; production
Se evaluó la productividad de tubérculos frescos y de materia seca de 15 cultivares tradicionales de papa del grupo Phureja de Cajamarca, en ocho ambientes distintos. Las siembras se realizaron en el valle de Cajamarca. Se usó el diseño de bloques completos al azar, con 15 tratamientos y tres repeticiones. La siembra se realizó a 0.9 m entre surcos y 0.4 m entre plantas. Se aplicó 5 t ha-1 de humus de lombriz y un fertilizante compuesto (15-24 -14 de N, P y K), a razón de 300 kg ha-1. A la cosecha se tomaron ocho plantas por tratamiento y se evaluaron las variables relacionadas con el rendimiento. Se encontraron diferencias estadísticas significativas entre cultivares para las variables: peso total de tubérculos, peso de tubérculos comerciales, número total de tubérculos, número de tubérculos comerciales, altura de planta, número de tallos y materia seca. Los cultivares ‘Chachapoyana’, ‘Montañera’, ‘Blanca’ y ‘Shoga’, fueron los mejores en rendimiento de tubérculos frescos y los cultivares ‘Piña amarilla’, ‘Shoga’ y ‘Porpora’, los mejores en materia seca. Los ambientes presentaron diferencias estadísticas significativas paras las variables NTT, NTC, AP y NT.
Palabras clave andina; ecología; producción
Introduction
The potato (Solanum tuberosum L.) of the Phureja group is important in Peru and other Andean countries for its attributes for genetic improvement, the market and fresh and processed consumption (Piñeros, 2009; Rozo and Ramírez, 2011). Due to its comparative advantages, this potato is the subject of studies from different approaches.
In recent years, studies have been especially aimed at knowing its advantages from the physical-chemical point of view (content of dry matter, protein, starch, total sugars and reducing sugars) (Cerón-Lasso et al., 2018). Other studies assess the content of secondary metabolites (carotenoids, phenols and anthocyanins), vitamin C and the antioxidant power of this set of compounds (Bonierbale et al., 2009; Díaz et al., 2014; Molina et al., 2015; Parra-Galindo et al., 2016). Macro and micronutrients have also been studied, especially Ca, Fe and Zn (Peña et al., 2015). Similarly, their advantages for the food industry were studied (Rivera et al., 2011; Cruz et al., 2016; Alarcón et al., 2016) and in particular, starches (Martínez et al., 2015).
Colombia is the country that has best taken advantage of this potato, both for the domestic and foreign markets. A few years ago, its exports in various derivatives amounted to more than 1 000 t year-1. In Peru, its benefits have not been taken advantage of, on the contrary, this potato is disappearing in an accelerated way (Zimmerer, 1991; Haan, 2009; Seminario and Zarpán, 2011). However, the explorations of recent years indicate that, in northern Peru, particularly in Cajamarca, there are various cultivars that differ mainly by the shape, color and size of the tubers and the shape and color of the flowers. These are planted in small areas by traditional farmers, for self-consumption and market purposes (Seminario and Zarpán, 2011; Seminario et al., 2019).
Studies on the yield of fresh tubers of the Phureja potato vary widely. Thus, for example, with traditional cultivars -not improved-, reported yields are 11.8 to 23 t ha-1 (Bautista et al., 2012), 13.9 to 21.9 t ha-1 (Gómez-García, 2017) and 6.2 to 27.4 t ha-1 (Seminario et al., 2017). On the other hand, with cultivars improved through crosses and selection, higher yields are mentioned. Thus, 35 to 41.8 t ha-1 (León and Monteros, 2010) 31.7 to 34.3 t ha-1 (Santa María et al., 2010) and 32.9 to 37.4 t ha-1 (Rodríguez et al., 2014).
For this reason, it is important to study the productive potential of the cultivars of each region, to select those that stand out for this characteristic and to carry out studies on the best use in fresh and processed and their intervention in the generation of improved varieties. In this sense, the objective of this research was to evaluate the components of the yield and productivity of fifteen traditional cultivars of the Phureja group from Cajamarca, in eight different environments, in the same locality, but in different years and months of sowing.
Materials and methods
Fifteen native cultivars of the Phureja group (Table 1) from the work collection of the Andean Roots and Tubers Program of the National University of Cajamarca (PRTA-UNC) were used. These cultivars come from the Cajamarca region, they were morphologically characterized and are formally cataloged (Seminario et al., 2019).
Table 1 Potato cultivars of the Phureja group from Cajamarca, used in research.
| Cultivar | Abbreviation | Origin | Tuber shape |
|---|---|---|---|
| ‘Chachapoyana’ | Cha | Bambamarca | Oblong |
| ‘Montañera’ | Mon | Bambamarca | Round |
| ‘Blanca’ | Bla | Bambamarca | Compressed |
| ‘Shoga’ | Sho | Jesús | Oblong |
| ‘Piña amarilla’ | Pam | Jesús | Compressed |
| ‘Mulla’ | Mul | Jesús | Elliptic |
| ‘Poropora’ | Por | Bambamarca | Oblong |
| ‘Limeña’ | Lim | Chota | Compressed |
| ‘Amarila mahuay’ | Amh | Jesús | Compressed |
| ‘Limeña hachuma’ | Lih | Jesús | Compressed |
| ‘Huagalina’ | Hua | Hualgayoc | Elliptic |
| ‘Amarilla’ | Ama | Jesús | Compressed |
| ‘Yuquilla’ | Yuq | Jesús | Elliptic |
| ‘Huevo de ruco’ | Hur | Bambamarca | Obovate |
| ‘Huamantanga’ | Hut | La Encañada | Ovate |
The soil where the sowing was carried out corresponds to a lot of approximately 0.7 ha, located in the Cajamarca Valley, at 2 650 masl. In this lot, sowings were carried out in a crop rotation system that includes yacón, potato, rest, potato, yacón, rest. The soil is of clay loam texture and the averages of eight samples taken in different years and points indicated that the pH is neutral to slightly acidic, the content of organic matter (MO) is low and those of phosphorus (P) available and potassium (K) available were from medium to high (Table 2).
Table 2 Values of pH, MO, P available and K available of the soil where the sowings were carried out.
| No. | pH | MO | P available | K available | Laboratory/Code |
|---|---|---|---|---|---|
| 1 | 7.3 | 3.8 | 13.8 | 213.3 | Tec. Des. Agr. JD. SRL.JD15-0122 |
| 2 | 6.9 | 4 | 11.8 | 239.5 | Tec. Des. Agr. JD. SRL. JD1700 |
| 3 | 6.6 | 3.2 | 23.8 | 295 | Est. Exp. BI, INIA. SU0287-EEBI |
| 4 | 6.4 | 1.5 | 30.5 | 300 | Est. Exp. BI, INIA. SU1253-EEBI |
| 5 | 6.2 | 2.1 | 21.5 | 290 | Est. Exp. BI, INIA. SU0787-EEBI |
| 6 | 7.5 | 3 | 15.2 | 237 | UNALM, 9431. |
| 7 | 5.7 | 2.4 | 19 | 265 | Est. Exp. BI, INIA. SU1252 - EEBI. |
| 8 | 6.6 | 2.4 | 35.5 | 310 | Est. Exp. BI, INIA. SU0794-EEBI. |
| Average | 6.6 | 2.8 | 21.4 | 268.7 |
Tec. Des. Agr= Technology and Agricultural Development. Est. Exp. BI, INIA= Baños del Inca Experimental Station, National Institute of Agrarian Innovation. UNALM= National Agrarian University La Molina.
For eight years, the 15 cultivars were planted on different dates (Table 3). The basic climatic variables and the season (rain/dry) under which the sowings were carried out are presented in Table 4. The most notable difference between seasons is the amount of rain, however, this lack of rain in the dry season sowings was overcome with the application of gravity irrigation. The difference in average temperature was 0.55 °C, in minimum temperature was 2.6 °C and in hours of sunlight of 1.7 h.
Table 3 Sowing and harvest dates and trial season.
| No. | Sowing date | Harvest date | Season |
|---|---|---|---|
| 1 | 20-12-10 | 18-04-11 | Rain |
| 2 | 30-04-11 | 03-09-11 | Dry |
| 3 | 28-11-11 | 10-04-12 | Rain |
| 4 | 25-05-12 | 07-10-12 | Dry |
| 5 | 01-09-12 | 09-01-13 | Dry/rain |
| 6 | 25-06-14 | 12-11-14 | Dry |
| 7 | 25-11-15 | 31-03-16 | Rain |
| 8 | 27-07-17 | 05-12-17 | Dry/rain |
Table 4 Values of the basic climatic variables during the months and years in which the sowing was carried out.
| Variable | Sowing 1: 2010 | Sowing 2: 2011 | Sowing 3: 2011 | Sowing 4: 2012 | |||||||||||||||
|---|---|---|---|---|---|---|---|---|---|---|---|---|---|---|---|---|---|---|---|
| Jan- 2011 |
Feb- 2011 |
Mar- 2011 |
Apr- 2011 |
May- 2011 |
Jun- 2011 |
Jul- 2011 |
Aug- 2011 |
Dec- 2011 |
Jan- 2012 |
Feb- 2012 |
Mar- 2012 |
Jun- 2012 |
Jul- 2012 |
Aug- 2012 |
Sep- 2012 |
||||
| Pp (mm) | 76.6 | 73.3 | 125.2 | 102 | 16.7 | 0.4 | 8.3 | 0 | 110.6 | 154.2 | 155.3 | 127.8 | 0.9 | 0 | 2.6 | 19 | |||
| T °C | 14.6 | 14.2 | 13.9 | 14.4 | 14.4 | 14.2 | 13.9 | 14.4 | 14.9 | 14.2 | 14.4 | 15 | 13.6 | 13.8 | 14.2 | 14.6 | |||
| Tmax (°C) |
21 | 20.8 | 20.2 | 20.9 | 21.7 | 21.7 | 21.2 | 22.2 | 21 | 20.9 | 20.6 | 21.3 | 21.6 | 22.0 | 22.1 | 21.9 | |||
| Tmin (°C) |
9.1 | 8.5 | 8.5 | 9.4 | 6.6 | 6.1 | 5.9 | 6 | 9.8 | 7.6 | 9.3 | 9.9 | 5 | 4.8 | 5.5 | 6.6 | |||
| HR (%) | 71 | 77 | 72 | 70 | 62 | 61 | 62 | 60 | 67 | 64 | 68 | 71 | 63 | 58 | 57 | 62 | |||
| Hours of sunlight |
4.5 | 4.1 | 3.5 | 5.1 | 5.8 | 6.6 | 6.4 | 8.3 | 4.7 | 5 | 5.5 | 4.1 | 8 | 7.8 | 8.7 | 5.8 | |||
| Variable | Sowing 5:2012 | Sowing 6:2014 | Sowing 7: 2015 | Sowing 8:2017 | |||||||||||||||
| Sep- 2012 |
Oct- 2012 |
Nov- 2012 |
Dec- 2012 |
Jun- 2014 |
Aug- 2014 |
Sep- 2014 |
Oct- 2014 |
Dec- 2015 |
Jan- 2016 |
Feb- 2016 |
Mar- 2016 |
Apr- 2017 |
Sep- 2017 |
Oct- 2017 |
Nov- 2017 |
||||
| Pp (mm) | 19 | 83 | 120 | 58.9 | 1.9 | 3.8 | 28.5 | 26.6 | 39.5 | 27 | 85.3 | 12.3 | 20.9 | 21.5 | 65.3 | 63.2 | |||
| T °C | 14.6 | 15 | 15.4 | 15.3 | 14.4 | 14.3 | 9.7 | 15.4 | 16.5 | 16.5 | 16.4 | 16.2 | 14.5 | 15.3 | 15.7 | 15.7 | |||
| Tmax (°C) |
21.9 | 21.2 | 21.6 | 22.1 | 22.3 | 21.5 | 21.9 | 22.4 | 22.9 | 23.7 | 22.3 | 22.5 | 22 | 21.1 | 22.5 | 23.2 | |||
| Tmin (°C) |
6.6 | 9.5 | 10.2 | 9 | 5.8 | 5.9 | 7.6 | 8.7 | 10.4 | 10.5 | 11.8 | 10.6 | 6.5 | 8.3 | 8.8 | 8.4 | |||
| HR (%) | 62 | 67 | 66 | 62 | 57 | 55 | 60 | 57 | 67 | 69 | 70 | 69 | 60 | 54 | 54 | 58 | |||
| Hours of sunllight |
5.8 | 4.7 | 5.6 | 6.3 | 7.9 | 6.7 | 5.6 | 5.1 | 4.7 | 6.8 | 4 | 4 | 7.3 | 5.2 | 6.5 | 6.5 | |||
Every four columns correspond to the four months (abbreviated by the first letter) of each sowing. T °C= corresponds to average daily temperature. The number of each sowing corresponds to the sowing number in Table 3. In gray the sowings in dry season. Source: Augusto Weberbauer Meteorological Station (2 650 masl), agreement UNC-SENAMHI.
In each year’s sowing, each cultivar occupied a furrow with 10 plants. In this way, each sowing (in a different environment) constitutes a block or repetition. The experimental design of randomized complete blocks was used, with 15 treatments (cultivars). Sowing distances were 0.9 m between furrows x 0.4 m between plants (27 778 plants ha-1). In each sowing, 5 t ha-1 of worm humus and 300 kg ha-1 of the Compomaster papa sierra compound fertilizer, which contains 15%, 24% and 14% of nitrogen, phosphorus and potassium, respectively, were applied.
At harvest, eight plants were evaluated, discarding the plants from the ends to avoid the edge effect. The cultural management of the crops consisted of weeding, irrigation and sanitary control, according to the specific needs of the crop and according to the season, following the recommendations for this type of potato established by the PRTA-UNC and Navas and Díaz (2012).
The variables evaluated were total tuber weight (PTT); weight of commercial tubers (PTC); total number of tubers (NTT); number of commercial tubers (NTC); plant height (AP); number of stems and the dry matter yield of tubers. This dry matter was determined based on the percentage of dry matter of the cultivars obtained during the characterization Seminario et al. (2019). The discrimination of commercial tubers was carried out with the classification of Pérez et al. (2008) and the criteria established by Seminario et al. (2018), in round and compressed tubers: diameter greater than ≥ 2 cm and in oblong, elliptic and obovate and ovate tubers: L + A/2 ≥ 2 cm.
The data of the variables under study were analyzed using the program SAS version 9.4. First the analysis of variance (Anova) was performed and then, depending on the significance of this test, Duncan’s multiple-range test was performed. In addition, correlations were made between the variables related to the yield and the total weight of tubers. Fresh tuber yield per hectare was calculated using Hay and Walker’s (1989) equation: fresh tuber weight (ha) = planting density x number of tubers per plant x average tuber weight. The dry matter yield per hectare was determined by multiplying the average weight of the plant’s dry matter by the number of plants per hectare.
Results and discussion
Yield of fresh tubers and related variables
Highly significant statistical differences (p> 0.01) were found for cultivars in the six variables studied (Table 5); that is, there are real differences between the averages of these variables. These differences are probably explained by the genetic variability of the cultivars under study.
Table 5 Mean squares and significance of Anova, for the total weight of tubers per plant (PTT) and related variables of 15 potato cultivars of the Phureja group from Cajamarca, in eight environments.
| Source variation | Degrees of freedom | PTT (g) | PTC (g) | NTT | NTC | AP | NT | MS |
|---|---|---|---|---|---|---|---|---|
| Block | 7 | 7 301.12 ns | 2 363.82 ns | 4.27 ** | 0.89 ** | 0.89 ** | 0.21** | 408.0948* |
| Cultivars | 14 | 46 043.15 ** | 27 633.35 ** | 3.23 ** | 0.37 ** | 0.37 ** | 0.24** | 2 190.6406** |
| Error | 98 | 3 581.32 | 2 520.83 | 1.13 | 0.18 | 0.18 | 0.07 | 185.1059 |
| Total | 119 | |||||||
| CV (%) | 21.7 | 27.6 | 26.9 | 20 | 20 | 13.5 | 21.9 |
PTT= total weight of tubers (g); PTC= weight of commercial tubers (g); NTT= total number of tubers, NTC= number of commercial tubers; AP= plant height (cm); NT= number of stems; CV= coefficient of variation (%). *Significant. **Highly significant; NS= not significant; MS= dry matter.
Statistical significance (p> 0.01) was also found for the environments (repetitions) in four yield-related variables (NTT, NTC, AP and NT), which suggests that the environments where the trials were carried out (different years and months) influenced the evaluated components, in a differentiated way. The coefficients of variation varied between 13.5% and 27.6%, these values are considered acceptable for the field conditions where the trials were carried out (Vásquez, 2014). This influence was to be expected because sowings were carried out in different seasons (rain and dry) and where temperatures, rainfall and hours of sunlight varied significantly (Table 4).
In previous tests with cultivars of the same group, statistical differences were found for most of the variables evaluated here (Pérez et al., 2008; Rozo and Ñustez, 2011; Rojas and Seminario, 2014; Seminario et al., 2017; Seminario et al., 2018). These similarities are important because they allow identifying the quantitative variables that differentiate the cultivars and also to identify the basic components of the yield such as the number of tubers and the average weight of tubers per plant, which combined with the density of planting allow estimating the yield per hectare (Hay and Walker, 1989).
According to Duncan’s test (α= 0.05) (Table 6), it is observed that the cultivars ‘Chachapoyana’, ‘Montañera’, ‘Blanca’ and ‘Shoga’ are statistically similar and stand out for the total weight of tubers (PTT) and weight of commercial tubers (PTC) with respect to the remaining eleven cultivars.
Table 6 Duncan’s multiple-range test (α= 0.05) for the total weight of tubers and related variables of 15 potato cultivars of the Phureja group from Cajamarca, in eight environments.
| Cultivar | PTT (g) | PTC (g) | NTT | NTC | AP (cm) | NT | MS (g) |
|---|---|---|---|---|---|---|---|
| Cha | 406.7 a | 277.3 a | 16.4 ab | 6.1 ab | 56.6 d | 5.1 a | 81.3 ab |
| Mon | 391.1 a | 277.8 a | 10.3 c | 6.9 a | 60.4 dc | 5 b | 74.3 abcd |
| Bla | 382.8 a | 267.9 a | 16.4 abc | 4.9 abcd | 62.1dc | 4.7 abcd | 91.8 a |
| Sho | 367.2 a | 240.9 a | 9.6 c | 3.2 d | 67.5 bc | 4.2 bcde | 88.1 ab |
| Pam | 302.7 b | 185.3 b | 22.9 ab | 5.6 abc | 60.4 dc | 3.6 cde | 66.6 bcd |
| Mul | 269.3 bc | 174.2 bc | 17 abc | 4.3 bcd | 70.6 ab | 3.1 e | 61.6 cdef |
| Por | 267.5 bcd | 178.8 bc | 22.8 ab | 4.3 abcd | 57 d | 3.7 de | 64.2 cde |
| Lim | 255 bcde | 125.5 cde | 11.7 bc | 5.5 abc | 59.7 dc | 4.5 abcde | 58.6 cdefg |
| Amh | 228.5 cde | 177.5 bc | 11.5 bc | 4.9 abcd | 62.8 dc | 3.8 bcde | 61.7 cdef |
| Lih | 227 cde | 154.1 bcde | 10.3 bc | 4.8 abcd | 65 bc | 3.4 de | 52.2 defg |
| Hua | 223.2 cde | 129.7 bcde | 18.7 abc | 4.9 abcd | 62.1 dc | 4.8 abc | 42.4 efg |
| Ama | 212.6 cde | 171.3 bcd | 20.1 abc | 5.8 ab | 76.3 a | 5.4 a | 57.4 defg |
| Yuq | 200 de | 146.2 bcde | 22.3 ab | 4.9 abcd | 60.6 dc | 4.6 abcd | 39.8 fg |
| Hur | 199 de | 116.3 de | 26.5 a | 3.4 cd | 48 e | 4.5 abcde | 51.7 defg |
| Hut | 197.8 e | 100.8 e | 20.2 abc | 4.7 abcd | 66.2 bc | 4.7 abcd | 37.6 g |
The cultivar ‘Chachapoyana’ ranks first in terms of the components total number of tubers (NTT), number of commercial tubers (NTC) and number of stems (NT). The cultivars ‘Huagalina’, ‘Amarilla’ and ‘Yuquilla’ do not show significant statistical differences for the variables NTT, NTC and NT. With regard to plant height (AP), the Cultivars Amarilla and Mulla do not differ statistically, but exceed the remaining thirteen cultivars.
The superiority shown by certain cultivars of the study group, with respect to the main components of the yield such as the number and total weight of tubers and, number and weight of commercial tubers constitutes an advantage that must be used to carry out specific yield tests, in order to identify the most productive cultivars in the region.
In previous studies with cultivars of the same group and from the Cajamarca region, other cultivars have stood out in the basic components of yield (NTT, NTC, PTT and PTC). Thus, they are mentioned as the best: ‘Roja-2’, ‘Piña amarilla’ and ‘Montañera-3’ (Rojas and Seminario, 2014). ‘Roja-2’, ‘Amarilla mahuay’, ‘Piña amarilla’, ‘Amarilla’, ‘Montañera-3’ and ‘Porpora’ (Seminario et al., 2017). ‘Blanca amarilla’, ‘Limeña huachuma’, ‘Llanqueja’, ‘Amarilla redonda’ and ‘Piña amarilla’ (Seminario et al., 2018). These elite cultivars are properly morphologically characterized (Seminario et al., 2019) and must be analyzed through specific studies.
Dry matter yield (g plant-1) of cultivars
High statistical significance was found for the source of cultivar variation, meaning that there are real differences between the dry matter averages of the 15 cultivars. Similarly, there was statistical significance at 5% probability for blocks (Table 5), indicating that there was an environmental effect on the variability of dry matter content in g plant-1. That is, the dry matter content is a genetically controlled character and is affected by the conditions of the environment and by the genotype x environment interaction (Vásquez, 1988; Hay and Walker, 1989). The coefficient of variation was 21.9%, an acceptable value for the field conditions where the experiment was conducted.
The Tukey multiple-range test (α= 0.05) (Table 6) indicated that there are no statistical differences between the cultivars ‘Montañera’, ‘Chachapoyana-1’, ‘Shoga’ and ‘Blanca’, whose averages vary between 74.28 g and 91.88 g, the cultivar ‘Blanca’ with the highest yield of dry matter (91.888 g plant-1) stands out. A second group of cultivars was found, which consists of ‘Piña amarilla’, ‘Poropora’, ‘Amarilla mahuay’, ‘Mulla’ and ‘Limeña’, with averages varying between 66.613 g plant-1 and 58. 638 g plant-1 of dry matter, but no statistical difference between them.
The variation in dry matter yield among the 15 cultivars (37.58 g plant-1 to 91.88 g plant-1) is explained because these are different genotypes and also by the environmental effect. It is known that the dry matter content is a polygenic character, highly heritable and of low interaction with the environment (Vásquez, 1988; Martínez and Ligarreto, 2005; Bautista et al., 2012). Several studies have shown that in these cultivars, it is expected that the highest proportion of dry matter is allocated to the tubers, which is demonstrated with the harvest index (IC). In general, IC values are higher than 40% (Rojas and Seminario, 2014; Saldaña et al., 2015; Seminario et al., 2019).
Thus, it is necessary to know which cultivars have the highest production of dry matter in tubers, which have an advantage for fresh consumption and processing. The higher dry matter content implies floury consistency, appreciated by the consumer, lower absorption of oil in frying and higher yield in starch, mash, powder, flakes and potato chips (Andrade, 1997; Ligarreto and Suarez, 2003).
Yield of fresh tubers (t ha-1) and dry matter of tubers (t ha-1)
Fresh tuber yields per plant (g plant-1) indicate 5 to 11 t ha-1 of fresh tubers (Figure 1). These yields can be considered low to moderate if compared with the maximum experimental yields in the region (27 t ha-1 to 28 t ha-1). Nevertheless, they are close to the averages obtained in other studies with materials of the same group (Rojas and Seminario, 2014; Seminario et al., 2016; Seminario et al., 2017). It is important to note the high variability shown by tuber yield:
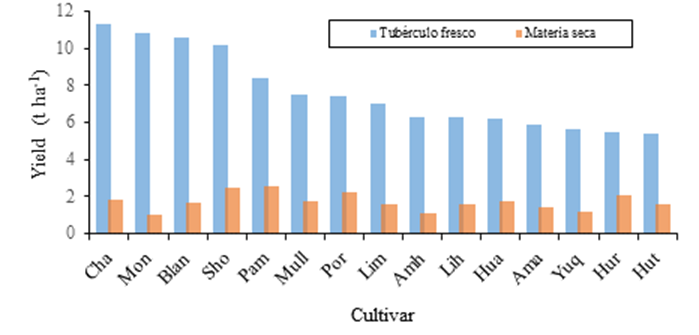
Figure 1 Yield of fresh tubers (t ha-1) and dry matter (t ha-1) of 15 potato cultivars of the Phureja group from Cajamarca, in eight environments.
Thus, for example, in harvest II (dry season, 2011), the cultivar ‘Chachapoyana’ and ‘Montañera’ yielded 14.7 t ha-1 and 14.2 t ha-1 and the lowest yield corresponded to ‘Limeña huachuma’ with 5.3 t ha-1. On the other hand, in harvest VI (2014), the lowest yield (3 t ha-1) was recorded in the cultivar ‘Porpora’ and the highest yield (15 t ha-1) corresponded to the cultivar ‘Chachapoyana-1’.
Both harvests were produced in the rainy season, which shows that the yield is a multifactorial character, in which the factors of the environment have a differentiated impact on the genotypes. It can be inferred that the components number and total weight of tubers per plant and especially the number and weight of commercial tubers per plant played a decisive role in the definition of the total yield. Overall, for all cultivars, only 33% of tubers were commercial but this proportion ranged from 12.8% to 66.9% and their average weight was 37.5 g, but ranged from 21.4 g to 75.3 g. Likewise, it can be inferred that the differences between the values of the meteorological variables of the rainy and dry seasons played a compensatory role between them. For example, the lower average and minimum temperatures of the dry season were offset, in a way, by the higher hours of sunshine of this season and the lower hours of sunshine in the rainy season were offset by the higher temperatures. It is evident that, in field crops, it is almost impossible to find optimal conditions (environmental and management) for plants, as recommended by Navas and Díaz (2012).
The low yields are also explained by the plants only receiving a low dose of humus (5 t ha-1) and a deep fertilization, also in low doses (15-24-14 of N-P-K). On the other hand, the backgrounds of experimental studies indicates that the Phureja potato has moderate to low yields, even when high levels of chemical fertilizer or organic fertilizer are applied (Pérez et al., 2008; Muñoz and Lucero, 2008; Gómez-García, 2017). However, these yields are offset by their precocity and high price in the market.
The dry matter yields in the tubers (g plant-1) recorded in the 15 cultivars are equivalent to yields of 1 to 2.6 t ha-1 (Figure 1). These values are an expression of the genotype, due to the different percentage of dry matter in the tubers in each cultivar, which was determined during the previous characterization (Seminario et al., 2019) and except in one case (cultivar ‘Shoga’), the best cultivars in fresh weight were not the best in dry matter (Figure 1). This information is important because it allows comparing and selecting cultivars for their efficiency in the use of external inputs and light energy and their transformation into organic matter, as an expression of net photosynthesis.
Correlations and regressions between yield-related variables
A positive, highly significant correlation was found between PTC and PTT (r= 0.9387) The regression equation was: Y= 55.33 + 1.2x. The correlations between NTT, NTC, NT and AP, with PTT were low and not significant. The high positive correlation between PTC and PTT and the lack of correlation between NT and PTT is explained by the fact that crop produced abundant small tubers, smaller than 2 cm in diameter or smaller than 5 g (non-commercial) and commercial tubers, according to the classification of Pérez et al. (2008) (commercial ≥ 2 cm in diameter or greater than 5 g), were few (30% ± 10% of the total) and were the ones that most influenced the total weight of tubers per plant (Table 5). Likewise, the lack of correlation between NTT, NT and AP with PTT indicates that their relationships are not allometric or stable (Gardner et al., 1985) and on the contrary, these vary according to environmental and management conditions. Rojas and Seminario (2014) analyzing 10 cultivars from the same group also found a positive correlation (r= 0.074) between PTC and PTT.
Conclusions
Significant statistical differences were found between the 15 traditional cultivars of Phureja potato under study, for the variables PPT, PTC, NTT, NTC, AP, NT and MS. The cultivars ‘Chachapoyana’, ‘Montañera’, ‘Blanca’ and ‘Shoga’ were the best in yield of fresh tubers. On the other hand, in dry matter, the cultivars ‘Piña Amarilla’, ‘Shoga’ and ‘Porpora’ stood out (these groups of cultivars must be studied in specific tests). The weight component of commercial tubers was decisive in defining the total yield of fresh tubers (explained by its high degree of correlation, r= 0.93).
The environments (different years and months of sowing) presented significant statistical differences for the variables NTT, NTC, AP and NT. However, in general, their effects were compensatory, among their various factors (average temperature, maximum and minimum temperature, rainfall, relative humidity and hours of sunlight) and seasons, so that the best environment could not be determined.
Literatura citada
Alarcón, L.; Montoya, K.; Prieto, L. y Cerón, M. 2016. Rehidratación de purés de papa criolla (Solanum tuberosum grupo Phureja). In: Resúmenes del XXVII Congreso de la Asociación Latinoamericana de la Papa. 22-26 agosto, Panamá. 86 p. [ Links ]
Andrade, H. 1997. Requerimientos cualitativos para la industrialización de la papa. Revista Informativa del INIAP. 9:21-23. [ Links ]
Bonierbale, M.; Grüneberg, W.; Amoros, W.; Burgos, G.; Salas, E.; Porras, E. and Felde, T. 2009. Total and individual carotenoid profiles in Solanum phureja cultivated potatoes: II. Development and application of near-infrared reflectance spectroscopy (NIRS) calibration for germoplasm characterization. J. Food Composition and Analysis. 22(6):509-516. [ Links ]
Cerón-Lasso, M.; Alzate-Arbelaez, A. F.; Rojano, B. A. y Ñustez-López, C. E. 2018. Composición fisicoquímica y propiedades antioxidantes de genotipos nativos de papa crioll (Solanum tuberosum grupo Phureja). Información Tecnológica. 29(3):205-216. [ Links ]
Cruz, D.; Sierra, G.; Prieto, L. y Cerón, M. S. 2016. Purés deshidratados de clones candidatos a registro de papa criolla (Solanum tuberosum grupo Phureja). In: Resúmenes del XXVII Congreso de la Asociación Latinoamericana de la Papa. 22-26 agosto, Panamá. 114 p. [ Links ]
Díaz, W. S. y Mosquera, T. 2014. Identificación y cuantificación de carotenoides en una población de Solanum tuberosum grupo Phureja cocida. In: Memorias de XXVI Congreso de la Asociación Latinoamericana de la Papa. 28 septiembre a 2 octubre, 2014, Bogotá, Colombia. 106 p. [ Links ]
Gardner, F. P.; Pearce, R. B. and Mitchel, R. L. 1985. Physiology of crop plants. Iowa State University Press, IA, USA. 195-196 pp. [ Links ]
Gómez- García, A. J. 2017. Efecto de la fertilización orgánica e inorgánica, sobre la productividad en el cultivo de papa criolla (Solanum phureja), en la finca Santo Domingo-Municipio de la Calera-Cundinamarca. tesis Administrador Agropecuario. Facultad de Ciencias Agropecuarias, Universidad Nacional de Cundinamarca, Colombia. 113 p. [ Links ]
Haan, S. 2009. Potato diversity at height: multiple dimentions of farmer-driven in situ conservation in the Andes. Ph.D. thesis Wageningen University, The Netherlands. 245 p. [ Links ]
Hay, R. K. M. and Walker, A. J. 1989. An introduction to the physiology of crop yield. Longman Scientific & Technical. 190 p. [ Links ]
Ligarreto, G. A. y Suárez, M. N. 2003. Evaluación del potencial de los recursos genéticos de papa criolla (Solanum phureja) por calidad industrial. Agron. Colomb. 21(1-2):83-94. [ Links ]
Martínez, N. M. y Ligarreto, G. A. 2005. Evaluación de cinco genotipos promisorios de papa Solanum tubersoum sp. andigena según desempeño agronómico y calidad industrial Agron. Colomb . 23(1):17-27. [ Links ]
Martínez, P.; Málaga, A.; Betalleluz, I.; Ibarz, A. y Velezmoro, C. 2015. Caracterización funcional de almidones nativos obtenidos de papas (Solanum phureja) nativas peruanas. Sci. Agrop. 6(4):291-301. [ Links ]
Molina, Y.; Caez, G. R.; Rodríguez, M. L.; Cerón, M. S. y Garnica, A. M. 2015. Contenido de antioxidantes en papas criollas nativas (Solanum tuberosum L. grupo Phureja) en proceso de precocción y congelación. Rev. Alimentos Hoy. 23(36):31-41. [ Links ]
Navas, G. E. y Díaz, C. 2012. Criterios para la evaluación y producción de papa criolla para la industria. CORPOICA, Antioquia, Colombia. 48 p. [ Links ]
Parra-Galindo, M. A.; Piñeros-Niño, C. y Mosquera, T. 2016. Composición y cuantificación de antocianinas en tubérculos cocidos de Solanum tubersoum grupo Phureja. In: Resúmenes del XXVII Congreso de la Asociación Latinoamericana de la Papa. 22-26 agosto, Panamá. 76 p. [ Links ]
Peña, C.; Restrepo-Sánchez, L. P.; Kushalappa, A.; Rodríguez, L. E.; Mosquera, T. and Narvaez-Cuenca, C. E. 2015. Nutritional contents of advanced breeding clones of Solanum tuberosum group Phureja. LWT Food Sci. Technol. 62:76-82. Doi:10.1016/j.lwt.2015.01.038. [ Links ]
Pérez, L. C.; Rodríguez, L. E. y Gómez, M. I. 2008. Efecto del fraccionamiento de la fertilización con N, P, K y Mg y la aplicación de los micronutrientes B, Mn y Zn en el rendimiento y calidad de papa criolla (Solanum phureja) variedad Criolla Colombia. Agron. Colomb . 26(3):477-486. [ Links ]
Piñeros, C. I. 2009. Recopilación de la investigación del sistema de papa criolla. FEDEPAPA, Secretaría de Agricultura y Desarrollo Económico, Gobernación de Cundinamarca, Colombia. 152 p. [ Links ]
Rivera, J. E.; Herrera, A. O. and Rodríguez, L. E. 2011. Assessment of the processing profile of six “creole potato” genotypes (Solanum tuberosum Phureja Group). Agron. Colomb . 29(1):73-81. [ Links ]
Rozo, Y. C. and Ñustez, C. E. 2011. Effects of phosphorus and potassium levels on the yield of the variety Criolla Colombia in the department of Cundinamarca. Agron. Colomb . 29(2):205-2012. [ Links ]
Rozo, D. y Ramírez, L. N. 2011. La agroindustria de la papa criolla en Colombia. Situación actual y retos para su desarrollo. Gestión Soc. 4(2):17-30. [ Links ]
Saldaña, T. M.; Patiño, J. A. and Cotes-Torres, J. M. 2015. Biomass distribution and allocation in diploid potato varieties (Solanum phureja Juz. et Buk.). Agron. Colomb . 33(3):322-329. Doi: 10.15446/agron.colomb.v33n3.50237. [ Links ]
SAS Institute. 2013. SAS 9.4. Procedure’s guide: Statistical procedures. Second edition. SAS Institute Inc. Cary, NC, USA. 550 p. [ Links ]
Seminario, J.; Seminario, A. y Domínguez, A. 2016. Potencial productivo de 12 cultivares de papa chaucha (Solanum tuberosum L. grupo Phureja) de la región Cajamarca. Fiat Lux. 12(2):115-127. [ Links ]
Seminario, J.; Seminario, A.; Domínguez, A y Escalante, B. 2017. Rendimiento de cosecha de diecisiete cultivares de papa (Solanum tuberosum L.) del grupo Phureja. Sci. Agrop . 8(3):181-191. doi:10.17268/sci.agropecu.2017. 03.01. [ Links ]
Seminario, J.; Villanueva-Guevara, R. y Valdez-Yopla, M. H. 2018. Rendimiento de cultivares de papa (Solanum tuberosum L.) amarillos precoces del grupo Phureja. Agron. Mesoam. 29(3):639-653. Doi: 10.15517/ma.v29i3.32623. [ Links ]
Seminario, J.; Tapia, H. J. y Seminario, A. 2019. Los Solanum del grupo Phureja de Cajamarca: avances. Gráfica Bracamoente. Lima, Perú. 19-61 pp. [ Links ]
Seminario, J. y Zarpán, L. 2011. Conservación in situ on farm-ex situ de Solanum tuberosum L. grupo Phureja en la cuenca del Llaucano y áreas adyacentes. Arnaldoa. 18(2):103-114. [ Links ]
Vásquez, V. 1988. Mejoramiento genético de la papa. Amaru editores, Lima-Perú. 55-56 pp. [ Links ]
Vásquez, V. 2014. Diseños experimentales con SAS. Edita Concytec-Fondecyt. Lima, Perú. 106-107 pp. [ Links ]
Zimmerer, K. S. 1991. Labor shortages and crop diversity in the southern Peruvian Serra. Geographical Review. 81(4):414-43. [ Links ]
Received: April 2021; Accepted: June 2021
 Este es un artículo publicado en acceso abierto bajo una licencia Creative Commons
