


Services on Demand
Journal
Article
 text in
  English (pdf)
 Article in xml format
 Article references
 Send this article by e-mail
Indicators
-
 Cited by SciELO
 -
 Access statistics
Related links
-
 Similars in
SciELO
Similars in
SciELO
Share

 Permalink
Revista mexicana de ciencias agrícolas
Print version ISSN 2007-0934
Rev. Mex. Cienc. Agríc vol.11 n.spe24 Texcoco Apr./May. 2020 Epub May 07, 2021
https://doi.org/10.29312/remexca.v0i24.2366
Articles
Optimization of resources in forage production Irrigation District 028 Tulancingo
1Posgrado en Hidrociencias-Colegio de Postgraduados. Carretera México-Texcoco km 36.5, Montecillo, Texcoco, Estado de México. CP. 56230. Tel. 595 9520200, ext. 1150. (luz@colpos.mx; bautistama475@gmail.com).
2Departamento de Irrigación-Universidad Autónoma Chapingo. Carretera México-Texcoco km 38.5, Chapingo, Texcoco, Estado de México. CP. 56230. Tel. 595 9521620. (libacas@gmail.com).
The limitation of resources in forage production, necessary for the development of livestock production activity in irrigation district 028 Tulancingo, in the state of Hidalgo, motivated the development of a linear programming model (LPM) that optimizes them in quantity total required. In this model, with the Simplex method, the objective function was to maximize the total net economic benefit (BN) of the district; starting from the sum of the BN of each crop by its surface, thus generating a pattern that complies with the total restrictions to which the function is subject: availability of resources and requirements of each crop. Based on the generated LPM, four scenarios were tested: 1) current situation; 2) with coating of the conduction network; 3) with second cultures; and 4) with coating and second cultures. Each one with four variants of water availability: the one registered in the 2018-2017 agricultural cycle, those calculated for exceedance probability of 50, 75 and 95%. The combination of scenarios and variants resulted in a total of 16 cultivation patterns in which, as the volume offered is reduced, the maximum areas that the LPM suggest for each cultivation are also reduced. The actions proposed in scenarios 2, 3 and 4 in all cases increased the feasible area as well as the BN compared to the current situation, even though this presents a greater availability of water.
Keywords: crop pattern; linear programming; net profit
La limitación de recursos en la producción de forrajes, necesaria para el desarrollo de la actividad productiva ganadera en el distrito de riego 028 Tulancingo, en el estado de Hidalgo, motivó la elaboración de un modelo de programación lineal (MPL) que los optimiza en cantidad total requerida. En dicho modelo, con el método Simplex, la función objetivo consistió en maximizar el beneficio económico neto (BN) total del distrito; a partir, de la suma del BN de cada cultivo por su superficie, generando así un patrón que cumple con el total de restricciones a las que se sujeta la función: disponibilidad de recursos y requerimientos de cada cultivo. Con base a el MPL generado, se probaron cuatro escenarios: 1) situación actual; 2) con revestimiento de la red de conducción; 3) con segundos cultivos; y 4) con revestimiento y segundos cultivos. Cada uno con cuatro variantes de disponibilidad hídrica: la registrada en el ciclo agrícola 2018-2017, las calculadas para probabilidad de excedencia de 50, 75 y 95%. La combinación de escenarios y variantes derivó en un total de 16 patrones de cultivo en los que, al reducirse el volumen ofertado, las superficies máximas que los MPL sugieren para cada cultivo se reducen también. Las acciones propuestas en los escenarios 2, 3 y 4 en todos los casos incrementaron la superficie factible al igual que el BN en comparación con la situación actual, aun presentando esta una mayor disponibilidad de agua.
Palabras clave: beneficio neto; patrón de cultivos; programación lineal
Introduction
The main activities in Irrigation District 028 are irrigated agriculture and intensive livestock farming (Sánchez et al., 2016), highlighting the dairy production chain (Sanchez and Terrones, 2015). As the production of fodder crops is an indispensable factor in the development of livestock, in the District 97% of its surface is assigned to the sowing of these (CONAGUA, 2016; SIAP, 2018), historically supplied through the network of channels from the Tulancingo river and the volume of concession for extraction for agricultural use.
As is known, the water resources that are used beyond their capacity for renewal modify the equilibrium conditions for their long-term sustainability and necessary supply (Hanasaki et al., 2010), this being the case of the Tulancingo Valley aquifer (key 1317), within whose official limits the district under study is located, since the average annual volume of groundwater available for the year 2013 presented a deficit of 6 842.2 thousand m3 per year, extracted from non-renewable storage, which is why 87% of its surface is subject to the provisions of the decree establishing a closure for the illumination of groundwater (DOF, 2013).
For the year 2018, the balance sheet update showed a considerable increase, now of 20 117.7 thousand m3 of deficit (DOF, 2018). Given the above, the planning and programming of the crop pattern established year after year in the district, considers as volume available for irrigation only that which comes from bypass and from the La Esperanza dam, both driven by gravity.
Finally, in order to seek greater benefits for producers in the region, given the resources available, a decrease in unit costs; however, seen from another perspective, the maximization of benefits from the optimization of resources, through linear programming with the Simplex method, has proven to be more efficient than other algorithms.
Thus, with the help of said method, this research aims to provide a proposal for a crop pattern to be established in the irrigation district 028 Tulancingo, in which the available resources are efficiently managed, the requirements of each crop are supplied , and the economic benefit that is currently had is increased.
Materials and methods
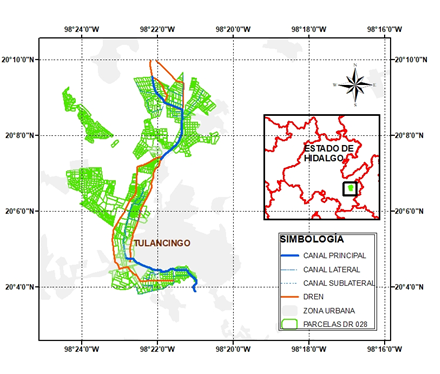
The irrigation district 028 Tulancingo is located in the southeast of the state of Hidalgo, between the extreme coordinates 98° 24” west longitude 20° 10” north latitude and 98° 20” west longitude 20° 3” north latitude (Figure 1), at a height of 2 150 meters above sea level. The predominant climate in the area according to the Köppen classification, modified by Garcia (2004), is BS1kw corresponding to semi-arid temperate dry with long cool summer, rains in summer and winter between 5 and 10% of the annual total, average temperature annual between 12 and 18 °C.
Selection of crops and historical areas
The total surface area dominated is 987 ha, of which 980 are irrigable, distributed in two modules: Module 01 ‘Aguas Blancas’ with 408 ha and Module 02 ‘Aguas Negras’ with 572 ha. This information was contrasted with that reported by the agricultural statistics of the irrigation districts published by the National Water Commission from 1997 to 2016 (CONAGUA, 1997-2016) and was complemented by the 2016-2017 and 2017-2018 cycles, registered with the district headquarters, to have a total of 21 complete agricultural cycles.
In the total agricultural cycles that were recorded in the district, perennial forage crops show dominance in planted area (87% on average), Figure 2. Of these, the crops to consider in the linear programming model (LPM) They were green lucerne (Medicago sativa L.), green clover (Trifolum repens L.) and associated forages, in force for the last 10 years. Associated forages are: Ovillo (Dactylis glomerata L.), perennial ryegrass (Lolium perenne L.), red clover (Trifolum pratense L.) and fescue (Festuca arundinacea L.). In addition to spring summer crops: green forage oats (Avena sativa L.), green forage maize (Zea mays L.) and other grasses, such as annual ryegrass (Lolium multiflorum L.) and wheat (Triticum aestivum L.). The information regarding yield, rural average price, cost and net benefit per crop, presented in Table 1, corresponds to the 2017-2018 cycle and shows the maximum and minimum historical area that has been planted (CONAGUA, 1997-2016).
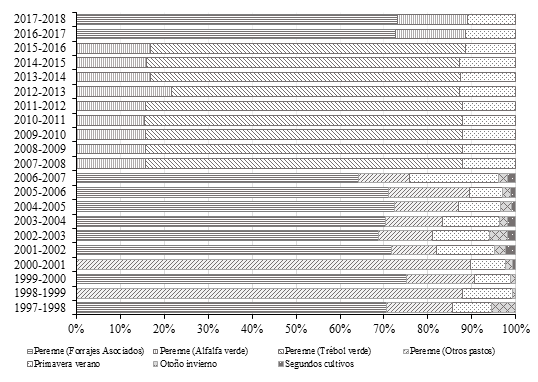
Figure 2 Percentage historical distribution of the area allocated to each agricultural sub-cycle in Irrigation District 028. Elaboration, with agricultural statistics of the irrigation districts (CONAGUA, 1997-2016) and information provided by the district.
Table 1 Limits of historically planted area and value of agricultural production in Irrigation District 028 Tulancingo.
| Crop Spring-Summer | Surface (ha) | Yield (t ha-1) | Rural average price ($ t-1) | Production value ($ ha-1) | Cost ($ ha-1) | Net profit ($ ha-1) | |
| maximum | minimal | ||||||
| Green forage oats | 21 | 6 | 22.5 | 510 | 11 475 | 10229.7 | 1 245.3 |
| Green fodder corn | 68 | 2 | 42.3 | 500 | 21 150 | 9 792.7 | 11 357.3 |
| Other grasses Perennes | 25 | 0 | 5.3 | 6 500 | 34 450 | 27043.8 | 7 406.2 |
| Green lucerne | 170 | 0 | 101 | 335 | 33 835 | 24652.9 | 9 182.1 |
| Associated forages | 602 | 0 | 100 | 350 | 35 000 | 27268.6 | 7 731.4 |
| Green clover | 596 | 0 | 95.5 | 331.1 | 31 621.5 | 24118 | 7 503.5 |
$= Mexican pesos (MXN), to the year 2017. Source: own elaboration, with the agricultural statistics of the irrigation districts (CONAGUA, 1997-2016) and information provided by the district.
Water availability
The planning of the agricultural cycle in an irrigation district is carried out based on the expected water availability (Sánchez et al., 2006; Minjares et al., 2010; Juárez et al., 2017), therefore the statistical analysis was performed of the historical volumes available (19 years), from 1998 to 2016 and 2018, where the values for exceedance probabilities of 50, 75 and 95% were obtained and these were the conditions assigned in each scenario for the linear programming models (LPM). The method of irrigation is by gravity, supplied by diversion and by the La Esperanza dam.
Demand for crops
The district has defined the unit irrigation coefficients (UIC) for periods of ten days, which represent the water expenditure required by one hectare of a crop, based on its evapotranspiration and application and conduction efficiencies (Pérez and Molina, 2011; FAO, 2006). These values were entered monthly for all crops.
Optimization model
The elaborated LPM was solved with the Simplex algorithm, through the use of the Solver® tool in an Excel® software spreadsheet. The objective function was to maximize the total net economic benefit in the district, resulting from the sum of the product of the net benefit of each crop by the area that the model proposes for it.
Where: Ac= is the area sown with crop c (ha); Vpc= is the value of crop production c, $ ha-1; Cpc= is the production cost of crop c ($ ha-1); BN= is the net profit ($); c= is the index for the number of crops; nc= the total number of crops in the irrigation district.
Restrictions
The restrictions consider water and soil availability, infrastructure, traditional crops and profitability. Soil was established as maximum surface limits for the entire district, the 980 ha irrigated, for the spring summer (SS) and perennial (P) subcycles, the maximum areas recorded in 21 years, for the crops that provide greater utility, areas historical maximums in order to avoid the propensity of the model to its primacy (Ortega et al., 2009) and for crops that by custom are planted in the region the minimum acceptable limit. Regarding water, the maximum values of monthly driving capacity and availability were demarcated, in correspondence with the demand required by crops (CUR), as well as the maximum annual availability.
Scenarios
The first scenario actual current situation contemplates 4 LPM from which optimal patterns were obtained for each availability. The second, ‘with major network cladding’, considered the increase in the efficiency of the conduction network from 70%, recommended for channels on land, to 80% suggested for lined channels (FAO, 2001), incident directly on the CUR of each crop.
In studies such as that of Reta et al. (2015), it has been found that a pattern of alternative crops can increase water productivity up to 33.3% and this is how the third scenario ‘with second crops’, proposed to resume the planting of second crops, excluded 10 years ago, in order to verify its viability through two options: grain corn (Zea mays L.) and other crops, the latter groups: tomato (physalis philadelphica L.), beans (Phaseolus vulgaris L.), green chili (Capsicum annuum L.) and zucchini (Cucurbita pepo L.). The fourth covers the actions of the second and third scenarios. The generated LPM are summarized and identified in Table 2.
Table 2 Identifier assigned to the combination of scenarios with variants.
| Stage | Variant | |||
| C2017-2018 | Pexc50 | Pexc75 | Pexc95 | |
| 1.Current situation (SA) | SA C2017-2018 | SA Pexc50 | SA Pexc75 | SA Pexc95 |
| 2.With major Net coating (CR) | CR C2017-2018 | CR Pexc50 | CR Pexc75 | CR Pexc95 |
| 3. With second crops (SC) | SC C2017-2018 | SC Pexc50 | SC Pexc75 | SC Pexc95 |
| 4. With major Net coating and second crops (CRSC) | CRSC C2017-2018 | CRSC Pexc50 | CRSC Pexc75 | CRSC Pexc95 |
C2017-2018= agricultural cycle water availability 2017-2018 (13 866 thousand m3); Pexc50, Pexc75 and Pexc95 = water availability for exceedance probabilities of 50 (12 507.16 thousand m3), 75 (11 623.91 thousand m3) and 95% (10 353.21 thousands m3), respectively.
Results and discussion
As a first result, the proposed LPM for the availability of the 2017-2018 cycle was obtained, in order to compare with the cultivation pattern that was actually established for that period in the district. Both results are presented in Table 3, area and net benefit, by crop and total; the incorporation of 26 ha of green clover and increases in total area (15 ha) and net profit ($150.64 thousand). From the results obtained, it follows that the model performs its function of optimizing resources well, by complying with the imposed restrictions and proposing a crop pattern that increases not only the area to be sown, but also the net profit. Similar to works such as that of Osama et al. (2017) and that of Daghighi et al. (2017) where the increase in BN that they achieve with their proposed crop pattern was 6.4 and 8% on average, respectively.
Table 3 Actual pattern vs. pattern proposed by the LPM for the 2017-2018 agricultural cycle.
| Crop Spring-summer | BN (thousands $ ha-1) | Set pattern | Proposed pattern (LPM) | |||
| Surface (ha) | BN (thousands $) | Surface (ha) | BN (thousands $) | |||
| Green forage oats | 1.25 | 10 | 12.45 | 14 | 17.46 | |
| Green fodder corn | 11.36 | 65 | 738.22 | 68 | 772.3 | |
| Other grasses Perennes | 7.41 | 15 | 111.09 | 23 | 173.41 | |
| Green alfalfa | 9.18 | 132 | 1 212.04 | 170 | 1 560.96 | |
| Associated forages | 7.73 | 602 | 4 654.31 | 538 | 4 160.58 | |
| Green clover | 7.5 | 0 | - | 26 | 194.04 | |
| Total | 824 | 6 728.12 | 839 | 6 878.76 | ||
BN= net profit, mexican pesos (MXN) to the year 2017.
Subsequently, for each LPM that by scenario in combination with availability variant was elaborated, the patterns present in Figure 3 were obtained and in it is observed how the cultivation of associated forages is suggested to dominate a larger area in all cases, despite not being the one that provides the greatest net benefit. The foregoing is explained since in the model its water requirement was distributed throughout the year, as it is a perennial crop, not so with green fodder maize, which, being the most profitable, requires water at the time of greatest demand (from March to June).
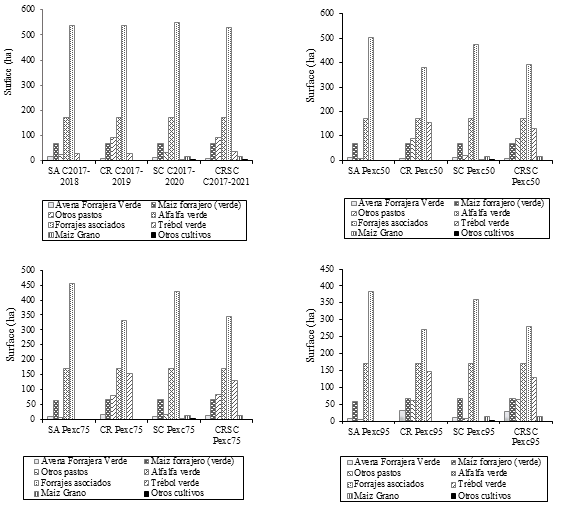
Figure 3 Crop pattern obtained by LPM for the different scenarios, grouped in charts by availability.
With the available volume of 13 866 thousand m3 (agricultural cycle 2017-2018), the areas for green forage maize and green alfalfa remain constant in the 4 scenarios, with 68 and 170 ha, respectively. The option of sowing ‘other grasses’ is suggested only in case of covering and the second crops are distributed in 14 and 2 ha for grain corn and other crops.
Given a volume with a probability of 50%, scenario 2 further distributed the areas between crops, increasing the area of green clover (null in SA) to 155 ha and that of other pastures (6.7 ha in SA) to 90 ha. The second crops suggest, in case of scenario 4, the planting of 14 ha only for grain corn.
With the volumes of 75 and 95% probability, the trend was similar to that of 50%, reducing all areas, with the exception of green forage oats, which presented maximum areas in both cases in scenario 2. In this case, water availability it affects not only in yield, but also in the feasible surface of being sown (Bredel et al., 2017), therefore it is not surprising that when the volume offered (with a greater probability of exceedance) decreases, the maximum surfaces that the LPM suggest for each crop they were also reduced, a result that coincides with those obtained in investigations such as those of Singh et al. (2001), Ortega et al. (2009) and Mazengo et al. (2018), in the latter they found that with 10% more water available, the LPM proposes the sowing of an additional 133 ha.
Likewise, the actions proposed by scenario, in all cases, increased the feasible area to a greater or lesser extent. In Table 4 of total surfaces, it can be seen how with a lower availability and covering the conduction network, the surface recommended by the model is comparable to that in the current situation with higher availability (CRPexc95 = 746.1 ha vs SAPexc50 = 757.9 ha) and even higher in some cases, if you compare CRPexc75> SAPexc50, for example.
Table 4 Total maximum area per LPM.
| Stage | Availability | |||
| C2017-2018 | Pexc50 | Pexc75 | Pexc95 | |
| Total area (ha) | ||||
| 1. SA | 839.4 | 757.9 | 703.4 | 625.2 |
| 2. CR | 898 | 867.5 | 820.2 | 746.1 |
| 3. SC | 845 | 763.1 | 708.6 | 629.9 |
| 4. CRSC | 914 | 870.8 | 823 | 752 |
SA= current situation; CR = with coating; SC= second crops; CRSC= with coating and second crops; C2017-2018= water availability of the 2017-2018 agricultural cycle, Pexc50, Pexc75 and Pexc95 = water availability for exceedance probabilities of 50, 75 and 95%, respectively.
The response to total net profit was remarkably similar to that of surfaces. In this regard, the values presented in Table 5 show that: compared to the current situation, the profitability of scenarios 2, 3 and 4 was higher, with less water availability, the gain in a scenario with coating is comparable to the one with the highest volume of supply in the current situation and for the same scenario, the reduction in volume directly impacts the decrease in profit.
The aforementioned indicates that the LPM efficiently carried out the optimization, since the maximum benefit is not obtained with any pattern that suggests planting a larger area, but with an adequate distribution by crop, as occurred with the LPM proposed in the Sofi et al. (2015); Upadhyaya (2017), where with the help of the same method, they propose the modification to cultivation patterns in India.
Table 5 Total net profit per LPM.
| Stage | Availability | |||
| C2017-2018 | Pexc50 | Pexc75 | Pexc95 | |
| Total net profit (miles $) | ||||
| SA | 6 878.76 | 6 284.33 | 5 854.75 | 5 228.93 |
| CR | 7 361.94 | 7 096.56 | 6 660.79 | 6 012.32 |
| SC | 6 984.05 | 6 345.36 | 5 928.6 | 5 328.53 |
| CRSC | 7 517.11 | 7 170.08 | 6 761.95 | 6 122.39 |
SA= Current situation; CR= with coating; SC= second crops; CRSC= with coating and second crops; C2017-2018= water availability of the 2017-2018 agricultural cycle, Pexc50, Pexc75 and Pexc95= water availability for exceedance probabilities of 50, 75 and 95%, respectively.
In Figure 4, the differences in total surface area results and net profit of scenarios in relation to the current situation are exposed, in order to verify under which situation, the impact of the actions proposed by the scenarios will be greater. In the research carried out by Al-Nassr (2018), where he determines the optimal crop and surface combination for the Rasheed/Hamorabi farm in Baghdad, the proposed crop rotation offers a net profit of 63.9% higher than his actual plan for the 2015-2016 cycle, in this case, although without significant changes in the crops to be considered, the addition of second crops presents an increase in net profit between 61 and 105.3 thousand pesos, with a variation in the area of between 4.7 and 5.6 ha, above the current situation.
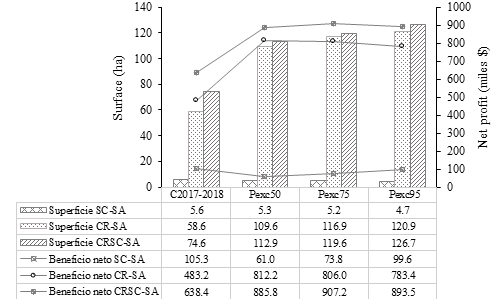
The effect of the coating (CR-SA) on the total surface is greater as availability is reduced, however, the maximum difference in net profit is reached with the availability of Pexc50 (812.2 thousand pesos). With both options, incorporating second crops and performing the conduction network coating (CRSC) have the highest differences, however, the greatest impact on the surface (126.7 ha) does not coincide with that of BN (907.2 thousand pesos) in a situation of availability: the first is for a Pexc95 and the second for a Pexc75.
Conclusions
The elaborated LPM efficiently optimized resources, by complying with the imposed restrictions and proposing a crop pattern that increases not only the area to be sown, but also the net profit. In them, when decreasing the volume offered (with a greater probability of exceedance), the maximum areas that the LPM suggest for each crop are also reduced. The proposed actions to cover the conduction network (scenario 2), incorporation of second crops (scenario 3) or both (scenario 4), in all cases increased to a greater or lesser extent the feasible area, as well as its net profit, compared to the current situation, even in cases where it had greater water availability.
An important recommendation, in favor of the improvement of the LPM elaborated, is the one to incorporate new restrictions that have to do with the human resource (jornales), machinery and available supplies; important aspects of production, with which you can further enrich the models.
Acknowledgments
To Mr. Juan F. Acevedo Zapata, head of the Irrigation District 028, for the kindly shared information.
REFERENCES
Al-Nassr, R. and Sh, M. 2018. The optimal crop rotation of AI-Rasheed District farms using linear programming technique. Iraqi J. Agric. Sci. 50(Special Issue):113-127. [ Links ]
Bredel, A. S.; Bohn, V. Y. y Piccolo, M. C. 2017. Variabilidad de la precipitación y su relación con los rendimientos agrícolas en una región semiárida de la llanura pampeana (Argentina). Estudios Geográficos. 78(282):7-29. [ Links ]
CONAGUA. 1997-2016. Estadísticas agrícolas de los Distritos de Riego. Publicación por ciclo agrícola, desde 1997 hasta 2016. Subdirección General de Infraestructura Hidroagrícola, Comisión Nacional del Agua. Secretaría de Medio Ambiente y Recursos Naturales (SEMARNAT). México. [ Links ]
Daghighi, A.; Nahvi, A. and Kim, U. 2017. Optimal cultivation pattern to increase revenue and reduce water use: application of linear programming to arjan plain in fars province. Agriculture. 7(9):73-84. [ Links ]
DOF. 2013. Acuerdo por el que se actualiza la disponibilidad media anual de aguas nacionales del acuífero Valle de Tulancingo, clave 1317, en el estado de Hidalgo, Región Hidrológico Administrativa Golfo Norte y se dan a conocer los estudios del mismo acuífero. Diario Oficial de la Federación. México. http://www.dof.gob.mx/nota-detalle.php?codigo= 5320583&fecha=04/11/2013. [ Links ]
DOF. 2018. Acuerdo por el que se actualiza la disponibilidad media anual de agua subterránea de los 653 acuíferos de los Estados Unidos Mexicanos. Diario Oficial de la Federación. México. https://dof.gob.mx/nota-detalle.php?codigo=5510042&fecha=04/01/2018. [ Links ]
FAO. 2001. Manual de riego parcelario. Desarrollo de tierras y aguas. Oficina regional de la FAO para América Latina y el Caribe. Santiago, Chile. [ Links ]
FAO. 2006. Evapotranspiración del cultivo. Guías para la determinación de los requerimientos de agua de los cultivos. Estudio FAO riego y drenaje 56. Roma, Italia. [ Links ]
García, E. 2004. Modificaciones al sistema de clasificación climática de Köppen. 5a. (Ed.). Instituto de Geografía. Universidad Nacional Autónoma de México (UNAM). México. 90 p. [ Links ]
Hanasaki, N.; Inuzuka, T.; Kanae, S. and Oki, T. 2010. An estimation of global virtual water flow and sources of water withdrawal for major crops and livestock products using a global hydrological model. J. Hydroly. 384(3-4):232-244. [ Links ]
Juárez, T. M.; Sánchez, A. L and Vedenov, D. 2017. Weather derivatives and water management in developing countries: an application for an irrigation district in Central Mexico. J. Agric. Res. Econ. 42(2):146-163. [ Links ]
Mazengo, R. T.; Goyal, V. C. and Poswal, D. 2018. Crop income optimization analysis under crop diversification scenarios in a village near Roorkee: District Haridwar, India. Inter. J. Agron. Agric. Res. 13(2):177-184. [ Links ]
Minjares, L. J. L.; Valdés, J. B.; Salmón, C. R. F.; Oroz, R. L. A. y López, Z. R. 2010. Planeación, manejo y evaluación sustentable de los recursos hidráulicos en el Distrito de Riego 041, río Yaqui, México. Tecnología y Ciencias del Agua. 1(1):137-151. [ Links ]
Ortega, G. D.; Mejía, S. E.; Palacios, V. E.; Rendón, P. L. y Exebio, G. A. 2009. Modelo de Optimización de recursos para un Distrito de Riego. Terra Latinoam. 27(3):219-226. [ Links ]
Osama, S.; Elkholy, M. and Kansoh, R. M. 2017. Optimization of cropping pattern in Egypt. Alexandria Eng. J. 56(4):557-566. [ Links ]
Pérez, M. G. B. y Molina, A. J. P. 2011. Obras hidráulicas. Universidad Michoacana de San Nicolás de Hidalgo Facultad de Ingeniería Civil. Departamento de Hidráulica. 22-40 pp. [ Links ]
Reta, S. D. G.; Figueroa, V. U.; Serrato, C. J. S.; Quiroga, G. H. M.; Gaytán, M. A. y Cueto, W. J. A. 2015. Potencial forrajero y productividad del agua en patrones de cultivo alternativos. Rev. Mex. Cienc. Pec. 6(2):173-170. [ Links ]
Sánchez, C. I.; Macías, R. H.; Heilman, P.; González, C. G.; Mendoza, M. S. F.; Inzunza, M. A. y Estrada, A. J. 2006. Planeación multiobjetivo en los distritos de riego de México. Aplicación de un sistema de auxilio para la toma de decisiones. 21(3):101-111. [ Links ]
Sánchez, H. M. A.; Hernández, A. E.; Acevedo, D. C.; Uribe, G. M.; Díaz, V. P. y Lara, B. A. 2016. Sistema agroforestal coquia-mezquite establecido en suelos del Distrito de Riego Tulancingo, Hidalgo, México. Rev. Mex. Cienc. Agríc. 7:3207-3217. [ Links ]
Sánchez, T. Y. y Terrones, C. A. 2015. Estrategias participativas para el desarrollo integral de la producción forraje-leche en la región de Tulancingo (México). Gestión y Análisis de Políticas Públicas. 1(13):1-16. [ Links ]
SIAP. 2018. Servicio de Información Agroalimentaria y Pesquera. México. http://infosiap.siap.gob.mx/gobmx/datosAbiertos.php. [ Links ]
Singh, D. K.; Jaiswal, C. S.; Reddy, K. S.; Singh, R. M. and Bhandarkar, D. M. 2001. Optimal cropping pattern in a canal command area. Agric. Water Manag. 50(1):1-8. [ Links ]
Sofi, N. A.; Ahmed, A.; Ahmad, M. and Ahmad, B. B. 2015. Decision Making in Agriculture: A Linear Programming Approach. Inter. J. Modern Mathematical Sci. 13(2):160-169. [ Links ]
Upadhyaya, A. 2017. Application of optimization technique for crop planning at Institute farm of ICAR RCER, Patna. J. AgriSearch. 4(1):68-70. [ Links ]
Received: January 01, 2020; Accepted: March 01, 2020
 Este es un artículo publicado en acceso abierto bajo una licencia
Creative Commons
Este es un artículo publicado en acceso abierto bajo una licencia
Creative Commons
