


Services on Demand
Journal
Article
 text in
  English (pdf)
 Article in xml format
 Article references
 Send this article by e-mail
Indicators
-
 Cited by SciELO
 -
 Access statistics
Related links
-
 Similars in
SciELO
Similars in
SciELO
Share

 Permalink
Revista mexicana de ciencias agrícolas
Print version ISSN 2007-0934
Rev. Mex. Cienc. Agríc vol.11 n.6 Texcoco Aug./Sep. 2020 Epub Oct 11, 2021
https://doi.org/10.29312/remexca.v11i6.2427
Articles
Carbon in soil, herbs and shrubs in a plantation forest in Jalisco, Mexico
1Campo Experimental Valle de México-INIFAP. Carretera Los Reyes-Texcoco km 13.5, Coatlinchán, Texcoco, Estado de México, México. CP. 56250. (acosta.miguel@inifap.gob.mx; buendia.enrique@inifap.gob.mx; flores.eulogio@inifap.gob.mx; gonzalez.lucila@inifap.gob.mx).
2Campo Experimental Centro Altos de Jalisco-INIFAP. Parque Los Colomos s/n, Colonia Providencia, Guadalajara, Jalisco. CP. 44660. (benavides.juan@inifap.gob.mx).
Adequate sustainable forest management, whether in a plantation or a natural forest, creates carbon sinks that are usually constant over time, however, it is unknown how it affects the activities of vegetation management in carbon sinks in the forest ecosystems. The objective was to estimate the carbon concentration in herbaceous and shrubs, leaf litter and two soil depths (0 to 15 cm and 15 to 30 cm), in a forest plantation with the presence of four tropical species under two management conditions. Carbon measurements were made in grasses and shrubs, leaf litter and two soil depths under two managed and unmanaged conditions in 30 plots with the presence of purple rose (Tabebuia rosea), teak (Tectona grandis), melina (Gmelina arborea) and parota (Enterolobium cyclocarpum). After the collection, the dry weight of each sample was weighed and determined, to determine the carbon content of each of the components. An Anova and Duncan’s test were then performed to determine if there are significant differences. The plot with parota and with management was the one that registered the highest amount of total carbon with 73.94 Mg ha-1, while the plot with teak with management reported the lowest total carbon content, with 45.63 Mg ha-1. As for the carbon content in the soil, it decreases by approximately 35%, as its depth increases, with significant differences.
Keywords: biomass; plantation management; sampling sites
Un adecuado manejo forestal sustentable, ya sea en una plantación o un bosque natural, se crean sumideros de carbono que suelen ser constante en el tiempo, sin embargo, se desconoce cómo afecta las actividades del manejo de la vegetación en los sumideros de carbono en los ecosistemas forestales. El objetivo fue estimar la concentración de carbono en herbáceas y arbustos, hojarasca y dos profundidades de suelo (0 a 15 cm y de 15 a 30 cm), en una plantación forestal con presencia de cuatro especies tropicales en dos condiciones de manejo. Se realizaron las mediciones de carbono en hierbas y arbustos, hojarasca y dos profundidades de suelo en dos condiciones con manejo y sin manejo en 30 parcelas con presencia de rosa morada (Tabebuia rosea), teca (Tectona grandis), melina (Gmelina arborea) y parota (Enterolobium cyclocarpum). Después de la colecta, se pesó y se determinó el peso seco de cada muestra, para determinar el contenido de carbono por cada uno de los componentes. Después se realizó un Anova y la prueba de Duncan para determinar si existen diferencias significativas. La parcela con parota y con manejo fue la que mayor cantidad de carbono total registró con 73.94 Mg ha-1, mientras que la parcela con teca con manejo reportó el menor contenido de carbono total, con 45.63 Mg ha-1. En cuanto al contenido de carbono en el suelo este disminuye en 35% aproximadamente, conforme aumenta su profundidad, existiendo diferencias significativas.
Palabras claves: biomasa; manejo de plantaciones; sitios de muestreo
Introduction
Currently, the consequences of climate change due mainly to the increase in the atmosphere of greenhouse gases (GHG) have serious negative effects and although future scenarios are still uncertain, a massive extinction of species is expected, water shortages and low production in agricultural crops, so it is essential to develop measures to reduce GHG emissions. One of the alternatives evaluated is to increase the capture of C in the biomass and in the soils by preserving the existing forest habitats and to increase the forest plantations as an option of carbon stores. Another alternative is to carry out adequate agricultural practices to further limit GHG emissions, and it must also be implemented on land suitable for its realization. Therefore, in the future different strategies and appropriate policies must be developed for managing forest resources and agricultural activities (IPCC, 2007).
In general, forest ecosystems are good sequestrators of atmospheric CO2 and therefore are important stores of carbon, both in their early and late stages (mature forests) and in particular, rapidly developing species since they increase rapidly. the capture of carbon that later becomes carbon deposits. By carrying out adequate sustainable forest management, whether in a plantation or a natural forest, carbon sinks are created that are usually constant over time, since the volumes of wood are renewed in successive rotations and are reincorporated by carrying out reforestation. on the forest surface.
Wood from a dead tree is broken down by bacterial activity, fungi and invertebrates, which recycle carbon as biomass, dead organic matter and once again return to the atmosphere in the form of gases (CO2 and CH4) or liquids, which Much of it is incorporated into the soil during decomposition processes (FAO, 2000). Also, other physical or biological phenomena can alter carbon sinks such as the dragging and deposition of soil sediments by water or wind erosion, the aggregation of CO2 by rain precipitation, the transfer of living beings and the transport of organic substances, can modify carbon balance.
In Mexico, sustainable forest management of forest areas, whether natural forests, reforestation zones, protected natural areas, or commercial plantations are one of the best options for carbon sequestration, offering an alternative to increase timber and non-timber production. simultaneously. In addition, these activities contribute to the establishment of germplasm banks, soil conservation and maintaining the biodiversity of forest ecosystems (Masera et al., 2000).
In this regard, there are several studies proposed to evaluate the carbon pools in the soil, among which are the works carried out in the dry tropical forest (Gomez, 2008), in southeastern Mexico (De Jong, 1995; De Jong et al., 1999; Soto et al., 2010), in the Sierra Norte de Oaxaca (Acosta et al., 2002) and in the central west (Ordoñez et al., 2001). However, it is unknown how it affects the activities of vegetation management in carbon sinks in forest ecosystems (Figueroa et al., 2005).
Therefore, the objective was to estimate the carbon concentration in herbaceous plants and shrubs, leaf litter and two soil depths (0 to 15 cm and 15 to 30 cm), in a forest plantation with the presence of four tropical species in two conditions of management, established at the Costa de Jalisco Experimental Site of the National Institute of Agricultural Forestry and Livestock Research (INIFAP) in the state of Jalisco.
Materials and methods
Study area
The study area is located within the Costa de Jalisco Experimental Site, belonging to INIFAP, located between the municipalities of La Huerta and Casimiro Castillo in the State of Jalisco, between coordinates 19° 31’ 15” north latitude and 104° 32’ 00” west longitude, at an average altitude of 298 masl. The climate is AW2 (w) warm sub-humid type with rains in summer and an average annual precipitation of 1 100 mm., according to the Köppen classification modified by García (2004).
Data collection
The field information was collected in 30 plots from a plantation with four forest species: Tabebuia rosea (Bertol.) DC. (purple rose), Tectona grandis L.f. (teak), Gmelina arborea Roxb. ex Sm. (melina) and Enterolobium cyclocarpum (Jacq.) Griseb. (parota), made in real frame with a distance of 4 x 4 m of separation between trees, which was established in 1994.
The sampling was carried out completely at random in two management scenarios. On the one hand, the plots with management (removal of herbaceous plants and shrubs), where three conditions were evaluated with the presence of the following species: purple rose, teak, melina, establishing six sampling sites for each plot. On the other hand, the plots without management where there is the presence of herbaceous plants and shrubs, from which biomass data were obtained from both components (herbaceous and shrubs) as one, in this plot 6 sampling sites were also established for each plot with presence of purple rose and parota.
For the evaluation of the carbon content, a modification of the methodology proposed by Marquez (1997) was used to estimate carbon and evaluate the variables of main interest, in this case two components: aerial (bush, herbaceous, leaf litter) and underground (soil at two depths).
Carbon quantification in shrubs and herbaceous plants
To determine the carbon content, six random sampling points were established for each plot, using 1 x 1 m (1 m2) square sites as the sampling unit. All the plant material belonging to the bushes and herbs within the quadrant was obtained by cutting all the existing biomass at ground level. Of the plants that were partially outside the sampling site, only the branches or stems that entered the quadrant were considered (Acosta et al., 2009).
Leaf litter carbon quantification
Sampling sites established for grasses and shrubs were also used to measure litter amount; however, in this case the quadrants were 0.25 m2 (50 x 50 cm squares). Biomass belonging only to leaf litter or mulch was collected in that area. Once all the grass and shrub material had been collected, and litter was placed in a separate blanket bag to be sent to the INIFAP soil laboratory at the Tecoman Experimental Field, Colima. Where they were dried in an oven at 75 ºC for 48 h to obtain the dry weight. To convert the biomass data to carbon, the total biomass per hectare obtained by the constant of 0.5 was multiplied, since, in most species, half of the biomass is carbon in any of its parts (Masera et al., 2000).
Soil carbon quantification
The soil samples were obtained at the same sampling point where the previous components were sampled. To do this, it was performed with an 8 cm diameter auger (AMS - Soil Sampling Equipment) and two soil samples were obtained for each depth level (0-15 and 15-30 cm). In this way, twelve soil samples were obtained for each plot at the previously established sampling sites. Knowing the diameter of the cylinder used and its length, the volume of soil sampled was determined, then when analyzing the soil and determining the percentage of carbon, inferences were made of the amount of carbon per unit area and according to the density of soil samples.
All soil samples were placed individually in plastic bags with their respective label and transferred to the laboratory, where they were dried in a drying oven at a temperature of 60 ºC for 48 h, the roots, stones and other materials such as plant waste and wildlife waste.
Subsequently, the soil samples, already free of roots and other materials, were sieved with a wooden hammer until they passed through a 2 mm mesh, after completely homogenizing them, a subsample of approximately 5 g was extracted, dried at 105 ºC and it was ground for three minutes in a Speck 8000 Mixer/Mill® type mill. Carbon analysis was determined using the direct combustion method at 1 000 ºC, with an automatic total carbon analyzer, equipped with a unit to process solid samples.
The analysis to determine the carbon in the soil samples was performed in the INIFAP soil laboratory in the Tecoman Experimental Field, Colima. To determine the carbon content in quantity, it was necessary to know the apparent density of the soil, for this, its calculation was made, by obtaining the total volume of the soil and then the adjustment, subtracting the volume occupied by roots, stones or any other residue.
Analysis of the information
Tests were carried out to verify that the residual assumptions were fulfilled, normality with the Shapiro-Wilk test and homogeneity of variances using the Levene test, both with a degree of significance (p< 0.05), with the help of the software R© ver 3.6. Since the assumptions were fulfilled, an analysis of variance (Anova) of a factor (plots) was carried out for the carbon values in bushes, leaf litter, soil from 0 to 15 and 15 to 30 cm depth, the Duncan test was used to determine if there were significant differences (p< 0.05) of the variables analyzed by plot (Zar, 2010).
Results
The descriptive statistics of the sampling carried out indicate that the plot with the highest carbon content in the shrubs and herbaceous component is parota with 1.63 ±0.63 Mg ha-1, while the plots with the least quantity (null) were those with management, since this component was completely removed. In the litter component, the plot s with the highest amount of carbon were parota with 6.36 ±5.04 Mg ha-1, but they had great variability, and the plot with the least amount of carbon were those with purple rose I with management (2.9 ±0.81 Mg ha-1). The highest carbon content in soil was found at the depth of 0 to 15 cm, in the parota plot with a 37.68 ±5.42 Mg ha-1 and decreased to 14.54 ±4.13 Mg ha-1 in the teak plot at a depth 15 to 30 cm (Table 1).
Table 1 Basic statistics of carbon content per plot (Mg ha-1).
| Plot | Average | Standard deviation | Minimum | Maximum | |
| Shrubs and herbaceous | Melina | 0 | 0 | 0 | 0 |
| Teak | 0 | 0 | 0 | 0 | |
| Purple Rose I | 0 | 0 | 0 | 0 | |
| Parota | 1.63 | 0.63 | 0.79 | 2.44 | |
| Purple Rose II | 1.42 | 0.63 | 0.78 | 2.2 | |
| Total | 0.61 | 0.85 | 0 | 2.44 | |
| Leaf litter | Melina | 5.78 | 4.8 | 3.27 | 15.48 |
| Teak | 3.06 | 0.48 | 2.63 | 3.98 | |
| Purple Rose I | 2.89 | 0.81 | 2.01 | 4.22 | |
| Parota | 6.36 | 5.04 | 2.67 | 15.88 | |
| Purple Rose II | 3.45 | 0.85 | 2.46 | 4.59 | |
| Total | 4.31 | 3.29 | 2.01 | 15.88 | |
| Soil 0-15 | Melina | 30.17 | 7.51 | 19.41 | 41.34 |
| Teak | 28.03 | 6.11 | 21.21 | 38.59 | |
| Purple Rose I | 26.94 | 11.2 | 8.59 | 41.58 | |
| Parota | 37.68 | 5.42 | 29.02 | 42.93 | |
| Purple Rose II | 35.38 | 5.07 | 30.19 | 43.46 | |
| Total | 31.64 | 8.09 | 8.59 | 43.46 | |
| Soil 15-30 | Melina | 15.78 | 3.62 | 10.26 | 20.06 |
| Teak | 14.54 | 4.13 | 10.05 | 20.54 | |
| Purple Rose I | 21.05 | 7.41 | 15.18 | 35.05 | |
| Parota | 28.27 | 5.95 | 18.51 | 35.57 | |
| Purple Rose II | 28.75 | 6.56 | 22.19 | 36.64 | |
| Total | 21.68 | 8.08 | 10.05 | 36.64 | |
| Total | Melina | 51.73 | 12.09 | 39.35 | 71.56 |
| Teak | 45.63 | 9.49 | 33.9 | 60.17 | |
| Purple Rose I | 50.9 | 15.56 | 34.26 | 78.64 | |
| Parota | 73.95 | 11.3 | 55.89 | 90.78 | |
| Purple Rose II | 69.02 | 10.48 | 57.52 | 84.17 | |
| Total | 58.24 | 15.85 | 33.9 | 90.78 |
Carbon in shrubs and grasses
The concentration of carbon by the components of leaf litter, herbs and shrubs was higher in the plots without management because this component was not removed due to management effects, there being an approximate difference of 1.5 Mg ha-1 in the carbon content of herbs and shrubs, while the litter concentration was approximately 0.95 Mg ha-1. With respect to the plots without management, where the plot with parota and purple rose II were analyzed, the carbon content provided by the herbaceous and shrub vegetation was higher in the parota, by 0.25 Mg ha-1; however, no significant differences were found (Figure 1a).
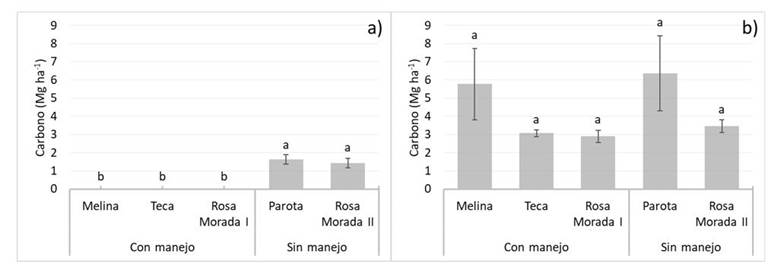
Leaf litter carbon
In the case of litter, the plots with unmanaged parota were those with the highest carbon concentration (6.36 Mg ha-1), while the species with the lowest carbon concentration were the plots with purple rose I with management (2.9 Mg ha-1), without there being a significant difference in this component, mainly due to its high variability in carbon content in the different plots sampled (Figure 1b). In terms of biomass litter estimation, the reported values are in the range that other authors report for tropical areas, which vary from 3.2 to 5.2 Mg ha-1 of mulch biomass reported by (Klinge, 1968; Aguilar, 2004; De Miguel, 2004; Bergamini et al., 2009).
Carbon in soil
The highest carbon content in soil was found at a depth of 0 to 15 cm, in the parota plot with a 37.68 Mg ha-1 and the lowest concentration was registered in the plots of purple rose I with 26.94 Mg ha-1, finding significant differences between the plot with parota and purple rose I, while the remaining plot s, no significant differences were found (Figure 2a).
At the depth of 15 to 30 cm, the carbon content with the highest concentration was the plots of purple rose II with a 28.75 Mg ha-1, very similar to the plots with purple rose II; while the lowest were teak plots with a 14.54 Mg ha-1. In this component, significant differences are found between managed and unmanaged plots, while there are no differences between them (Figure 2b).
The difference between these two depths reflects that in plots with management the carbon content decreases by approximately 50%, while in plots without management it only decreases by approximately 30%, as can be seen in Figure 2. This may be due to because the movement of the humus in the soil profile is downward and its concentration decreases as the depth of the soil increases (Braakhekke et al., 2013; Paz and Etchevers, 2016), but it can also be attributed to the fact that in the soil layers superficial, the greater number of roots develops and the microbial activity is greater.

Figure 2 Means and standard error of carbon quantity in soil (Mg ha-1) of two depths a) 0 to 15 cm; and b) 15 to 30 cm in plantation of different species with and without management. Average values ± standard error followed by letter differences (a, b) indicate significant difference for p< 0.05.
After the carbon concentration analyzes in the soils of the different plots have been carried out, it can be affirmed that at a greater depth the carbon content decreases approximately 35%. This was determined after performing Duncan’s multiple comparisons test, which showed that there are significant differences with a p< 0.05 between the carbon content at the depth of 0 to 15 cm, compared to the amount of carbon measured at the depth. 15 to 30 cm (Table 2).
Table 2 Result of Duncan’s multiple comparisons test between the soil carbon content (Mg ha-1) of two soil depths in plantation of different species with and without management at the Costa de Jalisco Experimental Site.
| Plantation | Depth (cm) | Soil | ||
| Carbon content (average in Mg ha-1) | Duncan grouping | |||
| No handling | 0-15 | 36.53 ±5.15 | a | |
| 15-30 | 28.52 ±5.98 | b | ||
| With handling | 0-15 | 28.39 ±8.15 | a | |
| 15-30 | 17.12 ±5.79 | b | ||
In addition, when performing an analysis of variance to determine if there are significant differences between the plots with management and without management, it was found that the plot with the highest carbon content was at depth from 0 to 15 without management with a 36.53 ±5.15 Mg ha-1, while the lowest carbon concentration was in the plots with management and a depth of 15 to 30 cm (17.12 ±5.79 Mg ha-1) (Table 2). Within the plots without management at different depths it was found that there are significant differences, as well as between the plots with management as can be seen in Figure 3.
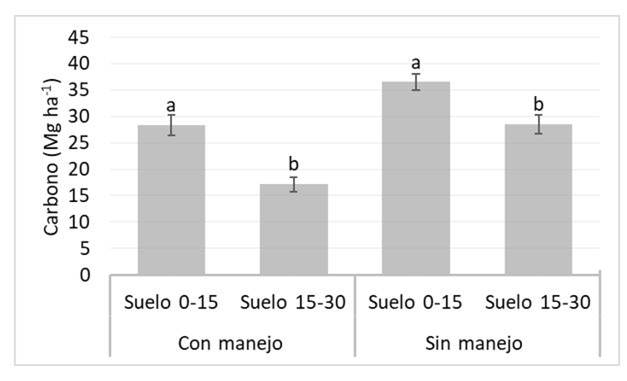
Figure 3 Amount of carbon in soil (Mg ha-1) at two depths a) 0 to 15 cm and b); 15 to 30 cm in plantation of different species with and without management. Average values ± standard error followed by letter differences (a, b) indicate significant difference for p< 0.05.
When the sum of the components was carried out (shrubs and herbaceous, litter, and soil), it was found that the sites with the highest carbon content were the plots without management as can be seen in Figure 4, mainly due to the null herbaceous vegetation and bushy that is eliminated in the cultural works and maintenance of the place. Furthermore, the study reflected that the total carbon concentration, the plots without management had 30% more carbon than the plots with management, with a significant difference.

Discussion
The result obtained in the present work shows that it is not necessary to carry out management, or at least that type of management in the plots for carbon capture purposes, which would also represent a significant decrease in costs by maintaining the plots with plantation. Finally, in the analysis of the total carbon content, it was found that in all the plots with and without management it is in the underground part where the highest carbon content is found, the parota being the species with the highest carbon content with 65.95 Mg ha-1 and 73.94 Mg ha-1 if the carbon content of the aerial part is added; on the other hand, the teak plots only averaged 45.63 Mg ha-1 of total carbon.
This could be explained because the carbon in plants is highly related to nitrogen, since it integrates the amino acid chains necessary to form the complex proteins that will give rise to plant tissues. To obtain the necessary nitrogen from the soil, some plants, such as the parota, which is a legume, maintain symbiotic relationships with microorganisms in the soil that allow them to fix this element in their roots. Due to this type of relationship, plants have a greater efficiency in carrying out their metabolic processes, therefore, their photosynthetic rate increases, which allows a greater accumulation of carbon in plant organs.
From the plots studied in this work, purple rose, teak, melina and parota, at the Coast of Jalisco Experimental Site in La Huerta, Jalisco, it can be seen that the variation in the carbon content of each one did not have significant differences, except for the soil component. However, it was observed that in the plots, without management there is a higher concentration of carbon than those with management; mainly because the herbaceous and shrubby vegetation is maintained in the first plots, since it is not extracted from the ecosystem due to the effect of management.
In contrast, in the managed plots the understory vegetation was removed, which decreases the biomass available to fix carbon and therefore decreases the total amount of carbon present at the sampling site. Regarding underground carbon, the greatest amount was found in the surface layers of the soil (from 0 to 15 cm) and as the depth increased, the concentration of carbon captured decreased.
It was also found that the underground component is the one that contributes the greatest amount of carbon to the total per plot. These results show a typical behavior of carbon in the soil, according to the studies carried out by different authors such as Acosta (2003) and Gómez (2008), who mention that the carbon content in the soil decreases as depth increases.
Conclusions
The plots with the highest carbon content were those without management with the presence of parota with a 73.95 Mg ha-1. For the plantation with management, a decrease in the carbon content was found in the aerial part, mainly from the grasses and shrubs, due to the flattening of the shrub vegetation. The highest concentration of organic carbon in the soil is found in the superficial layers (0 to 15 cm) and as the depth increased, the amount of carbon decreased.
Literatura citada
Acosta-M, J.; Vargas, A.; Velázquez, J. y Etchevers. 2002. Estimación de la biomasa aérea mediante el uso de relaciones alométricas en seis especies arbóreas en Oaxaca, México. Agrociencia. 36(6):725-736. http://www.redalyc.org/articulo.oa?id=30236610. [ Links ]
Acosta-M, M. 2003. Diseño y aplicación de un método para medir los almacenes de carbono en sistemas con vegetación forestal y agrícolas de ladera en México. Tesis de Doctorado. Colegio de Posgraduados. Montecillo, México. 135 p. http://www.sidalc.net/cgi-bin/wxis.exe/?IsisScript=UACHBC.xis&method=post&formato=2&cantidad=1&expresion=mfn=099694. [ Links ]
Acosta-M, M.; Carrillo-A., F. y Díaz-L, M. C. 2009. Determinación del carbono total en bosques mixtos de Pinus patula Schl. et Cham. Terra Latinoam. 27(2):105-114. http://www.scielo.org.mx/pdf/tl/v27n2/v27n2a3.pdf. [ Links ]
Aguilar, A. G. 2004. Los asentamientos humanos y el cambio climático. In: Martínez, J. y Fernández, A. (Comp.). Cambio climático, una visión desde México. INE-SEMARNAT. México, DF. 267-278 pp. [ Links ]
Bergamini, S. M.; Gattig.; Wisniewski, C.; Yukio, M. A.; Targa, C. A.; Lorenzetto, A. and Putini, F. 2009. Patterns of litter production in a secondary alluvial Atlantic Rain Forest in southern Brazil. Revista Brasil. Bot. 32(4):805-817. http://www.scielo.br/pdf/rbb/v32n4/a18v32n4.pdf . [ Links ]
Braakhekke, M. C.; Wutzler, T.; Beer, C.; Kattge, J.; Schrumpf, M.; Ahrens, B.; Schöning, I.; Hoosbeek, M. R.; Kruijt, B.; P. Kabat, P. and Reichstein, M. 2013. Modeling the vertical soil organic matterprof ile using Bayesian parameter estimation. Biogeosciences. 10(1):399-420. http://doi:10.5194/bg-10-399-2013. [ Links ]
De Jong, B. H.; Cairns, M. A.; Haggerty, P. K.; Ramirez, M. N.; Ochoa, G. S.; Mendoza, V. J.; González, E. M. and March, M. I. 1999. Land-use change and carbon flux between 1970s and 1990s in the central highlands of Chiapas, México. Environ. Manag. 23(3):373-385. https://doi.org/10.1007/s002679900193. [ Links ]
De Jong, B.; Montoya, G.; Nelson, G. K.; Soto-Pinto, L.; Taylor, J. and Tipper, R. 1995. Community forest management and carbon sequestration: a feasibility study from Chiapas, México. Interciencia. 20(6):409-416. [ Links ]
De Miguel, S. M.; Harmand, J. M. y Hergoualc’h, K. 2004. Cuantificación del carbono almacenado en la biomasa aérea y el mantillo en sistemas agroforestales de café en el suroeste de Costa Rica. Agroforestería de las Américas 11(41-42):98-104. http://repositorio.bibliotecaorton.catie.ac.cr/bitstream/handle/11554/5997/Cuantificacion-del-carbono-almacenado.pdf?sequence=1&isAllowed=y. [ Links ]
FAO. 2000. Sistemas de uso de la tierra en los trópicos húmedos y la emisión y secuestro de CO2. World Soil Resources Reports 88. Rome. 98 p. http://www.fao.org/3/a-x4590s.pdf. [ Links ]
Figueroa, N. C. J. D.; Etchevers, B. A.; Velásquez, M. M. y Acosta, M. 2005. Concentración de carbono en diferentes tipos de vegetación de la Sierra Norte de Oaxaca. Terra Latinoam. 23(1):57-64. https://www.redalyc.org/articulo.oa?id=57323108. [ Links ]
García, E. 2004. Modificaciones al sistema de clasificación climática de Köppen. México. 5ta (Ed.). Instituto de Geografía-UNAM. México, DF. 90 p. http://www.publicaciones.igg.unam.mx/index.php/ig/catalog/view/83/82/251-1. [ Links ]
Gómez-D. J. D. 2008. Determinación de los almacenes de carbono en los compartimentos aéreo y subterráneo de dos tipos de vegetación en la reserva de la biósfera ‘Sierra de Huautla’, Morelos, México. Tesis de doctorado Programa de Edafología. Colegio de Postgraduados. Campus Montecillo. 194 p. [ Links ]
IPCC. 2007. Cambio climático 2007: Informe de síntesis. Contribución de los grupos de trabajo I, II y III al cuarto informe de evaluación del grupo intergubernamental de expertos sobre el cambio climático-equipo de redacción principal: Pachauri, R. K. y Reisinger, A. (directores de la publicación). IPCC. Ginebra, Suiza. 104 p. https://www.ipcc.ch/site/assets/uploads/2018/02/ar4-syr-sp.pdf . [ Links ]
Klinge, H. 1968. Litter production in an area of Amazonian terra firme forest. Part I. Litter - fall, Organic carbon and total Nitrogen Contents of Litter). Amazoniana: Limnologia et Oecologia Regionalis Systematis Fluminis Amazonas. 1(4):287-302. [ Links ]
Masera, O. R.; De Jong, B. y Ricalde, I. 2000. Consolidación de la oficina mexicana para la mitigación de gases de efecto invernadero. México. 197 p. [ Links ]
Márquez, L. 1997. Validación de campo de los métodos del instituto Winrock para el establecimiento de pácelas permanentes de muestreo para cuantificar carbono en sistemas agroforestales. Guatemala. Universidad del Valle de Guatemala. 45 p. [ Links ]
Ordóñez, J. A.; De Jong, B. H. J. y Masera O. 2001. Almacenamiento de carbono en un bosque de Pinus pseudostrobus en Nuevo San Juan, Michoacán. Madera y Bosques. 7(2):27-47. https://www.redalyc.org/pdf/617/61770204.pdf. [ Links ]
Paz, F. y Etchevers, J. 2016. Distribución a profundidad del carbono orgánico en los suelos de México. Terra Latinoam. 34(3):339-355. https://www.terralatinoamericana.org.mx/index.php/ terra/article/view/153/132 . [ Links ]
Soto, P. L.; Anzueto, M.; Mendoza, J.; Jiménez, F. G. and De Jong, B. 2010. Carbon sequestration through agroforestry in indigenous communities of Chiapas, México. Agroforest Systems, 78(1):39-51. https://doi.org/10.1007/s10457-009-9247-5. [ Links ]
Zar, J. H. 2010. Biostatistical analysis. 5th (Ed.). Prentice Hall. Englewood Cliffs, NJ, USA. 663 p. [ Links ]
Received: May 01, 2020; Accepted: August 01, 2020
 Este es un artículo publicado en acceso abierto bajo una licencia Creative Commons
