


Servicios Personalizados
Revista
Articulo
 texto en
  Inglés (pdf)
 Artículo en XML
 Referencias del artículo
 Enviar artículo por email
Indicadores
-
 Citado por SciELO
 -
 Accesos
Links relacionados
-
 Similares en
SciELO
Similares en
SciELO
Compartir

 Permalink
Revista mexicana de ciencias agrícolas
versión impresa ISSN 2007-0934
Rev. Mex. Cienc. Agríc vol.11 no.6 Texcoco ago./sep. 2020 Epub 11-Oct-2021
https://doi.org/10.29312/remexca.v11i6.2412
Articles
Climate change and potential distribution of lima beans in Mesoamérica and Aridoamérica
1Centro Universitario de Ciencias Biológicas y Agropecuarias-Universidad de Guadalajara. Camino Ing. Ramón Padilla Sánchez núm. 2100. La Venta del Astillero, Zapopan, Jalisco, México. CP. 45110. (carlosbarrera43@gmail.com; pzarazua@cucba.udg.mx; rlepiz@cucba.udg.mx; diegonz@cucba.udg.mx).
The objectives of this investigation were to characterize the ecological descriptors and to evaluate the impacts of climate change on the potential distribution of the lima bean Phaseolus lunatus L. in the Mesoamerica and Aridoamerica regions. A database of sites of occurrence was integrated taking six sources. From the geographical coordinates of these sites of occurrence and by using geographic information systems, values of agroclimatic variables derived from rasters of the Worldclim, USGS/NASA SRTM and CGIAR systems were extracted. Thus, an agroclimatic data matrix was integrated through which the ecological descriptors of Phaseolus lunatus were determined. The distribution of P. lunatus was modeled with the Maxent model. The results showed that P. lunatus adapts to a wide range of environmental conditions that includes a hydric condition that goes from semi-arid to humid, a thermal condition that ranges from tempered to very warm, and has a presence in the altitudinal, thermal and rain ranges of 0-2 386 masl, 13.2-29.9 °C and 400-4 250 mm, respectively. These descriptors indicate the existence of populations carrying genes resistant to climatic stress conditions. The Maxent model successfully modeled the distribution of Phaseolus lunatus in the different climatic scenarios evaluated (AUC= 0.94). The climate change projected by the HADGEM-ES model for 2050 and 2070 and RCPs 4.5 and 8.5 is unfavorable for the distribution of P. lunatus, while according to the CCMS4 model the climate 2050 and 2070 is favorable on the RCP4.5 route and unfavorable on route RCP8.5.
Keywords: adaptation; climate change; ecological descriptors; lima beans
Los objetivos de esta investigación fueron caracterizar los descriptores ecológicos y evaluar los impactos del cambio climático en la distribución potencial del frijol lima Phaseolus lunatus L. en las regiones de Mesoamérica y Aridoamérica. Se integró una base de datos de sitios de ocurrencia tomando seis fuentes. A partir, de las coordenadas geográficas de dichos sitios de ocurrencia y mediante el uso de sistemas de información geográfica, se extrajeron valores de variables agroclimáticas derivados de rasters de los sistemas Worldclim, USGS/NASA SRTM y CGIAR. Así se integró una matriz de datos agroclimáticos mediante la cual se determinaron los descriptores ecológicos de Phaseolus lunatus. Se modeló la distribución de P. lunatus con el modelo Maxent. Los resultados mostraron que P. lunatus se adapta a una amplia gama de condiciones ambientales que incluye una condición hídrica que va de semiárida a húmeda, una condición térmica que oscila de templada a muy cálida, y tiene presencia en los rangos altitudinal, térmico y pluvial de 0-2 386 msnm, 13.2-29.9 °C y 400-4 250 mm, respectivamente. Estos descriptores señalan la existencia de poblaciones portadoras de genes resistentes a condiciones de estrés climático. El modelo Maxent modeló satisfactoriamente la distribución de Phaseolus lunatus en los diferentes escenarios climáticos evaluados (AUC= 0.94). El cambio climático proyectado por el modelo HADGEM-ES para 2050 y 2070 y RCPs 4.5 y 8.5 es desfavorable para la distribución de P. lunatus, mientras que según el modelo CCMS4 el clima 2050 y 2070 es favorable en la ruta RCP4.5 y desfavorable en la ruta RCP8.5.
Palabras clave: adaptación; cambio climático; descriptores ecológicos; frijol lima
Introduction
The modifications that climate change is establishing on the patterns of temperature, atmospheric pressure, wind direction, environmental humidity, availability of solar radiation, evapotranspiration and precipitation, lead to a reconfiguration of the environments under which plant species (cultivated and wild) must grow and develop (Teixeira et al., 2013; Duran et al., 2020). Climate change affects different regions of the world in a different way, which includes the regions of Aridoamerica and Mesoamerica.
This has important implications, especially since Mesoamerica is considered the center of origin and diversity of plants that today are important crops and a source of food for human civilization. Within this region, only Mexico is considered as a primary center of diversity and domestication of some cultivated species, such as Phaseolus vulgaris (common bean); P. acutifolius (tepari bean); P. coccineus (scarlet bean); P. dumosus (annual bean) and P. lunatus (lime bean) (Gepts and Debouck, 1991).
The characterization of the ecological descriptors and the possible impact of climate change on crops and their wild relatives can help to design strategies for adaptation to climate change in agricultural production systems. Phaseolus lunatus L., is a species typical of America, which has two domestication centers: one is located in the Andes around 2000 BC, where a large seed variety (Lima type) was produced, while the second occurs most likely in Mesoamerica around 800 BC, when a small seed variety is obtained. This wild form of small seed is distributed from Mexico to Argentina, while the large seed variety (lime type) is distributed in northern Perú (Paredes et al., 2010).
Serrano-Serrano et al. (2012) evidenced the presence of two wild genetic groups of Phaseolus lunatus in Mesoamerica: one (MI) that has a distribution that refers to the central part of western Mexico, including the Pacific coastal region and another (MII) that has a very wide distribution that occurs towards the Gulf of Mexico, the Yucatán Península, Central and South America. According to these authors and Martínez-Castillo et al. (2014) the most probable region for domestication of P. lunatus of the MI group is an area between the states of Jalisco, Michoacán and Guerrero, while for the MII group it is an area located between Guatemala and Costa Rica (Andueza-Noh et al., 2013; Martínez-Castillo et al., 2014).
The distribution of Phaseolus lunatus has been previously reported in 17 climatic types, with a presence in both the Mesoamerica and Aridoamerica regions, evidencing a wide dispersion and great environmental variability among the habitats of this species (López et al., 2005). In addition, the wild populations of Phaseolus lunatus in the western region of Mexico also show wide morphological variability (López-Alcocer et al., 2016).
Both the persistence and the biomass production of the wild populations of Phaseolus lunatus, show high dependence on the rainfall levels year by year, which are being modified by climate change (Duran et al., 2020), threatening the permanence of these plant genetic resources in their natural habitat. Therefore, the present investigation had the objective of characterizing the ecological descriptors and evaluating the impacts of climate change on the potential distribution of Phaseolus lunatus in the regions of Mesoámerica and Aridoamérica. The information generated could help with future planning for the conservation and use of wild populations of P. lunatus.
Materials and methods
Study area
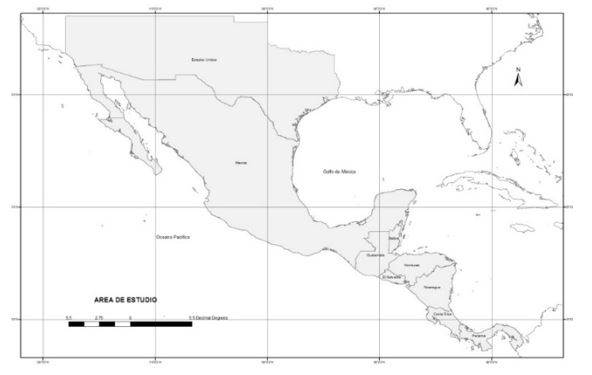
The study area includes the southern United States of America, Mexico and Central America (Figure 1), a region that covers 3 946 177.4 km2 and is culturally known as the Mesoamérica and Aridoamérica regions (Kirchhoff, 1943).
Occurrence data
A matrix of occurrence data of Phaseolus lunatus was integrated from georeferenced passport data based on information from the following entities: International Center for Tropical Agriculture (CIAT), National Institute of Ecology, University of Guadalajara, National Research Institute Forestales, Agrícolas y Pecuarias (INIFAP), Fraitag and Debouck (2002), as well as private data provided personally by Dr. Rogelio Lépiz Ildefonso, Professor-Researcher, CUCBA, University of Guadalajara.
Climatic variables
Normal monthly images of maximum temperature (12), minimum temperature (12), average temperature (12) and precipitation (12) were used, in addition to images of the 19 bioclimatic variables, all derived from the Worldclim system and corresponding to the period 1960-2000. (Hijmans et al., 2005). In addition, 12 normal monthly images of annual potential evapotranspiration (ETP) were used, which were obtained from the CGIAR global geospatial soil water balance database (Trabuco and Zomer, 2010). The longitude, latitude and altitude of the presence sites were also added as analysis variables. For this, the altitude image of the USGS/NASA SRTM site was taken (Jarvis, 2008). With the monthly ETP and precipitation data, 12 monthly humidity index images (IH) were generated using the IH = P/ETP expression. All this information was worked with a resolution given by a cell size of 30 arc seconds. In total, 94 variables were analyzed.
Climatic characterization of presence sites of Phaseolus lunatus
The geographic coordinate information of the lima bean occurrence sites and the climatic and bioclimatic images of the Worldclim system were used to characterize the climatology of the distribution sites of this species. For this, the information extraction procedure of the ArcGis program was used (ESRI, 2010). The extracted information was incorporated into the P. lunatus occurrence data matrix in the Microsoft Excel spreadsheet. Finally, the climatic type of the presence sites was characterized using the system proposed by Ruiz et al. (2018) and that illustratively refer Sánchez et al. (2018), in which 36 environments are theoretically possible, product of the combination of six hydric zones, determined by intervals of a humidity index (IH= annual precipitation/annual potential evapotranspiration) and annual average temperature intervals (Tma), respectively (Table 1).
Table 1 Water zones and thermal zones to characterize types of agroclimatic environments.
| IH intervals | Water zone | Tma intervals (°C) | Thermal zone |
| <0.05 | Hyper-arid | < 5 | Cold |
| 0.05-0.2 | Arid | 5-12 | Semi-cold |
| 0.2-0.5 | Semi-arid | 12-18 | Tempered |
| 0.5-0.65 | Dry subhumid | 18-22 | Semi-warm |
| 0.65-1 | Humid subhumid | 22-26 | Warm |
| 1 | Humid | = > 26 | Very warm |
Statistical analysis
From the climatically characterized site matrix of occurrence, a multiple correlation analysis was performed to refine the list of climatic variables. The correlation coefficient criterion ≥ 0.95 was used for the elimination of variables. With the refined list of variables, a principal component analysis was carried out and the variables with the highest statistical weight in the presence of lima beans were identified. The NTsys 3.3.0 program was used for this analysis (Rohlf, 2009).
Climate descriptors
From the climatic variables selected for the analysis and considering the climatic characterization of the occurrence data matrix, the ecological descriptors of lima beans were deduced, for which the minimum, maximum and average values of each variable were considered.
Modeling of potential niches of distribution of Phaseolus lunatus
Prior to modeling potential distribution niches, a randomness test was applied to determine if the sites of occurrence of Phaseolus lunatus are randomly distributed (Bivand et al., 2014). This test was run using a program implemented in R. The Maxent model (Phillips et al., 2006) was used to model the potential distribution of lima beans under the current or reference climate scenario and under the climate scenarios year 2050 and year 2070.
For the modeling of the potential distribution of P. lunatus in future or climate change scenarios, the data derived from the general circulation models were used: HadGEM2ES (European Network for Earth System-MetOffice Hadley Center) and CCSM4 Community Earth System Model (CCSM4) under two routes of concentration of greenhouse gases (RCP) 4.5 and 8.5. The first model, developed in the United Kingdom, incorporates elements that allow for adequate modeling of continental vegetation as it includes various types of vegetation: broadleaf trees, needle trees, C3 and C4 grasses, as well as shrubs (Bellouin et al., 2007).
The second model is developed in the United States of America by the National Center for Atmospheric Research (NACAR), which incorporates vegetation cover as one of its four coupled components. These models have been statistically evaluated by Conde et al. (2011), conclude that the CCSM Model is one of those that best describes the climate of the Mexico and Central America region, while HadGEM has already been used for studies of the vegetation of Mexico with good results (Instituto de Ecología, 2009).
The Maxent model has been described as being especially efficient in handling complex interactions between response variables and predictor variables, as it is a robust model even in small data samples (Fourcade et al., 2014). Maxent uses the principle of maximum entropy on species presence data to estimate a group of functions that relate environmental variables with habitat suitability to approximate the potential geographical distribution of the species (Phillips et al., 2006). Maxent represents the distribution of a species; through a probability function P on a set X of sites in the study area. The probability function for i environmental variables is expressed as follows.
𝑃(𝑥)=𝑒𝜆∙𝑓(𝑥)/𝑍𝜆. Where: P(x)= probability function; λ= vector of weighting coefficients; f= corresponding vector of functions of environmental variables; Z= normalization constant to ensure that P(x)= 1. The P(x) values thus obtained represent relative suitability values for the presence of the species, thus constituting the basis of a potential distribution model.
In the modeling of the potential distribution of Phaseolus lunatus with Maxent, the default parameters were used, using the replication execution crossvalidate with 1 000 repetitions. 50% of the data was used for training and 50% for testing. In climate change scenarios, this configuration was maintained. Finally, a presence/absence binary map of Phaseolus lunatus was generated using the cutoff threshold method, the one with an omission rate close to 0% but with the highest cutoff value (Sánchez et al., 2018).
Results and discussion
Climatic adaptation of Phaseolus lunatus
In Figure 2, the distribution of Phaseolus lunatus in the different agroclimatic zones of the study area can be observed. As can be seen on the map in Figure 2 and Table 2, this species is present in 17 of the 26 agroclimatic zones in the study area. However, of the 17 agroclimatic zones in which P. lunatus occurs, two correspond to arid zones.
Arid areas can hardly accommodate the development cycle of a legume such as P. lunatus, since the annual precipitation levels in these environments is much less than 500 mm, a value indicated as the minimum rainfall threshold for adaptation of this species (Baudoin, 1989). The presence of P. lunatus in arid zones in the study area is most likely due to having access to the water resource, but not through rainfall.

Table 2 Distribution of Phaseolus lunatus by agroclimatic region.
| Agroclimatic Region | Records | (%) | (%) by index humidity | (%) by thermal index |
| Subhumid humid-very warm | 63 | 10.7 | Humid subhumid | Very warm |
| Humid-warm subhumid | 150 | 25.5 | ||
| Subhumid humid-semiwarm | 37 | 6.3 | ||
| Humid-tempered sub-humid | 2 | 0.3 | 42.9 | 26.2 |
| Humid-very warm | 58 | 9.9 | Humid | Warm |
| Humid-warm | 92 | 15.6 | ||
| Humid-semi-warm | 78 | 13.3 | ||
| Humid-tempered | 13 | 2.2 | 41 | 47.1 |
| Subhumid dry-very warm | 29 | 4.9 | Subhumid dry | Semi-warm |
| Dry-warm subhumid | 27 | 4.6 | ||
| Dry-semi-warm subhumid | 20 | 3.4 | 12.9 | 24 |
| Semi-arid-very warm | 4 | 0.7 | Semiarid | Tempered |
| Semi-arid-warm | 7 | 1.2 | ||
| Semi-arid-semi-warm | 5 | 0.9 | ||
| Semi-arid-tempered | 1 | 0.2 | 2.9 | 2.7 |
| Arid-warm | 1 | 0.2 | Arid | |
| Arid-semi-warm | 1 | 0.2 | 0.3 | |
| Total | 588 | 100 | 100 | 100 |
Table 2 shows that the greatest number of sites of occurrence of Phaseolus lunatus occurs in the warm humid-sub-humid agroclimatic zone, indicating that this is the climatic environment that is closest to the optimal climatic conditions for this plant.
Without considering the arid hydric zone, P. lunatus is able to distribute itself in four hydric zones (from semi-arid to humid) and four thermal zones (from tempered to very warm) although it seems to prefer the sub-humid-humid to humid interval and the interval of semi-warm to very warm. The distribution of this legume in semi-arid and tempered conditions is definitely very small (Table 2).
Ecological descriptors
Table 3 shows the ecological descriptors of Phaseolus lunatus from the most representative climatic variables. As can be seen, even though this legume has a preference for semi-warm, warm and very hot environments (Table 2), its presence at altitudes of 0 to 2 386 m (Table 3) indicates a wide adaptability, since it can be distributed thermally from areas tempered (minimum value of 13.2 °C annual mean temperature, Table 3) even in tempered environments (Table 2). The altitude range found coincides approximately with that reported by López et al. (2005) from 0 to 2059 m and differs slightly from that indicated by Baudoin (1989) from 800 to 2 000 masl, as well as from that reported by Debouck (2020) from 50-2 800 m. These differences are surely due to the different geographical areas considered by these authors.
Table 3 Ecological descriptors of Phaseolus lunatus.
| Variable | Minimum | Maximum | Average |
| Altitude | 0 | 2386 | 605 |
| EC growing season (days) | 83 | 365 | 212 |
| EC mean temperature (°C) | 13.2 | 29.9 | 24.4 |
| EC mean maximum temperature (°C) | 17.3 | 37 | 29.7 |
| EC average minimum temperature (°C) | 8 | 24.2 | 19.1 |
| Accumulated average precipitation EC (mm) | 250 | 4250 | 1368 |
| EC average humidity index | 0.51 | 3.09 | 1.42 |
| Annual mean temperature (°C) | 13.2 | 29.2 | 23.5 |
| Annual average maximum temperature (°C) | 17.3 | 36.1 | 29.6 |
| Annual average minimum temperature (°C) | 4.5 | 22.6 | 17.5 |
| Maximum temperature of the warmest month (°C) | 18.4 | 40.1 | 32 |
| Minimum temperature of the coldest month (°C) | -3.7 | 21 | 14.4 |
| Annual precipitation (mm) | 400 | 4250 | 1466 |
| Annual humidity index | 0.23 | 2.49 | 0.89 |
According to Table 3, the growth season interval in which Phaseolus lunatus occurs (83 to 365 days) coincides with the development cycle that Debouck (2020) reports from 90 to 365 days for P. lunatus.
This interval of 83 to 365 days of growing season, allows us to deduce that this plant adapts to environments with a short rainy season as well as to rainy environments practically all year round, with accumulated precipitation in the growth period of 250 to 4 250 mm, so that some populations of P. lunatus present in these extreme humidity conditions could be indicating the existence of populations carrying genes resistant to these conditions, as suggested by Maxted et al. (2013).
Similarly, in the case of temperature, P. lunatus adapts to growing seasons with an average minimum temperature of 8 °C as well as growing seasons where the maximum temperature can average even 37 °C. The populations representative of these thermal values may also be of interest due to their possible adaptation genetics to extreme temperatures. Furthermore, according to Table 3, there are populations of Phaseolus lunatus that experience the warmest month with maximum temperatures above 40 °C and others that have the coldest month with temperatures below 0 °C, especially those forms of the species of long biological cycle, of indeterminate growth habit (Debouck, 2020).
It is interesting to note that the reports on P. lunatus indicate a thermal range of 16 to 26 °C (Debouck, 2020), in the present study the interval obtained is broader, 13.2 to 29.2 °C on an annual scale and 13.2 to 29.9 °C at the level of the growing season (Table 3). These values constitute thermal adaptation limits not reported to date for P. lunatus, which could indicate that this species has had the ability to explore more thermally extreme areas over time.
Likewise, the present investigation obtained an upper limit of annual accumulated precipitation of 4 250 mm, an amount that exceeds previous reports such as that of Debouck (2020) of 2 800 mm. Finally, according to Table 3, the average humidity index during the production cycle indicates as lower and upper limits of adaptation of P. lunatus, 0.51 and 3.09, respectively. There is no previous reference to these descriptors, because variables such as evapotranspiration, moisture balance and humidity index are not typically parameters considered in the description of crop ecology.
Modeling the potential distribution of Phaseolus lunatus
The randomness test reported that the points of occurrence of Phaseolus lunatus have an agglomerated distribution and not a random distribution, therefore the distances between the points of occurrence were estimated and the data were re-sampled using the ArcGis program (ESRI, 2010), using a mesh constructed from geographic distances to obtain randomly distributed samples. With these samples, the modeling of potential distribution areas of P. lunatus was performed.
Of the total of 94 variables that were considered in the present study, the multiple correlation analysis and the principal components analysis allowed reducing the list to 29 variables with the greatest significance in the distribution of Phaseolus lunatus. Table 4 shows the Eigenvector value of the 29 climatic variables with the greatest significance in the distribution of P. lunatus in the first three main components.
Table 4 Eigenvectors of 29 climatic variables from the analysis of main components of sites of occurrence of Phaseolus lunatus.
| Climate variable | CP1 | CP2 | CP3 |
| Monthly precipitation for November (mm) | -0.9335 | 0.0903 | 0.0962 |
| Precipitation from November to April (°C) | -0.9107 | 0.137 | 0.3526 |
| Annual precipitation (mm) | -0.9007 | 0.084 | -0.2181 |
| Monthly precipitation for October (mm) | -0.8996 | 0.1323 | -0.2914 |
| Monthly precipitation for April (mm) | -0.86 | -0.0146 | -0.1238 |
| Monthly precipitation for May (mm) | -0.8179 | -0.0359 | -0.4224 |
| Monthly precipitation for March (mm) | -0.8047 | 0.1769 | 0.3933 |
| Driest quarter precipitation (mm) | -0.7794 | 0.1437 | 0.5514 |
| Coldest quarter precipitation (mm) | -0.7541 | 0.1796 | -0.0174 |
| Monthly precipitation for June (mm) | -0.7339 | -0.0043 | -0.4235 |
| Monthly precipitation de December (mm) | -0.7205 | 0.1645 | 0.5612 |
| Monthly precipitation for February (mm) | -0.7014 | 0.1974 | 0.6448 |
| Monthly precipitation for September (mm) | -0.6491 | 0.1646 | -0.4407 |
| Rainiest quarter precipitation (mm) | -0.6179 | 0.071 | -0.3424 |
| Daytime average temperature range (°C) | 0.6525 | -0.2517 | -0.0006 |
| Annual temperature range (°C) | 0.6999 | -0.2362 | 0.3352 |
| Seasonality of precipitation | 0.7619 | -0.1008 | -0.3279 |
| Average temperature of the coldest quarter (°C) | 0.1622 | 0.946 | -0.244 |
| Minimum temperature of November (°C) | 0.063 | 0.9392 | -0.11 |
| Minimum temperature of April (°C) | -0.1014 | 0.9384 | -0.0065 |
| Annual mean temperature (°C) | 0.3378 | 0.9356 | 0.0026 |
| Average monthly temperature in April (°C) | 0.2216 | 0.9308 | 0.0314 |
| Minimum temperature of the coldest month (°C) | -0.1693 | 0.9303 | -0.2007 |
| Maximum temperature of August (°C) | 0.5057 | 0.8002 | 0.1607 |
| Maximum temperature from November to April (°C) | 0.4883 | 0.7791 | -0.1814 |
| Maximum temperature of the warmest month (°C) | 0.5855 | 0.694 | 0.1583 |
| Monthly precipitation for January (mm) | -0.5822 | 0.2024 | 0.6881 |
| Seasonality of temperature | 0.515 | -0.0099 | 0.6734 |
| Isothermality | -0.3625 | -0.0326 | -0.7448 |
It is observed then that in the first component variables that have to do with the humidity factor (precipitation) are grouped, in the second component, variables that have to do with the energy factor (temperature) and in the third component, other types of variables that are derived from the interaction of both factors.
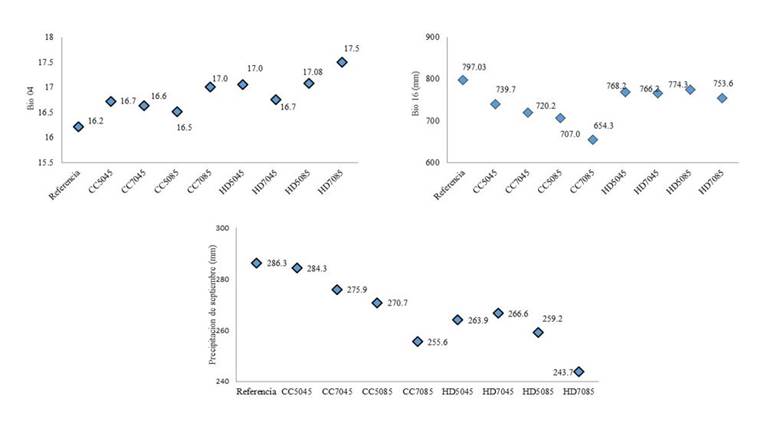
When running the Maxent analysis with the 29 variables, a model was obtained whose operational curve or ROC curve reported an area under the curve (AUC) of 0.94, which according to Araujo et al. (2005) represents an excellent fit of the model and therefore allows a good discrimination of suitable areas against areas not suitable for Phaseolus lunatus (Thuiller et al., 2009) when preparing a binomial map. The Jackknife analysis allowed identifying the variables with the greatest contribution to the modeling of the Phaseolus lunatus distribution. Table 5 shows the contribution of the 11 variables that contribute the most in this regard. Both Bio04, Prec09 and Bio16 remained as the three variables with the greatest contribution to the distribution of this legume in all the analyzed climatologies, both in the reference one and in the climate change climatologies.
Table 5 Percentage of contribution of 11 climatic variables that contribute the most for the modeling of the distribution of Phaseolus lunatus.
| Variable | Contribution percentage | Importance of the permutation |
| Seasonality of temperature (Bio04) | 48.3 | 51.9 |
| Precipitation for the month of September (Prec09) | 13.3 | 3.6 |
| Precipitation of the wettest quarter (Bio16) | 6 | 3.8 |
| Seasonality of precipitation (Bio15) | 4.3 | 2 |
| Precipitation of May (Prec05 | 3.8 | 3.7 |
| Precipitation of December (Prec12) | 3.3 | 2.9 |
| Annual temperature range (Bio07) | 2.1 | 2.9 |
| Average temperature of the coldest quarter (Bio11) | 2.1 | 0.1 |
| Precipitation for the month of February (Prec02) | 2 | 0 |
| Minimum temperature of the coldest month (Bio06) | 2 | 0.9 |
| Minimum temperature in November (Tmin11) | 1.7 | 8 |
The analysis of the evolution that these three variables would have in the climatologies of climate change is presented in Figure 3. There it can be seen that Bio04 tends to increase in climate change scenarios. Prec09, on the other hand, tends to decrease, with a percentage of -1% in the 2050 RCP4.5 CCMS4 model, to 15% in the 2070 RCP8.5 model HADGEM-ES.
Regarding Bio16, the CCMS4 model estimates a reduction both from 2050 to 2070 and when changing from RCP 4.5 to 8.5, while the HADGEM-ES model estimates a stable value of Bio16.
The binary map for the reference scenario revealed that, on a large scale, the current distribution of Phaseolus lunatus coincides with the potential distribution simulated by the Maxent model (Figure 4). However, on a smaller scale potential distribution area are visible that lack sites of current occurrence of this legume. This indicates the presence of suitable sites for future exploration and possible collection of new populations of P. lunatus.
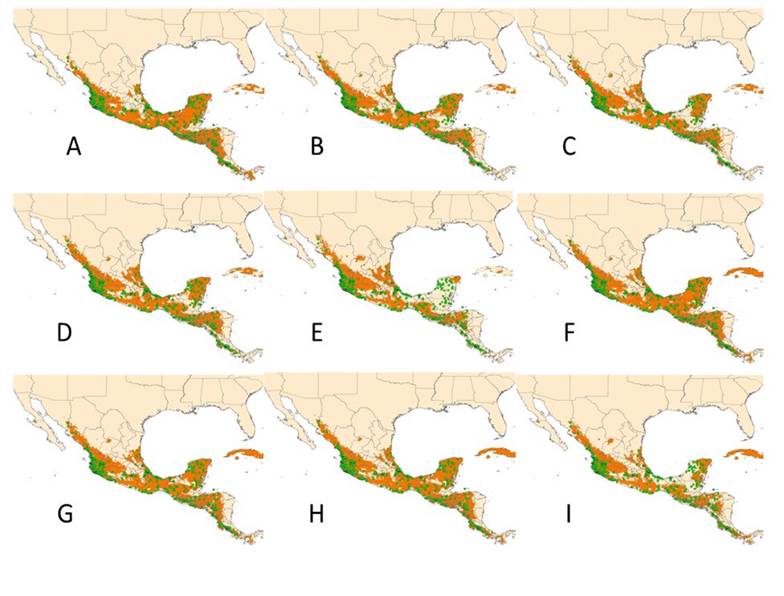
Figure 4 Current distribution (green color) and potential (orange color) of Phaseolus lunatus in various climatologies: A) 1961-2010; B) HADGEM-ES RCP4.5 2050; C) HADGEM-ES RCP4.5 2070; D) HADGEM-ES RCP8.5 2050; E) HADGEM-ES RCP8.5 2070; F) CCMS4 RCP4.5 2050; G) CCMS4 RCP4.5 2070; H) CCMS4 RCP8.5 2050; I) CCMS4 RCP8.5 2070.
In climate change climatologies, the HADGEM-ES model in the two RCPs indicates a decrease in the potential distribution surface of P. lunatus mainly in the Yucatan Peninsula and Central America (Figures 4B, 4C, 4D and 4E) that goes from -8 to -10% in RCP4.5 at a range of -13 to -37% (Figure 5) in RCP8.5. These effects on the Yucatan Peninsula are particularly important, since this area represents one of the most important centers of diversity of the Lima bean MII genetic group.
From the 2050 RCP4.5 scenario (Figure 4B), a decrease in potential areas for this plant is observed, in a direction from south to north of the Yucatan Peninsula, this is northern Guatemala and Campeche, which is accentuated in the following scenarios (Figures 4C, 4D and 4E) covering an increasing area of this territory, until the potential areas are reduced to a small area in the northeast corner of the Peninsula, in the state of Yucatan (Figure 4E).
In the case of the CCMS4 model, Figures 4F, 4G, 4H and 4I show the sequence of maps of potential distribution areas of the lima bean. In it, it can be seen that RCP4.5 represents favorable environmental conditions, which would cause an increase of 7% in 2050 and + 2% in 2070 (Figure 5), occurring mainly in the north-central and western region of Mexico, in addition to the Caribbean (Figures 4F and 4G), which could in the future give rise to the presence of new populations of lima beans in these regions and with it a new configuration of the distribution of this species in the study area. While RCP8.5 would lead to a reduction in the potential surface of lima beans in the Yucatan Peninsula and Central America (Figure 4) from -0.17% in 2050 to -22% in 2070 (Figure 5). These positive and negative results for P. lunatus are consistent with that reported for Tithonia diversifolia in Mexico by Duran et al. (2020).

Conclusions
The greatest number of sites of occurrence of Phaseolus lunatus occurs in the warm humid-sub-humid agroclimatic zone, indicating an optimal climatic condition for this species. However, P. lunatus is present in four hydric zones: semi-arid, sub-humid-dry, sub-humid-humid and humid and four thermal zones: tempered, semi-warm, warm and very warm. The ecological descriptors of Phaseolus lunatus indicate that this plant adapts to a wide range of environmental conditions, as evidenced by an altitude range of 0-2 386 masl, an annual thermal range of 13.2-29.9 °C, and an annual rainfall range of 400-4 250 mm.
These descriptors allow us to deduce the existence of populations carrying genes resistant to extreme climatic conditions. The Maxent model allowed to successfully model the distribution of Phaseolus lunatus. The variables that most contribute to explaining the distribution of this species are Bio04 (temperature seasonality), September precipitation and Bio16 (wettest quarter precipitation). The climate change projected by the HADGEM-ES model for 2050 and 2070 and RCPs 4.5 and 8.5 is unfavorable for the distribution of P. lunatus, while according to the CCMS4 model the climate 2050 and 2070 is favorable on the RCP4.5 route and unfavorable on route RCP8.5.
Literatura citada
Andueza-Noh, R. H.; Serrano-Serrano, M. L.; Chacón-Sánchez, M. I.; Sánchez del Pino, I.; Camacho-Pérez, L.; Coello-Coello, J.; Mijangos C. J.; Debouck, D. G. and Martínez-Castillo, J. 2013. Multiple domestications of the Mesoamerican gene pool of lima bean (Phaseolus lunatus L.): evidence from chloroplast DNA sequences. Gen. Res. Crop Evol. 60(3):1069-1086. [ Links ]
Araújo, M.; Pearson, R.; Thuiller, W. and Erhard, M. 2005. Validation of species-climate impact models under climate change. Global Change Biol. 11(9):1504-1515. [ Links ]
Baudoin, J. P. 1989. Phaseolus lunatus L. In: plant resources of South-East Asia No. 1: Pulses (Ed.). By Maesen, L. J. G. van der Somaatmadja. Wageningen, The Netherlands: Pudoc. 57-60. pp. [ Links ]
Bellouin, N.; Boucher, O.; Haywood, J.; Johnson, C.; Jones, A.; Rae, J. and Woodward, S. 2007. Improved representation of aerosols for HadGEM2. Hadley Centre Technical Note 73, Met Office Hadley Centre. Exeter, EXI 3PB. United Kigdom. 42 p. [ Links ]
Bivand, R. S.; Pebesma, E. J. and Gómez-Rubio, V. 2014. Applied spatial data analysis with R. Doi: 10.1007/978-1-4614-7618-4. Springer. Switzerland. 405 p. [ Links ]
Conde, C.; Estrada, F.; Martinez, B.; Sánchez, O. and Gay, C. 2011. Regional climate change scenarios for México. Atmósfera. 24(1):125-140. [ Links ]
Debouck, D. G. 2020. La agricultura en Mesoamérica. Organización de las Naciones Unidas para la Agricultura y la Alimentación (FAO). http://www.fao.org/tempref/GI/Reserved/ FTP- FaoRlc/old/prior/segalim/prodalim/prodveg/cdrom/contenido/libro09/Cap2-2.htm#auto. [ Links ]
Durán, P. N.; Loya, O. J. L.; Ruiz, C. J. A.; González, E. D. R.; García, P. J. D.; Martínez, G. S. y Crespo, G. M. R. 2020. Impacto del cambio climático en la distribución potencial de Tithonia diversifolia (Hemsl.) A. Gray en México. Rev. Mex. Cienc. Pecu. 11(supl 2):93-106. https://doi.org/10.22319/rmcp.v11s2.4705. [ Links ]
ESRI. 2010. ArcGis Version 10.0. Environmental Systems Research Institute, Inc., Redlands, CA. [ Links ]
Fourcade, Y.; Engler, J. O.; RoÈdder, D. and Secondi, J. 2014. Mapping species distributions with Maxent using a geographically biased sample of presence data: a performance assessment of methods for correcting sampling bias. Plos One. 9(5):1-13. https://doi.org/10.1371/ journal.pone.0097122 PMID. 24818607. [ Links ]
Fraitag, G. and Debouck, D. G. 2002. Taxonomy, distribution, and ecology of the genus Phaseolus (Leguminosae-Papilionoideae) in North America, México and Central America. First Edition Botanical Research Institute of Texas. Fort Worth, Texas. USA. 300 p. [ Links ]
Gepts, P. and Debouck, D. G. 1991. Origin, domestication and evolution of the common bean (Phaseolus vulgaris L.). In: common beans. Research for crop improvement. A. van Schoonhoven, O. and Voysest, O. (Eds.). CAB International. Wallingford, United Kingdom. 7-53 pp. [ Links ]
Hijmans, R.; Cameron, S.; Parra, J.; Jones, P. and Jarvis, A. 2005. Very high resolution interpolated climate surfaces of global land areas. Inter. J. Climatol. 25(15):1965-1978. [ Links ]
Instituto de Ecología. 2009. México cuarta comunicación nacional ante la convención marco de las Naciones Unidas sobre cambio climático. Secretaría de Medio Ambiente y Recursos Naturales (SEMARNAT). México, DF. 274 p. [ Links ]
Jarvis, A.; Guevara, E.; Reuter, H. I. and Nelson, A. D. 2008. Hole-filled SRTM for the globe: version 4: data grid. Web publication site. SRTM 90 m DEM digital elevation database. CGIAR Consortium for Spatial Information http://srtm.csi.cgiar.org/. [ Links ]
Kirchhoff, P. 1943. Mesoamérica: sus límites geográficos, composición étnica y caracteres culturales. Acta Americana. 1(1):92-107. [ Links ]
López, A. J. J.; Lépiz, I. R.; González, E. D. R.; Rodríguez, M. R. y López, A.E. 2016. Variabilidad morfológica de Phaseolus lunatus L. silvestre de la región Occidente de México. Rev. Fitotec. Mex. 39(1):49-58. [ Links ]
López, S. J. L.; Ruiz, C. J. A.; Sánchez, G. J. J. and Lépiz, I. R. 2005. Climatic adaptation of 25 wild bean species (Phaseolus spp.) in Mexico. Rev. Fitotec. Mex. 28(3):221-230. [ Links ]
Martínez-Castillo, J.; Camacho-Pérez, L.; Villanueva-Viramontes, S.; Andueza-Noh, R. H. and Chacon-Sánchez, M. I. 2014. Genetic structure within the Mesoamerican Gene Pool of wildPhaseolus lunatus (Fabaceae) from Mexico as revealed by microsatellite markers: implications for conservation and the domestication of the species. Am. J. Bot. 101(5):851-864. [ Links ]
Maxted, N.; Magos, B. J. and Kell, S. 2013. Resource book for preparation of national conservation plans for crop wild relatives and landraces. University of Birmingham, United Kingdom. 463 p. [ Links ]
Paredes, M.; Becerra, V.; Condón, F.; Germán, S. y Barbieri, R. L. 2010. Utilización de los recursos fitogenéticos. En: Estrategia en los recursos fitogenéticos para los países del Cono Sur. IICA. Montevideo: Procisur. 97-116 pp. [ Links ]
Phillips, S. J.; Anderson, R. P. and Schapire, R. E. 2006. Maximum entropy modeling of species geographic distributions. Ecol. Modelling. 190(3-4):231-259. [ Links ]
Rohlf, F. J. 2009. NTSYSpc: numerical taxonomy system. Ver. 2.21c. Exeter Software: Setauket: New York. 43 p. [ Links ]
Ruiz, C. J. A.; Medina, G. G. y García, R. G. E. 2018. Sistema de información agroclimático para México-Centroamérica. Rev. Mex. Cienc. Agríc. 9(1):1-10. [ Links ]
Sánchez, G. J. J.; Ruiz, C. J. A.; Medina, G. G.; Ramírez, O. G.; De la Cruz, L. L.; Holland, B. J.; Miranda, M. R. and García, R. G. E. 2018. Ecogeography of teosinte. PLoS ONE. 13(2):e0192676. https://doi.org/10.1371/journal. pone.0192676. [ Links ]
Serrano-Serrano, M. L.; Andueza-Noh, R. H.; Martínez-Castillo, J.; Debouck, D. G. and Chacón, M. I. 2012. Evolution and domestication of lima bean in Mexico: Evidence from ribosomal DNA. Crop Sci. 52(4):1698-1712. [ Links ]
Teixeira, E. I.; Fischer, G.; Van Velthuizen, H.; Walter, C. and Ewert, F. 2013. Global hot-spots of heat stress on agricultural crops due to climate change. Agric. Forest Meteorol. 170:206-215. [ Links ]
Thuiller, W.; Lafourcade, B.; Engler, R. and Araújo, M.B. 2009. BIOMOD - a platform for ensemble forecasting of species distributions. Ecography. 32(3):369-373. [ Links ]
Trabucco, A. and Zomer, R. J. 2010. Global soil water balance geospatial database. CGIAR Consortium for Spatial Information. CGIAR-CSI GeoPortal. http://www.cgiar-csi.org. [ Links ]
Received: May 01, 2020; Accepted: June 01, 2020
 Este es un artículo publicado en acceso abierto bajo una licencia Creative Commons
