


Servicios Personalizados
Revista
Articulo
 texto en
  Inglés (pdf)
 Artículo en XML
 Referencias del artículo
 Enviar artículo por email
Indicadores
-
 Citado por SciELO
 -
 Accesos
Links relacionados
-
 Similares en
SciELO
Similares en
SciELO
Compartir

 Permalink
Revista mexicana de ciencias agrícolas
versión impresa ISSN 2007-0934
Rev. Mex. Cienc. Agríc vol.11 no.4 Texcoco may./jun. 2020 Epub 13-Sep-2021
https://doi.org/10.29312/remexca.v11i4.2173
Articles
Mapping of avocado in the south of the state of Mexico by digital image processing sentinel-2
1Facultad de Ciencias Agrícolas-Universidad Autónoma del Estado de México. Carretera Toluca-Ixtlahuaca km 15.5, El Cerrillo Piedras Blancas, Toluca, Estado de México, México. CP. 50295. (dk-figueroa@hotmail.com; agonzalezh@uaemex.mx).
2Facultad de Geografía-Universidad Autónoma del Estado de México. Cerro Coatepec s/n, Ciudad Universitaria, Toluca Estado de México, México. CP. 50110. (xanynemiga@hotmail.com).
The avocado crop (Persea americana Mill.) is one of the most important in Mexico, among the states with the highest production is the State of Mexico, which is the third producing state nationwide. Coatepec Harinas and Donato Guerra are two of the most representative municipalities regarding this activity; however, there is no census that specifies the surface of the crop, so the objective of this research was to test vegetation index methods, spectral angle mapper (SAM) and spectral information divergence (SID) algorithms and the combination of these in Sentinel-2 sensor images to evaluate its performance in identifying areas planted with the avocado crop. The results were validated with a confusion matrix and the comparison of the training and validation reference data. The SID algorithm achieved an accuracy of 97.5% to detect avocado, while the SAM treatment obtained an accuracy of 63.1%. The combination of SID with the Anthocyanin Reflectance Index 1 (ARI1), provided a better result on regional validation mapping with 85% accuracy. Other combinations of indices and treatments gave results less than 50% of the precision, so they are not recommended. This methodology could be tested for the detection of other crops of commercial interest, since Sentinel-2 shows to be a viable alternative for this type of study, having a good spectral resolution, as well as being easily accessible and manipulated.
Keywords: Persea americana Mill.; SAM; vegetation indices
El cultivo de aguacate (Persea americana Mill.) es uno de los más importantes en México, entre los estados con mayor producción se encuentra el Estado de México, que es el tercer estado productor a nivel nacional. Coatepec Harinas y Donato Guerra son dos de los municipios más representativos en lo respectivo a esta actividad; sin embargo, no existe un censo que especifique la superficie del cultivo, por lo que el objetivo de esta investigación fue probar métodos de índices de vegetación, algoritmos spectral angle mapper (SAM) y spectral information divergence (SID) y la combinación de estos en las imágenes del sensor Sentinel-2 para evaluar su desempeño en la identificación de áreas plantadas con el cultivo de aguacate. Los resultados se validaron con una matriz de confusión y la comparación de los datos de referencia de entrenamiento y validación. El algoritmo SID alcanzó una precisión de 97.5% para detectar aguacate, mientras que el tratamiento SAM obtuvo una precisión de 63.1%. La combinación de SID con el índice Anthocyanin Reflectance Index 1 (ARI1), proporcionó un mejor resultado sobre la cartografía de validación regional con 85% de precisión. Otras combinaciones de índices y tratamientos dieron resultados inferiores al 50% de la precisión por lo que no se recomiendan. Esta metodología podría ser probada para la detección de otros cultivos de interés comercial, dado que Sentinel-2 muestra ser una alternativa viable para este tipo de estudios, teniendo una buena resolución espectral, además de ser de fácil acceso y manipulación.
Palabras clave: Persea americana Mill.; índices de vegetación; SAM
Introduction
Mexico is the main avocado producer in the world, with an average annual production of 1 836 700 t, on 235 317 ha (SIAP, 2019), the leading entity in national production is still Michoacán. In second and third place, respectively, are Jalisco and the State of Mexico, the latter contributes with large areas of avocado plantations, which are distributed in different municipalities in the south of the state: Coatepec Harinas 2 155 ha, Tenancingo 884 ha, Temascaltepec 1 558 ha, Donato Guerra 1 493 ha and Villa Guerrero 1 321 ha (SIAP, 2019).
Currently, the avocado Hass absorbed production, since of the total hectares that are dedicated to the avocado planting in the State of Mexico, between 90 and 95% are destined to this fruit (Sangerman et al., 2014). This crop has caused profound changes in the agricultural culture of the region, since areas previously planted with corn were gradually occupied by avocado orchards; likewise, it has brought a series of consequences in the towns and communities of the region (Chávez, 2012).
The importance of the economic impact of avocado cultivation in the State of Mexico, as well as the diagnosis of the area it occupies for efficient and sustainable management, makes the use of remote sensing methods a viable option thanks to its potential in identification of specific agricultural and forest crops, making Sentinel-2 particularly attractive, due to their free availability, with relatively high spatial resolution, as well as strategically positioned bands, useful for many applications including vegetation characterization and mapping (Chemura et al., 2018), as well as tracking a series of land use changes and vegetation, so the satellite is of interest for crops (ESA, 2017).
Vegetation indices are one of the foundations of remote sensing, which resides in a different response of different surfaces to different wavelengths of the electromagnetic spectrum (Pérez, 2017). Each type of vegetation responds differently (Chuvieco, 2007), general parameters are met, given by low reflectivity in the visible, high in the near infrared (NIR) and low with the presence of some peaks in the shortwave infrared (SWIR). These vegetation indices consist of the abstraction or synthesis of the values of the image bands to a single band by arithmetic operations, the result is normally adjusted on a scale of 0 to 1, but it can vary (Chemura et al., 2016).
Due to the characteristics of Sentinel-2 and the economic importance of the avocado crop and its distribution, the objective of this research was to test vegetation index methods, spectral angle mapper (SAM) and spectral information divergence (SID) algorithms and the combination of these in the free access images of the Sentinel-2 sensor to evaluate its performance in the identification of areas planted with the avocado crop. It is considered of great value to have detailed information on the distribution and area of this crop to show those interested in information that is closer to reality and thus propose more effective management strategies.
Materials and methods
The vegetation index methods, SAM and SID algorithms and the combination of the latter with the vegetation indexes were applied in the free access images of the Sentinel-2 sensor, May 2, 2017, resampled at a spatial resolution of 10 m, cloud free and at 1C processing level; that is, in reflectance values at the top of the atmosphere (TOA).
For the identification of the crop of interest, it was carried out with the image treatment methodology, obtaining an individual result of the spectral analysis of the avocado signature with the spectral angle mapper (SAM) and spectral information divergence (SID) algorithms, the use of vegetation indices and the combination of algorithms with vegetation indices.
Study area
The study was carried out in two municipalities in the south of the State of Mexico (Figure 1). Coatepec Harinas is part of the second system of the Xinantecatl, so its altitude varies from 1 900 to 3 000 m, its climate is temperate sub-humid, with an average temperature of 16.1 °C and an average annual rainfall of 1 242.53 mm. mesophyll forest of mountain.
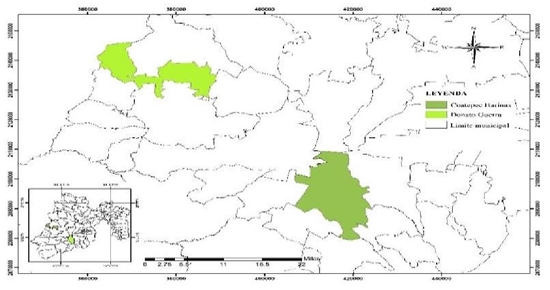
Donato Guerra is located in the region that belongs to the Eje Transversal Mexicano, which is why it presents characteristic forms of rugged relief, semi-flat and flat, most of the mountains are of volcanic origin with an altitude between 2 200 and 3 040 meters above sea level, their climate is subhumid temperate with an average temperature of 22 °C and an average rainfall of 1 000 mm (PMDUCHEM, 2009; PMDUDGEM, 2009).
Field data
Two reference data sets were applied, one for training and the other for validation. The field data for the training process was obtained on May 18, 2017 with a portable digital Garmin® GPS, achieving accuracies between three and five meters, which consisted of 130 georeferenced field data points for avocado cultivation, randomly distributed in the study area.
Regarding the data set for validation, 120 points were geo-referenced in areas of each municipality totally remote from the first sampling points (training), so it should be mentioned that this data set is completely independent from the first data set and was not used for Sentinel-2 image training. In addition, there are leptosol soils in the study area.
Image acquisition and preprocessing
The Sentinel-2 data was downloaded from the European Space Agency (ESA) server available at: https://scihub.copernicus.eu/dhus/: accessed on June 06, 2017 with the scene name: S2B-MSIL1C-20171128T170639-N0206-R069-T14QMG-20171128T221610,S2B-MSIL1C-20171128T1706 39 -N0206-R069-T14QLG-20171128T221610;S2B-MSIL1C-2017112 8T170639-N0206-R069-T14QMF-20171128T221610 corresponding to May 7, 2017, date on which cloud-free images were obtained. The images were re-sampled at a spatial resolution of 10 m with the free software SNAP 5.0 developed and distributed by the European Space Agency (ESA).
The image was calibrated radiometrically by the flat field calibration method, an area of interest ROI (Region of Interest) was marked using the laminated roof of the greenhouses as a reference, because they emit a high and homogeneous response, and the average wavelength of each band with ENVI 4.7 software.
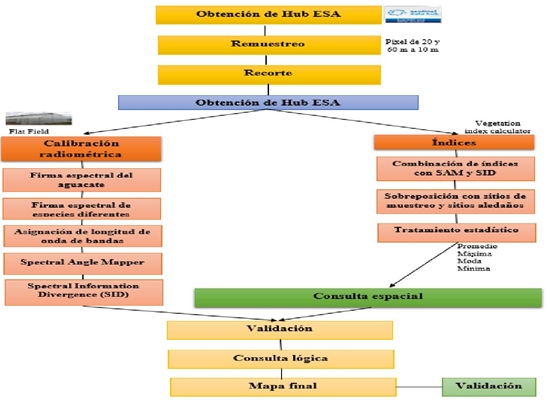
Sentinel-2 image processing
The image was processed using two strategies: the use of the spectral angle mapper (SAM) and spectral information divergence (SID) classifiers and the development of logical queries on vegetation indexes. Figure 2 shows the process of the combined method applied to the Sentinel-2 MSI image to obtain the avocado cultivation sites in the study area.
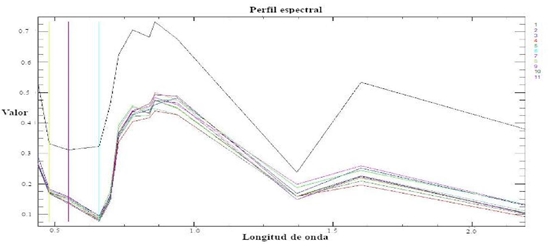
The typical spectral curve of the avocado crop was obtained and from the excluded libraries the vegetation of laurel, jasper mountain range, strawberry tree and two oak varieties was excluded, with which the spectral signature was obtained (Figure 3).
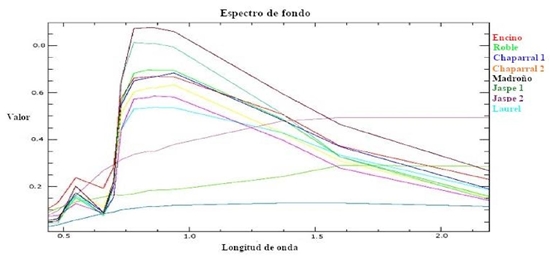
These spectral signatures were kept for reference and were used to classify the image considering the SAM and SID algorithm. Reliability rules were generated with the spectral signatures obtained from the avocado crop according to their classification and tests were carried out to visualize which one generated a clearer result. Regarding the angle chosen for SAM and SID, which produces a classified image based on its maximum angle threshold, the maximum angles of 0.1, 0.075, 0.05 and 0.025 were tested.
A classification of plantations found in the field was carried out according to that reported by Rubi et al. (2013) trees from 1 to 3 years old (Figure 4), 3 to 6 years old (Figure 5) and the third tree from 6 years and older (Figure 6) that show greater distance in bands 8, 10 and 12 The behavior curve of each classification of the plantations was obtained.
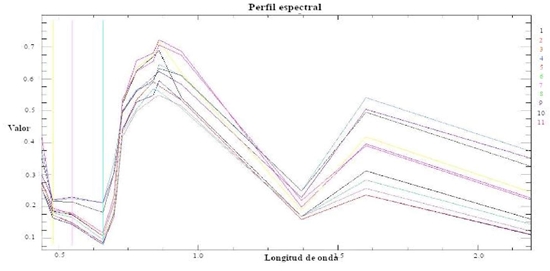
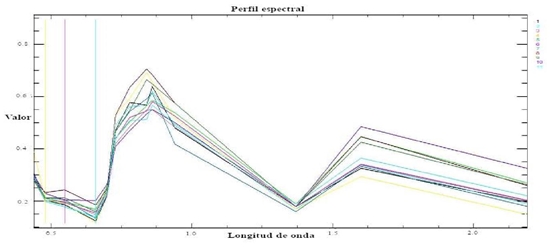
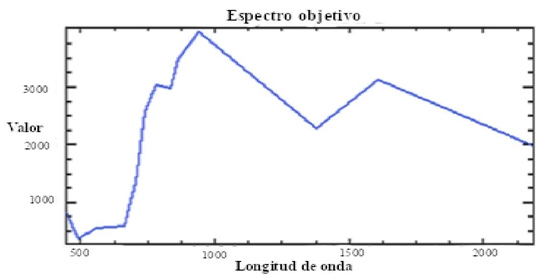
In order to apply each one of the algorithms and vegetation indexes according to the type of plantations present in the study area, only ten trees were chosen that presented the typical curve of avocado cultivation (Figure 7) of behavior of each of the spatial patterns corresponding to plantations.
For identifying areas avocado cultivation was applied to the SAM and SID algorithms different values of maximum angle (radians) chosen based on trial and error (Table 1).
Table 1 Algorithm and applied angle.
Algorithm |
Place and type of plantation |
Maximum angle |
|
SAM SID |
Coatepec plantations from 1 to 3 years Coatepec plantations from 3 to 6 years Coatepec plantations over 6 years |
0.1, 0.075, 0.05, 0.025 |
|
SAM SID |
Donato plantations from 1 to 3 years Donato plantations from 3 to 6 years Donato plantations over 6 years |
0.1, 0.075, 0.05, 0.025 |
Vegetation indices
Using the Envi 4.7 software, 10 available vegetation indices were tested, from which four vegetation indices were obtained that provided the best results: anthocyanin reflectance index 1 (ARI1), anthocyanin reflectance index 2 (ARI2), normalized difference vegetation index (NDVI) and simple ratio index (SR) (Table 2).
Table 2 Calculated vegetation indices and relation of bands ‘B’ used.
Index |
Abbreviation |
Sentinel-2 bands |
Author |
Anthocyanin reflectance index 1 |
ARI1 |
Sentinel-Hub (2017) |
|
Anthocyanin reflectance index 2 |
ARI2 |
||
Normalized difference vegetation index |
NDVI |
||
Simple ratio index |
SR |
In ArcGis 10.2.2 software, the minimum, average and maximum values of these indices were analyzed in sites with and without avocado. Having understood the characteristic values of the avocado, logical queries were constructed by means of the direct query of the value of each pixel in the scene to extract the values of the indices, with the criteria that are displayed below (Table 3 and 4).
Table 3 Value of the conditional applied to each of the indices.
Index |
Place and type of plantation |
Applied conditional consultation |
|
ARI1
|
Coatepec from 1 to 3 years Coatepec over 6 years Donato from 3 to 6 years |
Value >= 0.39 |
ARI2 |
Coatepec from 1 to 3 years Donato from 3 to 6 years Donato over 6 years |
|
NDVI |
Coatepec from 3 to 6 years Donato over 6 years |
|
SR |
Donato over 6 years |
Value >= 2.45 |
A value of 1 was assigned for pixels that meet the condition and 0 for pixels with no value. Value= pixel value.
Table 4 Value of the conditional applied to the combinations of indexes and algorithms.
Combinations |
Place and type of plantation |
Applied conditional consultation |
|
SAM + ARI1 SAM + NDVI SID + ARI1 SID + ARI1 SID + ARI 2 SID + NDVI SID + SR |
Coatepec from 3 to 6 years Coatepec from 3 to 6 years Coatepec from 1 to 3 years Donato from 3 to 6 years Donato from 3 to 6 years Coatepec from 3 to 6 years Coatepec from 3 to 6 years Coatepec from 3 to 6 years Donato from 3 to 6 years Donato from 3 to 6 years |
Value >= 0.025 and value <= 0.65-1.35 Value >= 0.1 and value <= 0.5-0.73 Value >= 0.05 and value <= 0.2-0.145 Value >= 0.1 and value <= 03-0.145 Value >= 0.1 and value <= 0.34-0.95 Value >= 0.05 and value <= 0.5-0.73 Value >= 0.075 and value <= 0.5-0.73 Value >= 0.1 and value <= 0.5-0.73 Value >= 0.1 and value <= 2.45 Value >= 0.075 and value <= 2.45 |
Algoritmos |
Ángulo |
|
|
SAM SID |
Coatepec from 3 to 6 years Donato over 6 years |
Value= 0.1, 0.075, 0.05, 0.0025 Value= 0.1, 0.075, 0.05, 0.0025 |
A value of 1 was assigned for pixels that meet the condition and 0 for pixels with no value.
For the mapping of crops, the same range of conditionals was not necessarily considered for all the scenes, since the index values can vary from scene to scene, so the threshold of index values that correspond to the cultivation of interest. The regions extracted, both from the classifier and from the indexes, were related using map algebra with the combinatorial and tool. This allowed consulting those sites where both (the SAM and SID classifier and the conditional indexes) have a true value.
Map validation
The precision obtained by these digital treatments in the image was validated by means of the superposition of this cartography against validation points obtained in the field. This validation data set allowed the creation of a confusion matrix (Table 5) with which the value was obtained as a percentage of the precision of the treatments and the commission error, in which it is observed that both the SID algorithm and its combinations have the highest percentage of precision for obtaining areas with avocado plantations in the study area.
Table 5 Confusion matrix of combinations of SAM, SID and vegetation indices.
Number of pixels |
|
Percentage |
|||||
Treatment |
Success |
Error |
|
Total |
Success |
Error |
Commission error |
SAM |
76 |
44 |
|
120 |
63.1 |
36.6 |
6.7 |
SID |
117 |
3 |
|
120 |
97.5 |
2.5 |
13.2 |
ARI1 |
103 |
17 |
|
120 |
85.8 |
14.1 |
11.6 |
ARI2 |
80 |
40 |
|
120 |
66.6 |
33.3 |
18.7 |
NDVI |
108 |
12 |
|
120 |
90 |
10 |
31.7 |
Simple Ratio |
95 |
25 |
|
120 |
79.1 |
20.8 |
26.8 |
SAM + ARI1 |
63 |
57 |
|
120 |
52.5 |
47.5 |
2.44 |
SAM + NDVI |
74 |
46 |
|
120 |
61.6 |
38.3 |
4.2 |
SID + ARI1 |
102 |
18 |
|
120 |
85 |
15 |
9.7 |
SID + ARI2 |
80 |
40 |
|
120 |
66.6 |
33.3 |
41.1 |
SID + NDVI |
108 |
12 |
|
120 |
90 |
10 |
14.2 |
SID + SR |
95 |
25 |
|
120 |
79.1 |
20.8 |
23.6 |
Results and discussion
The validation results indicate that the combination with SID achieved an accuracy of 97.5% to detect avocado, while the SAM treatment obtained an accuracy of 63.1%, being SID a more effective algorithm than SAM, both individually and in combination with vegetation indices, so we agree with what was mentioned by Du et al. (2004) that SID is a spectral classification method that uses a measure of divergence to match the pixel response of the image to the reference spectra.
As with what was observed by Du et al. (2004), who indicates that the SID algorithm can characterize spectral similarity and variability more efficiently than other classification algorithms, since it sees each pixel spectrum as a random variable, and then measures the discrepancy of the probabilistic behaviors that exists between two spectra. Regarding the vegetation indexes tested, the highest percentages of success are ARI1 with an accuracy of 85.8% and NDVI 90%.
Among the combinations of vegetation indices with the algorithms and the result of the confusion matrix (Table 5), the methods that achieved greater precision are: SID with the indices ARI1, ARI2, NDVI and SR with a percentage of 85%, 66.6 %, 90% and 79.1% respectively, despite the sum of the algorithm with the NDVI index it obtained a higher percentage of precision, in this case it is not recommended because it tends to overestimate the established area of avocado plantations, the combination of SID plus ARI2 shows a too conservative result underestimating the area of avocado plantations currently established (Figure 8 to 11).
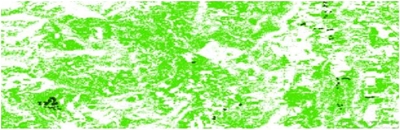
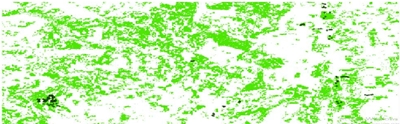

Figure 10 Combination of the SID + ARI2 index plantations from 3 to 6 years old and validation points.
Other combinations of indices and methods gave results less than 60% of the precision, so they are not recommended. Regarding the combinations of the spectral angle parameters with the vegetation indices, a better response was obtained with the maximum angle (radians) 0.025, 0.05 and 0.075, resulting in an image with greater coherence and better quality, as mentioned by Robson et al. (2016) that the additional extraction of specific spectral information shows strong correlations between the derived vegetation indices and a series of measured parameters.
The results obtained from the combined methods applied to the Sentinel-2 image show reliability when exposing sites with a high probability of being planted with avocado crops, which is corroborated with what was observed by, which indicates that the results of the classification confirm the high Sentinel-2 potential to obtain specific crop types and tree species maps.
In terms of spectral information, the red curve and short-wave infrared waves (SWIR) for mapping the vegetation, as well as the blue band were important in obtaining the presence of the avocado crop in the study area. The result of the presence of planted area of avocado cultivation in the municipalities of Coatepec Harinas and Donato Guerra with 70% precision (Figures 11 and 12) is 5 658.62 ha and 5 901.57 ha, with a total of 11 560.19 ha.
Data that differs from those reported by SIACON (2017), who reports an area for these two municipalities of 5 501.36 ha, as well as the SIAP (2017), which reports 3 188.36 ha for the two municipalities, for 2018 the SIAP reports a planted area of avocado in Coatepec Harinas of 2 155 ha and for Donato Guerra 1 493 ha. The difference in the reported data on the planted area of the avocado crop in the study area with respect to those obtained is attributed to the fact that official statistics are three and one year’s different from the information obtained.
With the treatments applied to the Sentinel-2 image, in addition to the existence of reports that avocado plantations have increased in the study area in recent years. It is important to mention that these new plantations are being established in areas previously covered with forest, which causes deforestation of them, becoming the source of significant environmental problems in the short, medium and long term, as occurs in the state of Michoacán, where experts point to the avocado crop as being responsible for an ecocide of incalculable magnitudes (Montiel et al., 2008; Toledo et al., 2009).
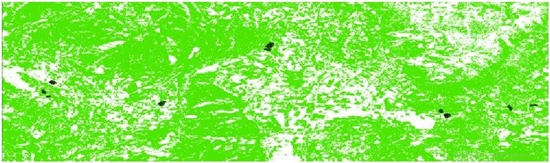
Figures 12 and 13 show the avocado mapping in Coatepec Harinas and Donato Guerra, State of Mexico, obtained by combining the SID and the ARI1 index, on the result obtained from the combination of the algorithm and the index, the validation points were superimposed obtained in the field. These are found in areas identified with the presence of avocado cultivation in both municipalities, in addition to displaying a pattern of behavior with the establishment of avocado plantations.

Figure 12 Mapping of the avocado in Coatepec Harinas, State of Mexico, obtained by combining the SID and the ARI1 index.
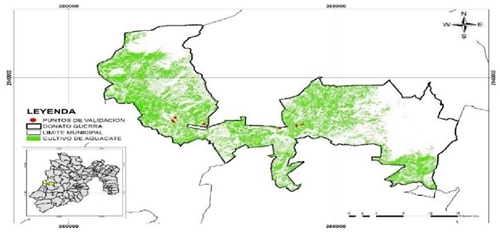
Figure 13 Mapping of avocado in Donato Guerra, State of Mexico, obtained by combining the SID and the ARI1 index.
In areas with steep slopes and areas where previously there was another type of vegetation, which coincides with that observed by Chávez et al. (2012) that the complexity of avocado cultivation due to the large area it occupies, its production cycle, the use of agrochemicals and the effect on the environmental environment, make this product-system drastically influence the change in land use and in the deterioration of the environment in which it thrives.
In the Figure 13 shows that the result obtained with these methods shows an increase in the area planted with the avocado crop to the northwest of the municipality of Donato Guerra, which may be influenced by its proximity to the state of Michoacán. The vegetation that provided results closest to what happens in the field was that of 1 to 3 years and 3 to 6 years with the angle 0.0025 and 0.0075 with the combination SID plus ARI1.
The vegetation index with the best percentage of precision both individually and in combination with SID was NDVI, which obtained 90% precision; however, it should be noted that the result on the validation cartography at the regional level shows an overestimation of the presence of the avocado crop. Therefore, it is attributed to the commission error, being the combination of SID plus ARI1 with 70% precision that minimally underestimates the presence of the avocado crop. A greater precision is appreciated due to the presence of a number of more representative pixels compared to the other combinations, this is attributed to the age of the plantations that according to the index and type of vegetation to determine it, trees from 1 to 3 years and 3 to 6 years were the ones that showed a uniform behavior both in the spectral signature and in the result obtained.
The change in antiocyanin, which is a pigment that gives plants red, blue, or purple, in the leaves indicates changes in foliage, shoot growth, or death. However, weakening vegetation contains higher concentrations of anthocyanins, making this index a measure of stressed vegetation. Affirmation with which it differs, because its behavior in plantations with ages from 1 to 3 years and from 3 to 6 years showed good performance.
This is attributed to the fact that increases in ARI1 indicate changes in the foliage through new growth, which is why this index was correct. According to the behavior of the NDVI index and its combination with SID. Where commission error was obtained and vegetation and patterns did not fully meet the requirements of this index, it is attributed to what was observed by Gill et al. (2009) who comments that the NDVI has some problems in estimating the vegetation cover.
For example, this index begins to saturate when the vegetation cover is over 50% and is not sensitive to green when the vegetation cover is low. For this reason, it can overestimate or underestimate the vegetation cover, giving erroneous information in some areas (Zhongming et al., 2009). Probably one of the explanations for the lack of precision and errors in the indexes and combinations applied to this research is due to what was found in several studies (Castro et al., 2004; Sánchez and Castro, 2006; Kalacska et al., 2007), having a pixel size of 10 m, if the surface occupied by the tree tops is less than this, species identification problems may occur, which is one of the reasons for not finding satisfactory results. It could be the contamination of the pixel by climbing, epiphytic or nonstructural species, leading to confusion in the characteristic spectral signature of trees, as has been shown in studies carried out in tropical forests.
Authors like Abdulridha et al. (2019) in their remote sensing detection research on avocado diseases mentions that the avocado industry would benefit from an automated and remote detection method to help growers make timely management decisions. Therefore, it is important to recognize that the technology of remote sensors that, given its exhaustive spatial focus and the timing of visits to the same pixel, poses an efficient and low-cost solution (Zhang et al., 2012).
Therefore, the quality of the results and the availability of the information makes Sentinel-2 a viable and reliable alternative for the avocado crop identification. This can be supported by adopting measures proposed in various studies (South et al., 2004; Peña et al., 2008; Peña et al., 2011) in which the information on the use of agricultural land is updated routinely in many growing regions in the USA and Europe; through farmer communications or visits by administrative inspectors to selected fields.
Conclusions
The vegetation index methods, SAM and SID algorithms and the combination of these in the free access images of the Sentinel-2 sensor, show high potential for the identification of areas planted with the avocado crop. The Sentinel-2 image processed with the SID algorithm has great potential for vegetation identification studies, showing high resolution and precision. The ARI1 vegetation index provided greater reliability when determining the pattern followed by the avocado crop.
Literatura citada
Abdulridha, J.; Ehsani, E.; Abd-Erahman, A. and Ampatzidis, Y. 2019. A remote sensing technique for detecting laurel wilt disease in avocado in presence of other biotic and abiotic stresses. Computers and Electronics in Agriculture. 156:549-557. [ Links ]
Castro, K. L.; Sánchez, G. A. y Caelli, T. 2004. Discrimination of lianas and trees with leaf-level hyperspectral data. Remote Sensing of Environment. 90(3):353-372. Doi.org/10.1016/j.rse.2004.01.013. [ Links ]
Chavéz, L. G.; Tapia, V. L. M.; Bravo, E. M.; Sáenz, R. T.; Munoz, F. H. J. y Vidales, F. I. 2012. Impacto del cambio de uso de suelo forestal a huertos de aguacate. INIFAP. 13. ISBN: 978-607-425-825-7. https://www.researchgate.net/publication/265125083-Impacto-del-cambio-de-uso-del-suelo-forestal-a-huertos-de-aguacate-impact-of-forest-land-use-change-to-avocado-orchards. [ Links ]
Chemura, A.; Mutanga, O. and Dube, T. 2016. Separability of coffee leaf rust infection levels with machine learning methods at Sentinel-2 MSI spectral resolutions. Precision Agric. 18(5):859-881. Doi:10.1007/s11119-016-9495-0. [ Links ]
Chemura, A.; Mutanga, O.; Odindi, J. and Kutywayo, D. 2018. Mapping spatial variability of foliar nitrogen in coffee (Coffea arabica L.) plantations with multispectral Sentinel-2 MSI data. ISPRS Journal of Photogrammetry and Remote Sensing. 138:1-11. Doi.org/10.1016/j.isprsjprs.2018.02.004. [ Links ]
Chuvieco, E. 2007. Teledetección ambiental. La observación de la tierra desde el espacio. Editorial Ariel, SA., Barcelona. 67-70 pp. [ Links ]
Du, Y.; Chang, C.; Ren, H.; Chang, C. and Jensen, J. 2004. New hyperspectral discrimination measure for spectral characterization. Optical Engineering. 43(8):1777-1786. Doi:10.1117/1.1766301. [ Links ]
ESA. 2017. European Space Agency. El programa Copérnico. http://www.esa.int/esl/ESA-in-your-country/Spain/El-programa-Copertnico. [ Links ]
Gill, T. K.; Phinn, S. R.; Armston, J. D. y Pailthorpe, B. A. 2009. Estimating tree-cover change in Australia: challenges of using the MODIS vegetation index product. International Journal of Remote Sensing. 30(6):1547-1565. [ Links ]
Kalacska, M.; Sánchez, A. G. A.; Rivard, B.; Caelli, T.; White, H. P. y Calvo, A. J. C. 2007. Ecological fingerprinting of ecosystem succession: estimating secondary tropical dry forest structure and diversity using imaging spectroscopy. Remote Sensing of Environment, 108(1):82-96. Doi.org/10.1016/j.rse.2006.11.007. [ Links ]
Montiel, A. L.; Krishnamurthy, A.; Vázquez, A. M. y Uribe, G. P. 2008. Opciones agroforestales para productores de aguacate. Terra latinoamericana. 26(1):234-244. http://www.scielo.org.mx/scielo.php?script=sci-arttext&pid=S0187-57792008000100011 &lng=es&tlng=es. [ Links ]
Peña, B. J. M.; López, G. F.; García, T. L.; Jurado, E. M.; Sánchez, O. M. and García, F. A. 2008. Discriminating cropping systems and agro-enviromental measures by remote sensing. Agronomy for Sustainable Development. 28(2):355-362. doi.org/10.1051/agro:2007049. [ Links ]
Peña, B. J. M.; Ngugi, M. K.; Plant, R. E. and Six, J. 2011. Object-based crop identification using multiple vegetation indices, textural features and crop phenology. Remote Sensing of Environment. 115:1301-1316. Doi: 10.1016/j.rse.2011.01.009. [ Links ]
Pérez de la Cruz, M.; Hernández-May, M. A.; De la Cruz-Pérez, A. y Sánchez-Saul, S. 2017. Scolytinae y Platypodinae (Coleoptera: Curculionidae) de dos áreas de conservación en Tabasco, México. Revista de Biología Tropical. 64(1):335-342. [ Links ]
PMDUCH. 2009. Plan municipal de desarrollo urbano de Coatepec de Harinas, Estado de México. Datos estadísticos proporcionados por el DDR 078 Coatepec de Harinas. http://seduv.edomexico.gob.mx/planes-municipales/Coatepec de harinas. [ Links ]
PMDUDG. 2009. Plan municipal de desarrollo urbano de Donato Guerra, Estado de México. Datos estadísticos proporcionados por el DDR 078 Donato Guerra. http://seduv.edomexico.gob.mx/planes-municipales/Donato guerra. [ Links ]
Robson, A. J.; Petty, J.; Jayce, D. C.; Marques, J. R. and Hofman, P. J. 2016. High resolution remote sensing, GIS and Google Earth for avocado fruit quality mapping and tree number auditing. In: XXIX International Horticultural Congress on Horticulture: Sustaining Lives, Livelihoods and Landscapes (IHC2014): 1130:589-596. [ Links ]
Rubí, A. M.; Franco, M. A. L.; Rebollar, R. S.; Bobadilla, S. E. E.; Martínez, D. I. y Siles, H. Y. 2013. Situación actual del cultivo del aguacate (Persea americana Mill.) en el Estado de México. Tropical and Subtropical Agroecosystems. 16(1):93-101. http://www.redalyc.org/articulo.oa?id=93927469014. [ Links ]
Sangerman, J. D. M.; Larqué, S. B. S.; Omaña, S. J. M.; Shwenstesius, R. R. y Navarro, B. A. 2014. Tipología del productor de aguacate en el Estado de México. Rev. Mex. Cienc. Agríc. 5(6):1081-1095. http://www.redalyc.org/articulo.oa?id=263131532014. [ Links ]
Sánchez, A. G. A. and Castro, E. K. 2006. Canopy observations on the hyperspectral properties of a community of tropical dry forest lianas and their host trees. International Journal of Remote Sensing. 27(10):2101-2109. Doi.org/10.1080/01431160500444749. [ Links ]
SIAP. 2017. Servicio de Información Agroalimentaria y Pesquera. http://www.siap.gob.mx/. [ Links ]
SIAP. 2018. Servicio de Información Agroalimentaria y Pesquera. http://www.siap.gob.mx/. [ Links ]
SIAP. 2019. Servicio de Información Agroalimentaria y Pesquera. https://www.gob.mx/siap/ documentos/boletin-mensual-de-avances-de-la-produccion-de-aguacate-103935. [ Links ]
SIACON. 2017. Sistema de Información Agroalimentaria de Consulta. https://www.gob.mx/ siap/prensa/sistema-de-informacion-agroalimentaria-de-consulta-siacon. [ Links ]
South, S.; Qi, J. and Lusch, D. P. 2004. Optimal classification methods for mapping agricultural tillage practices. Remote Sensing of Environment. 91(1):90-97. Doi.org/10.1016/j.rse.2004.03.001. [ Links ]
Toledo, R.; Alcántar, J. J.; Anguiano, J. y Chávez, G. 2009. Expansión del cultivo del aguacate y deforestación en Michoacán. Boletín El Aguacatero. No. 58. https://www.sdpnoticias.com /negocios/deforestacion-contribuye-expansion-aguacate-cultivo.html. [ Links ]
Zhang, X.; Friedl, M. A.; Tan, B.; Goldberg, M. D. and Yu, Y. 2012. Long-term detection of global vegetation phenology from satellite instruments. 297-320 pp. In: X. Zhang (ed.). Chapter 16. Phenology and climate change. ISBN 978-953-51-0336-3. In tech open access publisher. Doi:10.5772/39197. [ Links ]
Zhongming, W.; Brian, G. L.; Jiao, F.; Wanning, L. and Haijing, S. 2009. Stratified vegetation cover index: A new way to assess vegetation impact on soil erosion. Catena. 83(1):87-93. Doi.org/10.1016/j.catena.2010.07.006. [ Links ]
Received: January 01, 2020; Accepted: March 01, 2020
 Este es un artículo publicado en acceso abierto bajo una licencia
Creative Commons
Este es un artículo publicado en acceso abierto bajo una licencia
Creative Commons
